

Key Insights
The global methanol market, valued at approximately $38.74 billion in the base year 2025, is projected to experience robust growth. It is anticipated to exhibit a compound annual growth rate (CAGR) of 2.7% from 2025 to 2033. This expansion is primarily fueled by escalating demand from the chemical industry, particularly for formaldehyde production and other derivative applications. Furthermore, the energy sector's increasing adoption of methanol as a fuel and feedstock for energy-related applications, including its role in fuel cells and biofuels, significantly contributes to market expansion. Advancements in production technologies, enhancing efficiency and reducing costs, are also key growth drivers. Supportive government initiatives promoting sustainable energy solutions further bolster market prospects.
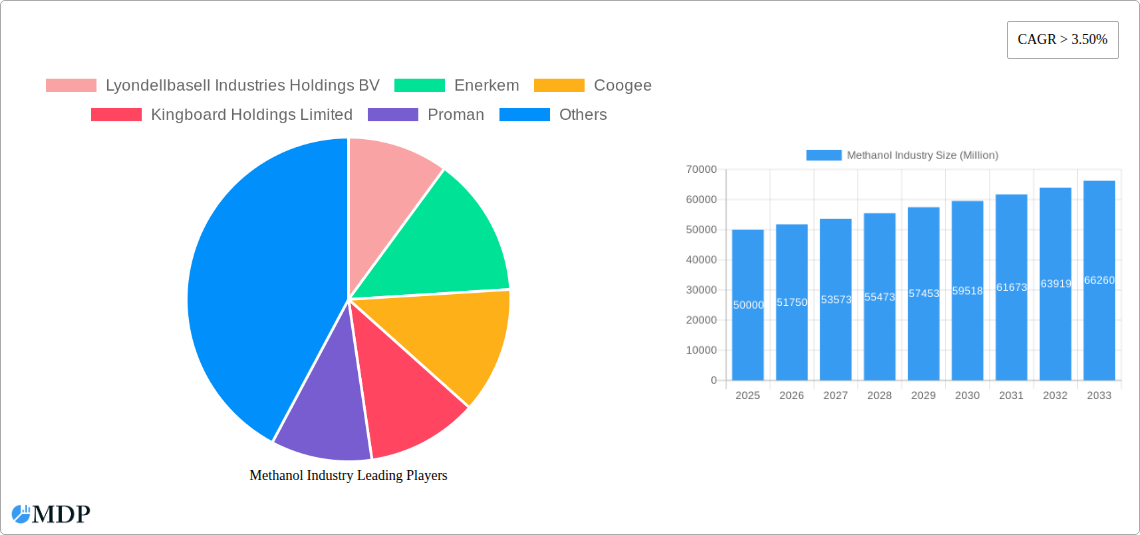
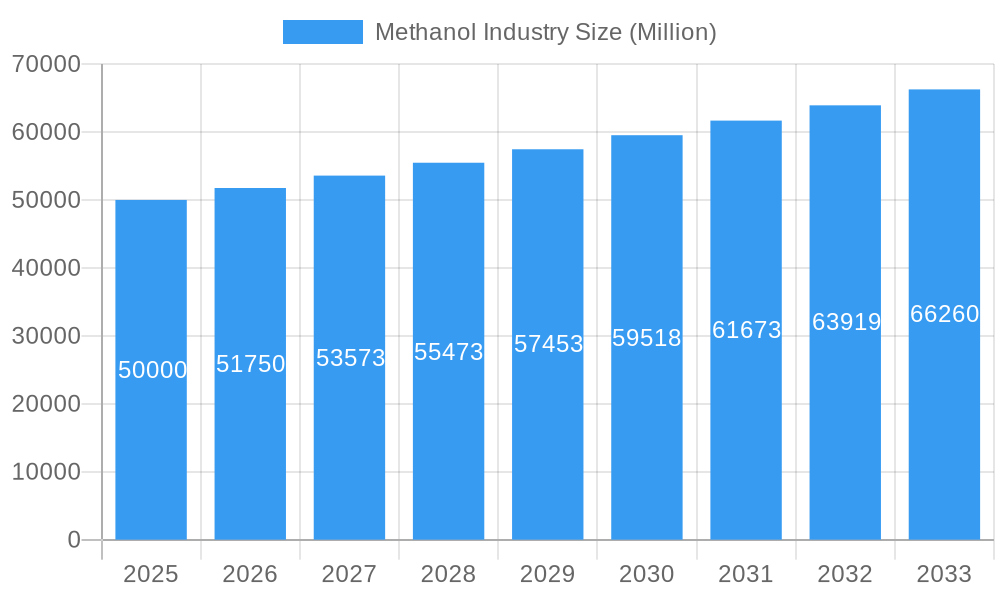
Methanol Industry Market Size (In Billion)
However, the market faces certain constraints. Volatility in crude oil prices, a primary feedstock, can impact production costs and market stability. Stringent environmental regulations regarding emissions and waste management also pose challenges. Competition from alternative chemicals and fuels necessitates continuous innovation. Regional growth will vary, with Asia-Pacific expected to lead due to rapid industrialization in China and India. North America and Europe will also see substantial growth, driven by established chemical industries and a focus on sustainable energy. The competitive landscape comprises major multinational corporations and regional players, characterized by strategic alliances and mergers and acquisitions.
Methanol Industry Company Market Share
Methanol Industry Market Report: 2019-2033
This comprehensive report provides an in-depth analysis of the methanol industry, encompassing market dynamics, leading players, technological advancements, and future growth prospects. With a focus on the period 2019-2033, this report offers crucial insights for investors, industry stakeholders, and strategic decision-makers. The report utilizes data from the historical period (2019-2024), the base year (2025), and forecasts for the period 2025-2033, delivering a robust understanding of current trends and future predictions. Millions are used for all value representations.
Methanol Industry Market Dynamics & Concentration
The global methanol market exhibits a moderately concentrated structure, with several major players holding significant market share. Market concentration is influenced by factors such as economies of scale in production, access to raw materials, and technological advancements. The market share of the top five players is estimated to be around xx%. Innovation is a key driver, with companies constantly seeking improvements in production efficiency, cost reduction, and the development of sustainable methanol production methods. Stringent environmental regulations globally are shaping the industry landscape, pushing companies towards cleaner production processes and prompting investments in renewable methanol technologies. Substitute products, such as ethanol and other chemicals, pose a competitive threat. However, methanol's versatility and established applications continue to support its market dominance. End-user trends, particularly in the energy sector and chemical manufacturing, significantly influence methanol demand. Mergers and acquisitions (M&A) activity has been moderate in recent years, with xx M&A deals recorded between 2019 and 2024. These activities, aimed at expanding market reach and enhancing technological capabilities, will continue to reshape the industry's competitive dynamics.
- Market Concentration: Top 5 players hold approximately xx% market share.
- M&A Activity (2019-2024): xx deals.
- Key Innovation Drivers: Sustainable production, process efficiency, cost reduction.
- Regulatory Impact: Stricter environmental regulations driving cleaner production methods.
Methanol Industry Industry Trends & Analysis
The methanol industry is experiencing a period of dynamic growth, driven by several key factors. The compound annual growth rate (CAGR) for the period 2025-2033 is projected to be xx%. This growth is fuelled by increasing demand from various sectors, including the traditional chemical industry, energy, and construction, where methanol finds applications in manufacturing various products, including formaldehyde, acetic acid, and methyl tertiary butyl ether (MTBE). Technological advancements are impacting the production process and enhancing efficiency. The development of sustainable methanol production using renewable resources is a significant trend. Market penetration of green methanol is expected to increase from xx% in 2025 to xx% by 2033. The competitive landscape is characterized by both established players and emerging companies specializing in sustainable methanol production. These companies are engaged in intense competition, driving innovation and enhancing the overall market offering. Consumer preferences are shifting towards environmentally friendly products, boosting the demand for sustainable methanol.
Leading Markets & Segments in Methanol Industry
The Asia-Pacific region dominates the global methanol market, accounting for approximately xx% of the total market share in 2025. This dominance is attributed to robust economic growth, expanding industrial sectors, and significant methanol production capacities within the region. China, particularly, plays a crucial role due to its large-scale chemical industry and energy demands.
Key Drivers for Asia-Pacific Dominance:
- Rapid Industrialization: High demand from burgeoning manufacturing and construction sectors.
- Government Support: Policies promoting industrial growth and chemical production.
- Large-Scale Production Facilities: Significant methanol production capacity in countries like China and India.
Application Segment Analysis:
- Traditional Chemical Applications: This segment continues to be the largest consumer of methanol, driven by the production of a wide range of chemicals.
- Other Traditional Chemicals & Energy Related: Growing demand for methanol in energy-related applications such as fuel additives and power generation fuels further supports growth.
The dominance of the Asia-Pacific region is expected to continue throughout the forecast period, driven by consistent economic growth and increasing industrial activity.
Methanol Industry Product Developments
Recent years have witnessed significant advancements in methanol production technologies, focusing on improving efficiency, reducing costs, and promoting sustainability. Innovations include the development of more efficient catalysts, optimized process designs, and the integration of renewable energy sources. These developments have led to the emergence of green methanol, produced from renewable feedstocks. This sustainable alternative is gaining traction, driven by increasing environmental concerns and government regulations. The development of new applications for methanol, such as in the production of fuels and other value-added products, further enhances its market position.
Key Drivers of Methanol Industry Growth
Several factors are driving the growth of the methanol industry. Technological advancements, particularly in sustainable production methods, are making methanol a more attractive and environmentally friendly option. Robust economic growth in developing economies fuels demand from various industrial sectors. Government policies supporting the use of renewable energy and sustainable chemicals are also significantly impacting the market. For example, policies promoting biofuels and green chemicals create opportunities for green methanol.
Challenges in the Methanol Industry Market
The methanol industry faces certain challenges, including fluctuating raw material prices, which can impact production costs and profitability. Stringent environmental regulations necessitate investments in pollution control technologies, increasing operational expenses. Intense competition among established and emerging players pressures margins. Supply chain disruptions, particularly those related to raw material sourcing and transportation, can impact overall production and availability. These factors can collectively hinder the industry’s growth trajectory. For example, the xx% increase in natural gas prices in 2022 impacted production costs by approximately xx Million.
Emerging Opportunities in Methanol Industry
The long-term growth of the methanol industry is fueled by several key opportunities. Technological breakthroughs in sustainable methanol production using renewable resources, such as carbon capture and utilization (CCU), promise to significantly enhance the environmental profile of methanol. Strategic partnerships between chemical companies and renewable energy providers are expanding the production of green methanol. Market expansion into new applications, such as fuel cells and the production of chemicals with lower carbon footprints, are creating new avenues for growth.
Leading Players in the Methanol Industry Sector
- Lyondellbasell Industries Holdings BV
- Enerkem
- Coogee
- Kingboard Holdings Limited
- Proman
- Celanese Corporation
- Ineos
- Atlantic Methanol
- Ningxia Baofeng Energy Group Co Ltd
- Gujarat State Fertilizers & Chemicals Limited (GSFC)
- ZPCIR
- BASF SE
- SABIC
- Methanex Corporation
- Petroliam Nasional Berhad
- Mitsubishi Gas Chemical Company Inc
- Eni SpA
- Mitsui & Co Ltd
- OCI NV
Key Milestones in Methanol Industry Industry
- January 2024: Enerkem announced the retirement of its Enerkem Alberta Biofuels (EAB) plant, concluding a successful commercial scale-up of its technology.
- January 2024: Mitsui & Co. and Celanese Corporation launched Fairway Methanol, a joint venture producing methanol from industrial CO2 emissions.
- January 2024: BASF SE and Envision Energy partnered to develop technology for converting green hydrogen and CO2 into sustainable methanol.
- July 2023: Enerkem and Dimeta initiated feasibility studies for large-scale waste-to-renewable DME projects.
- November 2022: Petronas commenced construction of a new methanol facility, increasing production capacity by 1.75 Million tons.
- February 2022: Linde expanded its agreement with Celanese Corporation to supply CO2 and hydrogen for methanol production, supporting environmental sustainability.
Strategic Outlook for Methanol Industry Market
The methanol industry is poised for continued growth, driven by increasing demand for sustainable alternatives and technological advancements. Strategic opportunities lie in expanding production capacity for green methanol, focusing on innovation in CCU technologies and exploring new applications in various sectors. Partnerships and collaborations will play a crucial role in fostering innovation and market expansion. The industry's future success will depend on adapting to evolving environmental regulations and consumer preferences, while maintaining a competitive edge in a dynamic market landscape.
Methanol Industry Segmentation
-
1. Application
-
1.1. Traditional Chemical
- 1.1.1. Formaldehyde
- 1.1.2. Acetic Acid
- 1.1.3. Solvent
- 1.1.4. Methylamine
- 1.1.5. Other Traditional Chemicals
-
1.2. Energy Related
- 1.2.1. Methanol-to-olefin (MTO)
- 1.2.2. Methyl Tert-butyl Ether (MTBE)
- 1.2.3. Gasoline Blending
- 1.2.4. Dimethyl Ether (DME)
- 1.2.5. Biodiesel
-
1.1. Traditional Chemical
Methanol Industry Segmentation By Geography
-
1. Asia Pacific
- 1.1. China
- 1.2. India
- 1.3. Japan
- 1.4. South Korea
- 1.5. Southeast Asia
- 1.6. Rest of Asia Pacific
-
2. North America
- 2.1. United States
- 2.2. Canada
- 2.3. Mexico
-
3. Europe
- 3.1. Germany
- 3.2. United Kingdom
- 3.3. Italy
- 3.4. France
- 3.5. Spain
- 3.6. Rest of Europe
-
4. South America
- 4.1. Brazil
- 4.2. Argentina
- 4.3. Colombia
- 4.4. Rest of South America
-
5. Middle East and Africa
- 5.1. Saudi Arabia
- 5.2. South Africa
- 5.3. Nigeria
- 5.4. United Arab Emirates
- 5.5. Rest of Middle East and Africa
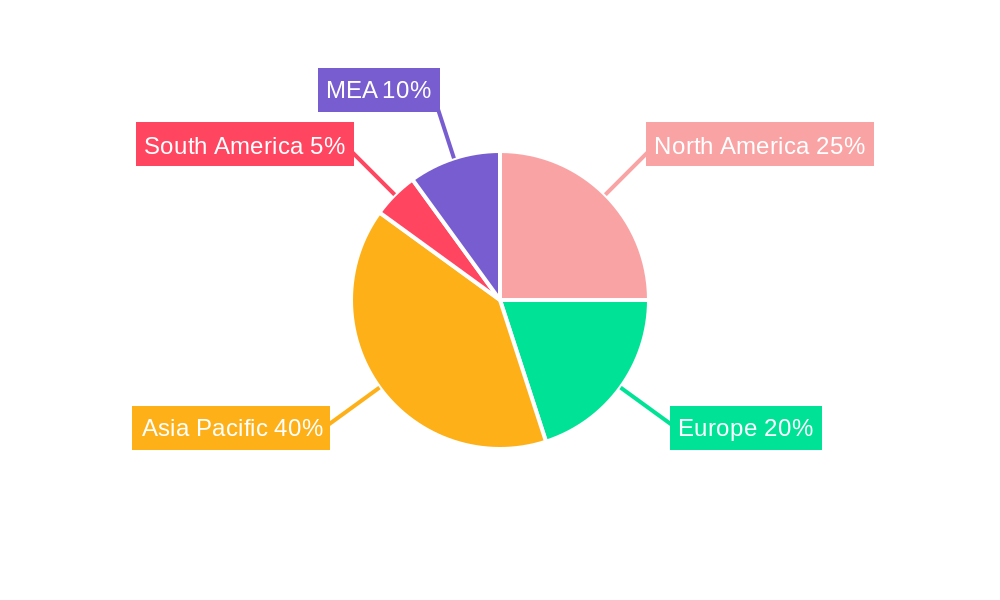
Methanol Industry Regional Market Share
Geographic Coverage of Methanol Industry
Methanol Industry REPORT HIGHLIGHTS
| Aspects | Details |
|---|---|
| Study Period | 2020-2034 |
| Base Year | 2025 |
| Estimated Year | 2026 |
| Forecast Period | 2026-2034 |
| Historical Period | 2020-2025 |
| Growth Rate | CAGR of 2.7% from 2020-2034 |
| Segmentation |
|
Table of Contents
- 1. Introduction
- 1.1. Research Scope
- 1.2. Market Segmentation
- 1.3. Research Objective
- 1.4. Definitions and Assumptions
- 2. Executive Summary
- 2.1. Market Snapshot
- 3. Market Dynamics
- 3.1. Market Drivers
- 3.2. Market Restrains
- 3.3. Market Trends
- 3.4. Market Opportunities
- 4. Market Factor Analysis
- 4.1. Porters Five Forces
- 4.1.1. Bargaining Power of Suppliers
- 4.1.2. Bargaining Power of Buyers
- 4.1.3. Threat of New Entrants
- 4.1.4. Threat of Substitutes
- 4.1.5. Competitive Rivalry
- 4.2. PESTEL analysis
- 4.3. BCG Analysis
- 4.3.1. Stars (High Growth, High Market Share)
- 4.3.2. Cash Cows (Low Growth, High Market Share)
- 4.3.3. Question Mark (High Growth, Low Market Share)
- 4.3.4. Dogs (Low Growth, Low Market Share)
- 4.4. Ansoff Matrix Analysis
- 4.5. Supply Chain Analysis
- 4.6. Regulatory Landscape
- 4.7. Current Market Potential and Opportunity Assessment (TAM–SAM–SOM Framework)
- 4.8. MDP Analyst Note
- 4.1. Porters Five Forces
- 5. Market Analysis, Insights and Forecast 2021-2033
- 5.1. Market Analysis, Insights and Forecast - by Application
- 5.1.1. Traditional Chemical
- 5.1.1.1. Formaldehyde
- 5.1.1.2. Acetic Acid
- 5.1.1.3. Solvent
- 5.1.1.4. Methylamine
- 5.1.1.5. Other Traditional Chemicals
- 5.1.2. Energy Related
- 5.1.2.1. Methanol-to-olefin (MTO)
- 5.1.2.2. Methyl Tert-butyl Ether (MTBE)
- 5.1.2.3. Gasoline Blending
- 5.1.2.4. Dimethyl Ether (DME)
- 5.1.2.5. Biodiesel
- 5.1.1. Traditional Chemical
- 5.2. Market Analysis, Insights and Forecast - by Region
- 5.2.1. Asia Pacific
- 5.2.2. North America
- 5.2.3. Europe
- 5.2.4. South America
- 5.2.5. Middle East and Africa
- 5.1. Market Analysis, Insights and Forecast - by Application
- 6. Global Methanol Industry Analysis, Insights and Forecast, 2021-2033
- 6.1. Market Analysis, Insights and Forecast - by Application
- 6.1.1. Traditional Chemical
- 6.1.1.1. Formaldehyde
- 6.1.1.2. Acetic Acid
- 6.1.1.3. Solvent
- 6.1.1.4. Methylamine
- 6.1.1.5. Other Traditional Chemicals
- 6.1.2. Energy Related
- 6.1.2.1. Methanol-to-olefin (MTO)
- 6.1.2.2. Methyl Tert-butyl Ether (MTBE)
- 6.1.2.3. Gasoline Blending
- 6.1.2.4. Dimethyl Ether (DME)
- 6.1.2.5. Biodiesel
- 6.1.1. Traditional Chemical
- 6.1. Market Analysis, Insights and Forecast - by Application
- 7. Asia Pacific Methanol Industry Analysis, Insights and Forecast, 2020-2032
- 7.1. Market Analysis, Insights and Forecast - by Application
- 7.1.1. Traditional Chemical
- 7.1.1.1. Formaldehyde
- 7.1.1.2. Acetic Acid
- 7.1.1.3. Solvent
- 7.1.1.4. Methylamine
- 7.1.1.5. Other Traditional Chemicals
- 7.1.2. Energy Related
- 7.1.2.1. Methanol-to-olefin (MTO)
- 7.1.2.2. Methyl Tert-butyl Ether (MTBE)
- 7.1.2.3. Gasoline Blending
- 7.1.2.4. Dimethyl Ether (DME)
- 7.1.2.5. Biodiesel
- 7.1.1. Traditional Chemical
- 7.1. Market Analysis, Insights and Forecast - by Application
- 8. North America Methanol Industry Analysis, Insights and Forecast, 2020-2032
- 8.1. Market Analysis, Insights and Forecast - by Application
- 8.1.1. Traditional Chemical
- 8.1.1.1. Formaldehyde
- 8.1.1.2. Acetic Acid
- 8.1.1.3. Solvent
- 8.1.1.4. Methylamine
- 8.1.1.5. Other Traditional Chemicals
- 8.1.2. Energy Related
- 8.1.2.1. Methanol-to-olefin (MTO)
- 8.1.2.2. Methyl Tert-butyl Ether (MTBE)
- 8.1.2.3. Gasoline Blending
- 8.1.2.4. Dimethyl Ether (DME)
- 8.1.2.5. Biodiesel
- 8.1.1. Traditional Chemical
- 8.1. Market Analysis, Insights and Forecast - by Application
- 9. Europe Methanol Industry Analysis, Insights and Forecast, 2020-2032
- 9.1. Market Analysis, Insights and Forecast - by Application
- 9.1.1. Traditional Chemical
- 9.1.1.1. Formaldehyde
- 9.1.1.2. Acetic Acid
- 9.1.1.3. Solvent
- 9.1.1.4. Methylamine
- 9.1.1.5. Other Traditional Chemicals
- 9.1.2. Energy Related
- 9.1.2.1. Methanol-to-olefin (MTO)
- 9.1.2.2. Methyl Tert-butyl Ether (MTBE)
- 9.1.2.3. Gasoline Blending
- 9.1.2.4. Dimethyl Ether (DME)
- 9.1.2.5. Biodiesel
- 9.1.1. Traditional Chemical
- 9.1. Market Analysis, Insights and Forecast - by Application
- 10. South America Methanol Industry Analysis, Insights and Forecast, 2020-2032
- 10.1. Market Analysis, Insights and Forecast - by Application
- 10.1.1. Traditional Chemical
- 10.1.1.1. Formaldehyde
- 10.1.1.2. Acetic Acid
- 10.1.1.3. Solvent
- 10.1.1.4. Methylamine
- 10.1.1.5. Other Traditional Chemicals
- 10.1.2. Energy Related
- 10.1.2.1. Methanol-to-olefin (MTO)
- 10.1.2.2. Methyl Tert-butyl Ether (MTBE)
- 10.1.2.3. Gasoline Blending
- 10.1.2.4. Dimethyl Ether (DME)
- 10.1.2.5. Biodiesel
- 10.1.1. Traditional Chemical
- 10.1. Market Analysis, Insights and Forecast - by Application
- 11. Middle East and Africa Methanol Industry Analysis, Insights and Forecast, 2020-2032
- 11.1. Market Analysis, Insights and Forecast - by Application
- 11.1.1. Traditional Chemical
- 11.1.1.1. Formaldehyde
- 11.1.1.2. Acetic Acid
- 11.1.1.3. Solvent
- 11.1.1.4. Methylamine
- 11.1.1.5. Other Traditional Chemicals
- 11.1.2. Energy Related
- 11.1.2.1. Methanol-to-olefin (MTO)
- 11.1.2.2. Methyl Tert-butyl Ether (MTBE)
- 11.1.2.3. Gasoline Blending
- 11.1.2.4. Dimethyl Ether (DME)
- 11.1.2.5. Biodiesel
- 11.1.1. Traditional Chemical
- 11.1. Market Analysis, Insights and Forecast - by Application
- 12. Competitive Analysis
- 12.1. Company Profiles
- 12.1.1 Lyondellbasell Industries Holdings BV
- 12.1.1.1. Company Overview
- 12.1.1.2. Products
- 12.1.1.3. Company Financials
- 12.1.1.4. SWOT Analysis
- 12.1.2 Enerkem
- 12.1.2.1. Company Overview
- 12.1.2.2. Products
- 12.1.2.3. Company Financials
- 12.1.2.4. SWOT Analysis
- 12.1.3 Coogee
- 12.1.3.1. Company Overview
- 12.1.3.2. Products
- 12.1.3.3. Company Financials
- 12.1.3.4. SWOT Analysis
- 12.1.4 Kingboard Holdings Limited
- 12.1.4.1. Company Overview
- 12.1.4.2. Products
- 12.1.4.3. Company Financials
- 12.1.4.4. SWOT Analysis
- 12.1.5 Proman
- 12.1.5.1. Company Overview
- 12.1.5.2. Products
- 12.1.5.3. Company Financials
- 12.1.5.4. SWOT Analysis
- 12.1.6 Celanese Corporation
- 12.1.6.1. Company Overview
- 12.1.6.2. Products
- 12.1.6.3. Company Financials
- 12.1.6.4. SWOT Analysis
- 12.1.7 Ineos
- 12.1.7.1. Company Overview
- 12.1.7.2. Products
- 12.1.7.3. Company Financials
- 12.1.7.4. SWOT Analysis
- 12.1.8 Atlantic Methanol
- 12.1.8.1. Company Overview
- 12.1.8.2. Products
- 12.1.8.3. Company Financials
- 12.1.8.4. SWOT Analysis
- 12.1.9 Ningxia Baofeng Energy Group Co Ltd
- 12.1.9.1. Company Overview
- 12.1.9.2. Products
- 12.1.9.3. Company Financials
- 12.1.9.4. SWOT Analysis
- 12.1.10 Gujarat State Fertilizers & Chemicals Limited (GSFC)
- 12.1.10.1. Company Overview
- 12.1.10.2. Products
- 12.1.10.3. Company Financials
- 12.1.10.4. SWOT Analysis
- 12.1.11 ZPCIR
- 12.1.11.1. Company Overview
- 12.1.11.2. Products
- 12.1.11.3. Company Financials
- 12.1.11.4. SWOT Analysis
- 12.1.12 BASF SE
- 12.1.12.1. Company Overview
- 12.1.12.2. Products
- 12.1.12.3. Company Financials
- 12.1.12.4. SWOT Analysis
- 12.1.13 SABIC
- 12.1.13.1. Company Overview
- 12.1.13.2. Products
- 12.1.13.3. Company Financials
- 12.1.13.4. SWOT Analysis
- 12.1.14 Methanex Corporation
- 12.1.14.1. Company Overview
- 12.1.14.2. Products
- 12.1.14.3. Company Financials
- 12.1.14.4. SWOT Analysis
- 12.1.15 Petroliam Nasional Berhad
- 12.1.15.1. Company Overview
- 12.1.15.2. Products
- 12.1.15.3. Company Financials
- 12.1.15.4. SWOT Analysis
- 12.1.16 Mitsubishi Gas Chemical Company Inc
- 12.1.16.1. Company Overview
- 12.1.16.2. Products
- 12.1.16.3. Company Financials
- 12.1.16.4. SWOT Analysis
- 12.1.17 Eni SpA
- 12.1.17.1. Company Overview
- 12.1.17.2. Products
- 12.1.17.3. Company Financials
- 12.1.17.4. SWOT Analysis
- 12.1.18 Mitsui & Co Ltd
- 12.1.18.1. Company Overview
- 12.1.18.2. Products
- 12.1.18.3. Company Financials
- 12.1.18.4. SWOT Analysis
- 12.1.19 OCI NV
- 12.1.19.1. Company Overview
- 12.1.19.2. Products
- 12.1.19.3. Company Financials
- 12.1.19.4. SWOT Analysis
- 12.1.1 Lyondellbasell Industries Holdings BV
- 12.2. Market Entropy
- 12.2.1 Company's Key Areas Served
- 12.2.2 Recent Developments
- 12.3. Company Market Share Analysis 2025
- 12.3.1 Top 5 Companies Market Share Analysis
- 12.3.2 Top 3 Companies Market Share Analysis
- 12.4. List of Potential Customers
- 13. Research Methodology
List of Figures
- Figure 1: Global Methanol Industry Revenue Breakdown (billion, %) by Region 2025 & 2033
- Figure 2: Global Methanol Industry Volume Breakdown (K Tons, %) by Region 2025 & 2033
- Figure 3: Asia Pacific Methanol Industry Revenue (billion), by Application 2025 & 2033
- Figure 4: Asia Pacific Methanol Industry Volume (K Tons), by Application 2025 & 2033
- Figure 5: Asia Pacific Methanol Industry Revenue Share (%), by Application 2025 & 2033
- Figure 6: Asia Pacific Methanol Industry Volume Share (%), by Application 2025 & 2033
- Figure 7: Asia Pacific Methanol Industry Revenue (billion), by Country 2025 & 2033
- Figure 8: Asia Pacific Methanol Industry Volume (K Tons), by Country 2025 & 2033
- Figure 9: Asia Pacific Methanol Industry Revenue Share (%), by Country 2025 & 2033
- Figure 10: Asia Pacific Methanol Industry Volume Share (%), by Country 2025 & 2033
- Figure 11: North America Methanol Industry Revenue (billion), by Application 2025 & 2033
- Figure 12: North America Methanol Industry Volume (K Tons), by Application 2025 & 2033
- Figure 13: North America Methanol Industry Revenue Share (%), by Application 2025 & 2033
- Figure 14: North America Methanol Industry Volume Share (%), by Application 2025 & 2033
- Figure 15: North America Methanol Industry Revenue (billion), by Country 2025 & 2033
- Figure 16: North America Methanol Industry Volume (K Tons), by Country 2025 & 2033
- Figure 17: North America Methanol Industry Revenue Share (%), by Country 2025 & 2033
- Figure 18: North America Methanol Industry Volume Share (%), by Country 2025 & 2033
- Figure 19: Europe Methanol Industry Revenue (billion), by Application 2025 & 2033
- Figure 20: Europe Methanol Industry Volume (K Tons), by Application 2025 & 2033
- Figure 21: Europe Methanol Industry Revenue Share (%), by Application 2025 & 2033
- Figure 22: Europe Methanol Industry Volume Share (%), by Application 2025 & 2033
- Figure 23: Europe Methanol Industry Revenue (billion), by Country 2025 & 2033
- Figure 24: Europe Methanol Industry Volume (K Tons), by Country 2025 & 2033
- Figure 25: Europe Methanol Industry Revenue Share (%), by Country 2025 & 2033
- Figure 26: Europe Methanol Industry Volume Share (%), by Country 2025 & 2033
- Figure 27: South America Methanol Industry Revenue (billion), by Application 2025 & 2033
- Figure 28: South America Methanol Industry Volume (K Tons), by Application 2025 & 2033
- Figure 29: South America Methanol Industry Revenue Share (%), by Application 2025 & 2033
- Figure 30: South America Methanol Industry Volume Share (%), by Application 2025 & 2033
- Figure 31: South America Methanol Industry Revenue (billion), by Country 2025 & 2033
- Figure 32: South America Methanol Industry Volume (K Tons), by Country 2025 & 2033
- Figure 33: South America Methanol Industry Revenue Share (%), by Country 2025 & 2033
- Figure 34: South America Methanol Industry Volume Share (%), by Country 2025 & 2033
- Figure 35: Middle East and Africa Methanol Industry Revenue (billion), by Application 2025 & 2033
- Figure 36: Middle East and Africa Methanol Industry Volume (K Tons), by Application 2025 & 2033
- Figure 37: Middle East and Africa Methanol Industry Revenue Share (%), by Application 2025 & 2033
- Figure 38: Middle East and Africa Methanol Industry Volume Share (%), by Application 2025 & 2033
- Figure 39: Middle East and Africa Methanol Industry Revenue (billion), by Country 2025 & 2033
- Figure 40: Middle East and Africa Methanol Industry Volume (K Tons), by Country 2025 & 2033
- Figure 41: Middle East and Africa Methanol Industry Revenue Share (%), by Country 2025 & 2033
- Figure 42: Middle East and Africa Methanol Industry Volume Share (%), by Country 2025 & 2033
List of Tables
- Table 1: Global Methanol Industry Revenue billion Forecast, by Application 2020 & 2033
- Table 2: Global Methanol Industry Volume K Tons Forecast, by Application 2020 & 2033
- Table 3: Global Methanol Industry Revenue billion Forecast, by Region 2020 & 2033
- Table 4: Global Methanol Industry Volume K Tons Forecast, by Region 2020 & 2033
- Table 5: Global Methanol Industry Revenue billion Forecast, by Application 2020 & 2033
- Table 6: Global Methanol Industry Volume K Tons Forecast, by Application 2020 & 2033
- Table 7: Global Methanol Industry Revenue billion Forecast, by Country 2020 & 2033
- Table 8: Global Methanol Industry Volume K Tons Forecast, by Country 2020 & 2033
- Table 9: China Methanol Industry Revenue (billion) Forecast, by Application 2020 & 2033
- Table 10: China Methanol Industry Volume (K Tons) Forecast, by Application 2020 & 2033
- Table 11: India Methanol Industry Revenue (billion) Forecast, by Application 2020 & 2033
- Table 12: India Methanol Industry Volume (K Tons) Forecast, by Application 2020 & 2033
- Table 13: Japan Methanol Industry Revenue (billion) Forecast, by Application 2020 & 2033
- Table 14: Japan Methanol Industry Volume (K Tons) Forecast, by Application 2020 & 2033
- Table 15: South Korea Methanol Industry Revenue (billion) Forecast, by Application 2020 & 2033
- Table 16: South Korea Methanol Industry Volume (K Tons) Forecast, by Application 2020 & 2033
- Table 17: Southeast Asia Methanol Industry Revenue (billion) Forecast, by Application 2020 & 2033
- Table 18: Southeast Asia Methanol Industry Volume (K Tons) Forecast, by Application 2020 & 2033
- Table 19: Rest of Asia Pacific Methanol Industry Revenue (billion) Forecast, by Application 2020 & 2033
- Table 20: Rest of Asia Pacific Methanol Industry Volume (K Tons) Forecast, by Application 2020 & 2033
- Table 21: Global Methanol Industry Revenue billion Forecast, by Application 2020 & 2033
- Table 22: Global Methanol Industry Volume K Tons Forecast, by Application 2020 & 2033
- Table 23: Global Methanol Industry Revenue billion Forecast, by Country 2020 & 2033
- Table 24: Global Methanol Industry Volume K Tons Forecast, by Country 2020 & 2033
- Table 25: United States Methanol Industry Revenue (billion) Forecast, by Application 2020 & 2033
- Table 26: United States Methanol Industry Volume (K Tons) Forecast, by Application 2020 & 2033
- Table 27: Canada Methanol Industry Revenue (billion) Forecast, by Application 2020 & 2033
- Table 28: Canada Methanol Industry Volume (K Tons) Forecast, by Application 2020 & 2033
- Table 29: Mexico Methanol Industry Revenue (billion) Forecast, by Application 2020 & 2033
- Table 30: Mexico Methanol Industry Volume (K Tons) Forecast, by Application 2020 & 2033
- Table 31: Global Methanol Industry Revenue billion Forecast, by Application 2020 & 2033
- Table 32: Global Methanol Industry Volume K Tons Forecast, by Application 2020 & 2033
- Table 33: Global Methanol Industry Revenue billion Forecast, by Country 2020 & 2033
- Table 34: Global Methanol Industry Volume K Tons Forecast, by Country 2020 & 2033
- Table 35: Germany Methanol Industry Revenue (billion) Forecast, by Application 2020 & 2033
- Table 36: Germany Methanol Industry Volume (K Tons) Forecast, by Application 2020 & 2033
- Table 37: United Kingdom Methanol Industry Revenue (billion) Forecast, by Application 2020 & 2033
- Table 38: United Kingdom Methanol Industry Volume (K Tons) Forecast, by Application 2020 & 2033
- Table 39: Italy Methanol Industry Revenue (billion) Forecast, by Application 2020 & 2033
- Table 40: Italy Methanol Industry Volume (K Tons) Forecast, by Application 2020 & 2033
- Table 41: France Methanol Industry Revenue (billion) Forecast, by Application 2020 & 2033
- Table 42: France Methanol Industry Volume (K Tons) Forecast, by Application 2020 & 2033
- Table 43: Spain Methanol Industry Revenue (billion) Forecast, by Application 2020 & 2033
- Table 44: Spain Methanol Industry Volume (K Tons) Forecast, by Application 2020 & 2033
- Table 45: Rest of Europe Methanol Industry Revenue (billion) Forecast, by Application 2020 & 2033
- Table 46: Rest of Europe Methanol Industry Volume (K Tons) Forecast, by Application 2020 & 2033
- Table 47: Global Methanol Industry Revenue billion Forecast, by Application 2020 & 2033
- Table 48: Global Methanol Industry Volume K Tons Forecast, by Application 2020 & 2033
- Table 49: Global Methanol Industry Revenue billion Forecast, by Country 2020 & 2033
- Table 50: Global Methanol Industry Volume K Tons Forecast, by Country 2020 & 2033
- Table 51: Brazil Methanol Industry Revenue (billion) Forecast, by Application 2020 & 2033
- Table 52: Brazil Methanol Industry Volume (K Tons) Forecast, by Application 2020 & 2033
- Table 53: Argentina Methanol Industry Revenue (billion) Forecast, by Application 2020 & 2033
- Table 54: Argentina Methanol Industry Volume (K Tons) Forecast, by Application 2020 & 2033
- Table 55: Colombia Methanol Industry Revenue (billion) Forecast, by Application 2020 & 2033
- Table 56: Colombia Methanol Industry Volume (K Tons) Forecast, by Application 2020 & 2033
- Table 57: Rest of South America Methanol Industry Revenue (billion) Forecast, by Application 2020 & 2033
- Table 58: Rest of South America Methanol Industry Volume (K Tons) Forecast, by Application 2020 & 2033
- Table 59: Global Methanol Industry Revenue billion Forecast, by Application 2020 & 2033
- Table 60: Global Methanol Industry Volume K Tons Forecast, by Application 2020 & 2033
- Table 61: Global Methanol Industry Revenue billion Forecast, by Country 2020 & 2033
- Table 62: Global Methanol Industry Volume K Tons Forecast, by Country 2020 & 2033
- Table 63: Saudi Arabia Methanol Industry Revenue (billion) Forecast, by Application 2020 & 2033
- Table 64: Saudi Arabia Methanol Industry Volume (K Tons) Forecast, by Application 2020 & 2033
- Table 65: South Africa Methanol Industry Revenue (billion) Forecast, by Application 2020 & 2033
- Table 66: South Africa Methanol Industry Volume (K Tons) Forecast, by Application 2020 & 2033
- Table 67: Nigeria Methanol Industry Revenue (billion) Forecast, by Application 2020 & 2033
- Table 68: Nigeria Methanol Industry Volume (K Tons) Forecast, by Application 2020 & 2033
- Table 69: United Arab Emirates Methanol Industry Revenue (billion) Forecast, by Application 2020 & 2033
- Table 70: United Arab Emirates Methanol Industry Volume (K Tons) Forecast, by Application 2020 & 2033
- Table 71: Rest of Middle East and Africa Methanol Industry Revenue (billion) Forecast, by Application 2020 & 2033
- Table 72: Rest of Middle East and Africa Methanol Industry Volume (K Tons) Forecast, by Application 2020 & 2033
Frequently Asked Questions
1. What is the projected Compound Annual Growth Rate (CAGR) of the Methanol Industry?
The projected CAGR is approximately 2.7%.
2. Which companies are prominent players in the Methanol Industry?
Key companies in the market include Lyondellbasell Industries Holdings BV, Enerkem, Coogee, Kingboard Holdings Limited, Proman, Celanese Corporation, Ineos, Atlantic Methanol, Ningxia Baofeng Energy Group Co Ltd, Gujarat State Fertilizers & Chemicals Limited (GSFC), ZPCIR, BASF SE, SABIC, Methanex Corporation, Petroliam Nasional Berhad, Mitsubishi Gas Chemical Company Inc, Eni SpA, Mitsui & Co Ltd, OCI NV.
3. What are the main segments of the Methanol Industry?
The market segments include Application.
4. Can you provide details about the market size?
The market size is estimated to be USD 38.74 billion as of 2022.
5. What are some drivers contributing to market growth?
Expanding Petrochemical Sector in China. United States. and Other Asia-Pacific Countries; Rising Demand for Methanol-based Fuel; Increasing Utilization of Methanol in the Production of Olefins.
6. What are the notable trends driving market growth?
Energy-related Applications to Dominate the Market.
7. Are there any restraints impacting market growth?
Usage of Ethanol Fuel or Bioethanol in Comparison to Methanol; Hazardous Impacts on Health.
8. Can you provide examples of recent developments in the market?
January 2024: Enerkem announced that it will be retiring its Enerkem Alberta Biofuels (EAB) plant in Edmonton. The facility achieved its main objective of completing the commercial scale-up of Enerkem’s industry-leading technology with more than 15,000 hours of operation producing ethanol and methanol.
9. What pricing options are available for accessing the report?
Pricing options include single-user, multi-user, and enterprise licenses priced at USD 4750, USD 5250, and USD 8750 respectively.
10. Is the market size provided in terms of value or volume?
The market size is provided in terms of value, measured in billion and volume, measured in K Tons.
11. Are there any specific market keywords associated with the report?
Yes, the market keyword associated with the report is "Methanol Industry," which aids in identifying and referencing the specific market segment covered.
12. How do I determine which pricing option suits my needs best?
The pricing options vary based on user requirements and access needs. Individual users may opt for single-user licenses, while businesses requiring broader access may choose multi-user or enterprise licenses for cost-effective access to the report.
13. Are there any additional resources or data provided in the Methanol Industry report?
While the report offers comprehensive insights, it's advisable to review the specific contents or supplementary materials provided to ascertain if additional resources or data are available.
14. How can I stay updated on further developments or reports in the Methanol Industry?
To stay informed about further developments, trends, and reports in the Methanol Industry, consider subscribing to industry newsletters, following relevant companies and organizations, or regularly checking reputable industry news sources and publications.
Methodology
Step 1 - Identification of Relevant Samples Size from Population Database


Step 2 - Approaches for Defining Global Market Size (Value, Volume* & Price*)

Note*: In applicable scenarios
Step 3 - Data Sources
Primary Research
- Web Analytics
- Survey Reports
- Research Institute
- Latest Research Reports
- Opinion Leaders
Secondary Research
- Annual Reports
- White Paper
- Latest Press Release
- Industry Association
- Paid Database
- Investor Presentations

Step 4 - Data Triangulation
Involves using different sources of information in order to increase the validity of a study
These sources are likely to be stakeholders in a program - participants, other researchers, program staff, other community members, and so on.
Then we put all data in single framework & apply various statistical tools to find out the dynamic on the market.
During the analysis stage, feedback from the stakeholder groups would be compared to determine areas of agreement as well as areas of divergence