

Key Insights
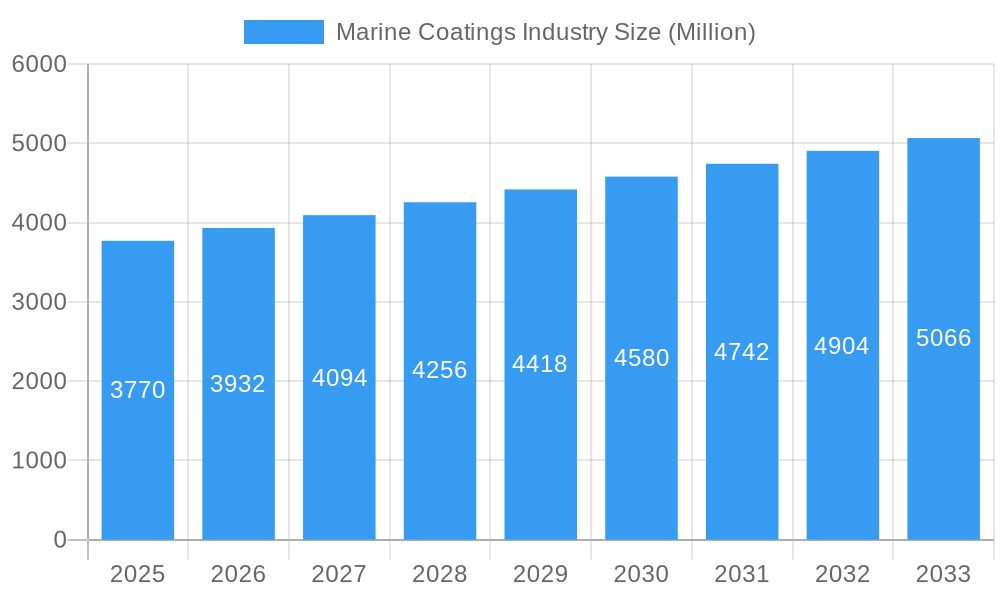
The global Marine Coatings market is poised for substantial growth, projected to reach approximately USD 3.77 billion, expanding at a robust Compound Annual Growth Rate (CAGR) exceeding 4.50% during the study period of 2019-2033. This upward trajectory is primarily fueled by the increasing demand for advanced anti-corrosion and antifouling coatings, essential for protecting vessels from harsh marine environments and enhancing fuel efficiency. The "Drivers" of this market expansion include escalating global trade necessitating a larger and more active shipping fleet, coupled with stringent environmental regulations pushing for the adoption of eco-friendly and low-VOC (Volatile Organic Compound) coating technologies. Furthermore, significant investments in shipbuilding and the expansion of offshore industries, such as oil and gas exploration and renewable energy installations (e.g., offshore wind farms), are creating substantial opportunities for marine coating manufacturers. The "Trends" shaping the market include a strong shift towards water-borne and UV-cured coating technologies due to their reduced environmental impact and faster curing times. Innovations in foul-release coatings, designed to prevent marine organism adhesion without the use of biocides, are also gaining traction.
Marine Coatings Industry Market Size (In Billion)
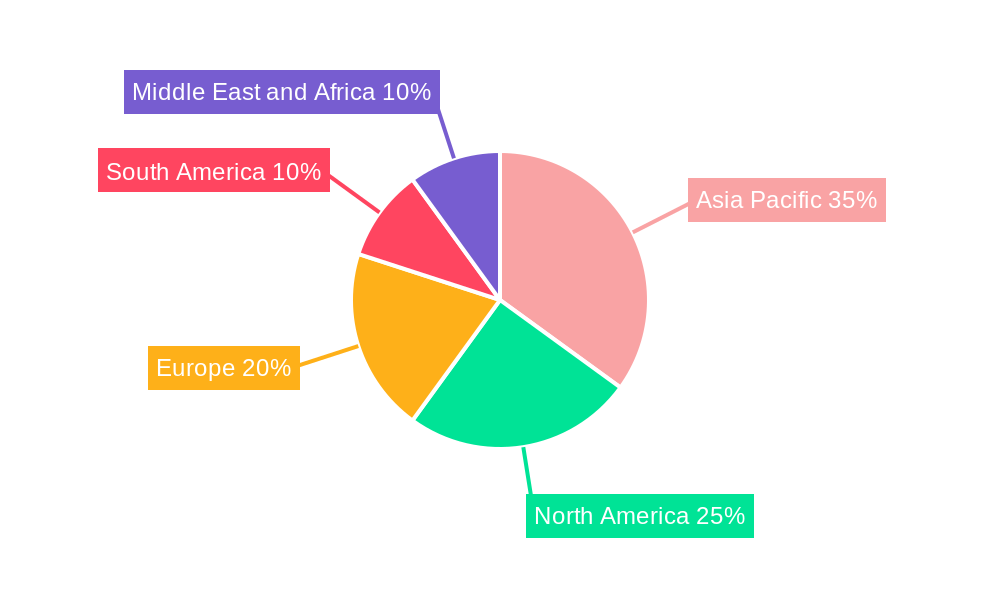
The market is segmented by Type, with Anti-corrosion and Antifouling coatings holding significant shares, while "Other Types" like foul-release and moisture-cure coatings are witnessing rapid adoption. In terms of Resin, Epoxy coatings remain dominant due to their excellent adhesion and chemical resistance, but Polyurethane and Acrylic resins are increasingly favored for their flexibility and aesthetic appeal. The Technology segment sees a pronounced shift towards sustainable options like water-borne coatings, driven by environmental consciousness. Application-wise, the Marine OEM sector, catering to new shipbuilding, is a major revenue generator, with the Marine Aftermarket experiencing steady growth due to regular maintenance and retrofitting needs. Geographically, the Asia Pacific region, led by China and India, is the largest and fastest-growing market, owing to its expansive shipbuilding industry and increasing maritime trade. Europe and North America are significant markets, driven by stringent environmental standards and demand for high-performance coatings in their established maritime sectors. Key players like AkzoNobel N.V., The Sherwin-Williams Company, Jotun, and Chugoku Marine Paints Ltd. are actively involved in research and development to introduce innovative and sustainable solutions.
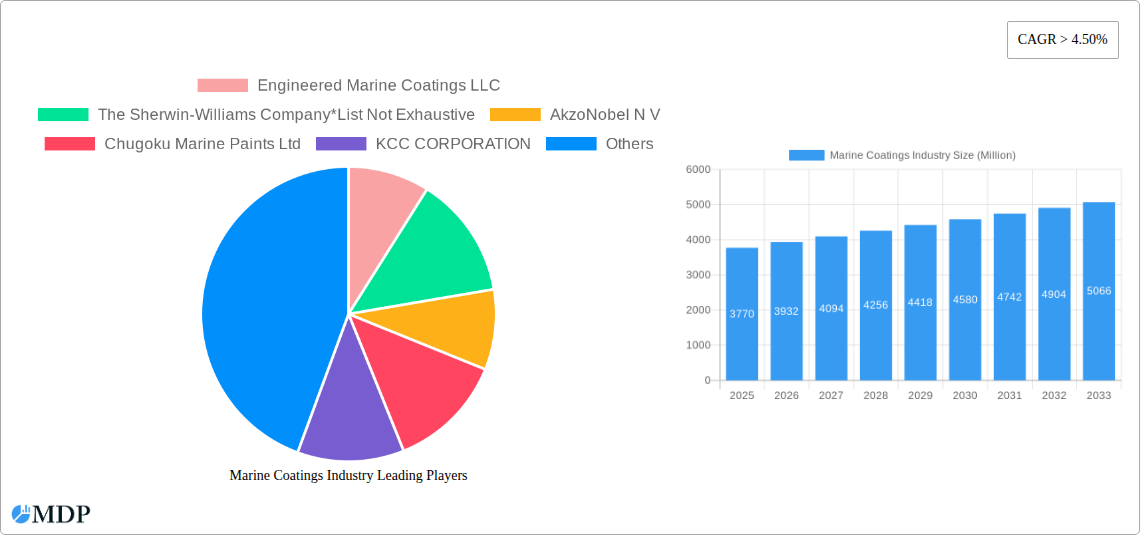
Marine Coatings Industry Company Market Share
Marine Coatings Industry Market Dynamics & Concentration
The global marine coatings market is characterized by moderate concentration, with a few dominant players holding significant market share. Engineered Marine Coatings LLC, The Sherwin-Williams Company, AkzoNobel N.V., Chugoku Marine Paints Ltd., KCC CORPORATION, Jotun, RPM International Inc., Kansai Paint Marine Co. Ltd., Pettit Marine Paints, PPG Industries Inc., BOERO BARTOLOMEO S.p.A., Nippon Paint Marine Coatings Co. Ltd., BASF SE, Axalta Coating Systems, Hempel A/S, and MCU COATING INTERNATIONAL are key contributors, though this list is not exhaustive. Innovation remains a primary driver, fueled by the industry's constant need for enhanced performance, environmental compliance, and operational efficiency. Stringent regulatory frameworks, particularly concerning emissions and biofouling, are shaping product development and market entry. The threat of product substitutes, while present in the form of alternative hull cleaning technologies, is mitigated by the established performance and widespread adoption of advanced marine coatings. End-user trends highlight a growing demand for sustainable solutions, reduced lifecycle costs, and coatings that contribute to fuel efficiency and reduced carbon footprints. Merger and acquisition activities, though not at extreme levels, are observed as companies seek to expand their geographic reach, technological capabilities, and product portfolios. For instance, the M&A deal count in the historical period 2019-2024 is estimated at xx, indicating strategic consolidation efforts.
Marine Coatings Industry Trends & Analysis
The global marine coatings market is poised for significant expansion, driven by a confluence of technological advancements, evolving regulatory landscapes, and shifting consumer preferences. The market is projected to witness a Compound Annual Growth Rate (CAGR) of approximately xx% during the forecast period of 2025–2033. This growth is underpinned by the increasing global trade and shipping activities, necessitating robust protection for vessels against harsh marine environments. Technological disruptions are primarily focused on the development of eco-friendly and high-performance coatings. The shift towards water-borne and foul-release technologies, as opposed to traditional solvent-borne and biocidal antifouling systems, is a prominent trend. This is a direct response to increasing environmental regulations and a growing demand for sustainable shipping practices. Consumer preferences are increasingly leaning towards coatings that offer extended service life, reduced maintenance requirements, and demonstrable fuel savings. The competitive dynamics within the industry are intense, with established players continuously investing in R&D to maintain their market leadership. New entrants face high barriers to entry due to stringent certification processes and the need for substantial capital investment in specialized manufacturing facilities. Market penetration of advanced coating technologies is steadily increasing across all maritime segments, from commercial shipping to recreational boating. The economic viability of these advanced coatings, considering their long-term benefits in terms of fuel efficiency and reduced downtime, is a key factor driving their adoption. Furthermore, the growing emphasis on preventative maintenance and asset longevity in the maritime sector is creating sustained demand for high-quality marine coatings.
Leading Markets & Segments in Marine Coatings Industry
The Anti-corrosion segment is a dominant force within the marine coatings industry, driven by the imperative to protect vital marine assets from the corrosive effects of saltwater and harsh weather conditions. Its estimated market share is a substantial xx% of the total market value.
- Economic Policies: Government initiatives promoting shipbuilding and maritime infrastructure development globally significantly boost demand for anti-corrosion coatings.
- Infrastructure: The expansion and maintenance of ports, offshore platforms, and naval fleets require extensive application of these protective coatings.
The Antifouling segment, particularly with the rise of advanced foul-release technologies, is another critical area experiencing robust growth. While traditional biocidal antifouling coatings remain prevalent, there is a discernible shift towards environmentally friendlier alternatives.
- Regulatory Frameworks: Stricter regulations on biocides are pushing the development and adoption of non-toxic foul-release coatings.
- Fuel Efficiency Demands: Antifouling coatings play a crucial role in maintaining smooth hull surfaces, directly impacting fuel consumption and reducing carbon emissions, a key driver for shipowners.
In terms of resin technology, Epoxy coatings continue to dominate due to their exceptional adhesion, chemical resistance, and durability, making them ideal for protective primers and intermediate coats.
- Performance Advantages: The superior mechanical properties and long-term protection offered by epoxy resins are indispensable for demanding marine applications.
Polyurethane coatings are gaining traction, especially in topcoat applications, owing to their excellent UV resistance, flexibility, and aesthetic appeal.
- Durability & Aesthetics: Polyurethanes provide a balance of protection and visual finish, crucial for both commercial and recreational vessels.
From an application perspective, the Marine OEM segment holds a larger share, as new vessels are typically coated during their construction phase. However, the Marine Aftermarket is steadily growing, driven by the need for maintenance, repair, and retrofitting of existing fleets.
- New Vessel Construction: Global shipbuilding volumes directly correlate with the demand for OEM marine coatings.
- Fleet Age & Maintenance Cycles: The aging global fleet necessitates regular maintenance and re-coating, fueling aftermarket sales.
Geographically, Asia-Pacific remains the leading region, accounting for over xx% of the global marine coatings market, driven by its dominance in shipbuilding and a rapidly expanding maritime trade. Within this region, countries like China, South Korea, and Japan are major consumers and producers of marine coatings.
Marine Coatings Industry Product Developments
The marine coatings industry is witnessing a surge in product innovation focused on sustainability, enhanced performance, and reduced environmental impact. Key developments include the launch of advanced foul-release coatings that prevent marine growth through low-friction surfaces, rather than biocides. Furthermore, manufacturers are heavily investing in water-borne formulations and low-VOC (Volatile Organic Compound) solvent-borne coatings to comply with stringent environmental regulations and meet growing demands for eco-friendly solutions. Innovations in UV-cured and powder coatings are also emerging, offering faster application times and improved durability for specific applications. These advancements aim to provide shipowners with solutions that reduce fuel consumption, minimize operational downtime, and extend the lifespan of vessel assets.
Key Drivers of Marine Coatings Industry Growth
The marine coatings industry is propelled by several significant growth drivers. Firstly, the robust growth in global trade and shipping volumes necessitates the construction and maintenance of a larger fleet, directly increasing the demand for protective coatings. Secondly, increasingly stringent environmental regulations worldwide are pushing for the development and adoption of sustainable, low-VOC, and biocide-free coating technologies, creating new market opportunities. Thirdly, technological advancements in coating formulations, leading to enhanced durability, fuel efficiency, and anti-fouling properties, are encouraging the upgrade of existing vessels and the specification of superior coatings for new builds. Finally, the growing emphasis on extending the lifespan of marine assets and reducing lifecycle costs further fuels the demand for high-performance marine coatings.
Challenges in the Marine Coatings Industry Market
Despite its growth trajectory, the marine coatings industry faces several challenges. Stringent and evolving environmental regulations, while driving innovation, also pose a significant barrier to market entry and necessitate substantial R&D investment for compliance. Fluctuations in raw material prices, particularly for petrochemical derivatives used in coating formulations, can impact profitability and pricing strategies. The complex and often lengthy supply chains for raw materials and finished goods can lead to delays and increased logistical costs. Furthermore, intense competition among established players and emerging low-cost alternatives can exert downward pressure on profit margins. The initial high cost of advanced, environmentally friendly coatings can also be a deterrent for some operators, especially in price-sensitive segments.
Emerging Opportunities in Marine Coatings Industry
Emerging opportunities in the marine coatings industry are largely driven by the global push towards decarbonization and sustainability in the maritime sector. The development and widespread adoption of ballast water management systems and the demand for coatings that actively contribute to fuel efficiency and reduced carbon emissions present significant growth catalysts. The increasing interest in offshore renewable energy installations, such as wind farms, opens up new markets for specialized protective coatings. Furthermore, strategic partnerships between coating manufacturers and shipyards, as well as the adoption of digital technologies for application monitoring and performance analysis, are creating avenues for market expansion and value creation. The growing demand for retrofitting older vessels with advanced coating systems also represents a substantial opportunity.
Leading Players in the Marine Coatings Industry Sector
- Engineered Marine Coatings LLC
- The Sherwin-Williams Company
- AkzoNobel N.V.
- Chugoku Marine Paints Ltd.
- KCC CORPORATION
- Jotun
- RPM International Inc.
- Kansai Paint Marine Co. Ltd.
- Pettit Marine Paints
- PPG Industries Inc.
- BOERO BARTOLOMEO S.p.A.
- Nippon Paint Marine Coatings Co. Ltd.
- BASF SE
- Axalta Coating Systems
- Hempel A/S
- MCU COATING INTERNATIONAL
Key Milestones in Marine Coatings Industry Industry
- March 2023: PPG launched the PPG SIGMAGLIDE 2390 marine coating to help shipowners lower power consumption and carbon emissions and meet demands for higher performance without adversely impacting the marine environment.
- March 2023: Hempel joined the International Maritime Organization's (IMO) Global Industry Alliance (GIA) for Marine Biosafety to collaborate with the industry to reduce shipping emissions and mitigate the spread of invasive species.
Strategic Outlook for Marine Coatings Industry Market
The strategic outlook for the marine coatings industry is characterized by a strong emphasis on innovation, sustainability, and value-added solutions. Growth accelerators will include the continued development of eco-friendly coatings, such as foul-release technologies and water-borne formulations, driven by stringent environmental regulations and customer demand. The focus on coatings that enhance fuel efficiency and reduce carbon emissions will remain paramount, creating opportunities for advanced product offerings. Expansion into emerging markets, particularly those with burgeoning maritime sectors, and strategic collaborations with shipyards and other industry stakeholders will be key to capturing market share. Furthermore, leveraging digital technologies for enhanced product application, performance monitoring, and customer service will be crucial for competitive advantage and long-term success in this dynamic industry.
Marine Coatings Industry Segmentation
-
1. Type
- 1.1. Anti-corrosion
- 1.2. Antifouling
- 1.3. Other Types (Foul Release, Moisture Cure, etc.)
-
2. Resin
- 2.1. Epoxy
- 2.2. Polyurethane
- 2.3. Acrylic
- 2.4. Alkyd
- 2.5. Other Resins (Polyester, Fluoropolymer, etc.)
-
3. Technology
- 3.1. Water-borne
- 3.2. Solvent-borne
- 3.3. UV-cured
- 3.4. Powder Coatings
-
4. Application
- 4.1. Marine OEM
- 4.2. Marine Aftermarket
Marine Coatings Industry Segmentation By Geography
-
1. Asia Pacific
- 1.1. China
- 1.2. India
- 1.3. Japan
- 1.4. South Korea
- 1.5. Malaysia
- 1.6. Vietnam
- 1.7. Rest of Asia Pacific
-
2. North America
- 2.1. United States
- 2.2. Canada
- 2.3. Mexico
-
3. Europe
- 3.1. Germany
- 3.2. United Kingdom
- 3.3. Italy
- 3.4. France
- 3.5. Rest of Europe
-
4. South America
- 4.1. Brazil
- 4.2. Argentina
- 4.3. Rest of South America
-
5. Middle East and Africa
- 5.1. Saudi Arabia
- 5.2. South Africa
- 5.3. Rest of Middle East and Africa
Marine Coatings Industry Regional Market Share
Geographic Coverage of Marine Coatings Industry
Marine Coatings Industry REPORT HIGHLIGHTS
| Aspects | Details |
|---|---|
| Study Period | 2020-2034 |
| Base Year | 2025 |
| Estimated Year | 2026 |
| Forecast Period | 2026-2034 |
| Historical Period | 2020-2025 |
| Growth Rate | CAGR of > 4.50% from 2020-2034 |
| Segmentation |
|
Table of Contents
- 1. Introduction
- 1.1. Research Scope
- 1.2. Market Segmentation
- 1.3. Research Objective
- 1.4. Definitions and Assumptions
- 2. Executive Summary
- 2.1. Market Snapshot
- 3. Market Dynamics
- 3.1. Market Drivers
- 3.2. Market Restrains
- 3.3. Market Trends
- 3.4. Market Opportunities
- 4. Market Factor Analysis
- 4.1. Porters Five Forces
- 4.1.1. Bargaining Power of Suppliers
- 4.1.2. Bargaining Power of Buyers
- 4.1.3. Threat of New Entrants
- 4.1.4. Threat of Substitutes
- 4.1.5. Competitive Rivalry
- 4.2. PESTEL analysis
- 4.3. BCG Analysis
- 4.3.1. Stars (High Growth, High Market Share)
- 4.3.2. Cash Cows (Low Growth, High Market Share)
- 4.3.3. Question Mark (High Growth, Low Market Share)
- 4.3.4. Dogs (Low Growth, Low Market Share)
- 4.4. Ansoff Matrix Analysis
- 4.5. Supply Chain Analysis
- 4.6. Regulatory Landscape
- 4.7. Current Market Potential and Opportunity Assessment (TAM–SAM–SOM Framework)
- 4.8. MDP Analyst Note
- 4.1. Porters Five Forces
- 5. Market Analysis, Insights and Forecast 2021-2033
- 5.1. Market Analysis, Insights and Forecast - by Type
- 5.1.1. Anti-corrosion
- 5.1.2. Antifouling
- 5.1.3. Other Types (Foul Release, Moisture Cure, etc.)
- 5.2. Market Analysis, Insights and Forecast - by Resin
- 5.2.1. Epoxy
- 5.2.2. Polyurethane
- 5.2.3. Acrylic
- 5.2.4. Alkyd
- 5.2.5. Other Resins (Polyester, Fluoropolymer, etc.)
- 5.3. Market Analysis, Insights and Forecast - by Technology
- 5.3.1. Water-borne
- 5.3.2. Solvent-borne
- 5.3.3. UV-cured
- 5.3.4. Powder Coatings
- 5.4. Market Analysis, Insights and Forecast - by Application
- 5.4.1. Marine OEM
- 5.4.2. Marine Aftermarket
- 5.5. Market Analysis, Insights and Forecast - by Region
- 5.5.1. Asia Pacific
- 5.5.2. North America
- 5.5.3. Europe
- 5.5.4. South America
- 5.5.5. Middle East and Africa
- 5.1. Market Analysis, Insights and Forecast - by Type
- 6. Global Marine Coatings Industry Analysis, Insights and Forecast, 2021-2033
- 6.1. Market Analysis, Insights and Forecast - by Type
- 6.1.1. Anti-corrosion
- 6.1.2. Antifouling
- 6.1.3. Other Types (Foul Release, Moisture Cure, etc.)
- 6.2. Market Analysis, Insights and Forecast - by Resin
- 6.2.1. Epoxy
- 6.2.2. Polyurethane
- 6.2.3. Acrylic
- 6.2.4. Alkyd
- 6.2.5. Other Resins (Polyester, Fluoropolymer, etc.)
- 6.3. Market Analysis, Insights and Forecast - by Technology
- 6.3.1. Water-borne
- 6.3.2. Solvent-borne
- 6.3.3. UV-cured
- 6.3.4. Powder Coatings
- 6.4. Market Analysis, Insights and Forecast - by Application
- 6.4.1. Marine OEM
- 6.4.2. Marine Aftermarket
- 6.1. Market Analysis, Insights and Forecast - by Type
- 7. Asia Pacific Marine Coatings Industry Analysis, Insights and Forecast, 2020-2032
- 7.1. Market Analysis, Insights and Forecast - by Type
- 7.1.1. Anti-corrosion
- 7.1.2. Antifouling
- 7.1.3. Other Types (Foul Release, Moisture Cure, etc.)
- 7.2. Market Analysis, Insights and Forecast - by Resin
- 7.2.1. Epoxy
- 7.2.2. Polyurethane
- 7.2.3. Acrylic
- 7.2.4. Alkyd
- 7.2.5. Other Resins (Polyester, Fluoropolymer, etc.)
- 7.3. Market Analysis, Insights and Forecast - by Technology
- 7.3.1. Water-borne
- 7.3.2. Solvent-borne
- 7.3.3. UV-cured
- 7.3.4. Powder Coatings
- 7.4. Market Analysis, Insights and Forecast - by Application
- 7.4.1. Marine OEM
- 7.4.2. Marine Aftermarket
- 7.1. Market Analysis, Insights and Forecast - by Type
- 8. North America Marine Coatings Industry Analysis, Insights and Forecast, 2020-2032
- 8.1. Market Analysis, Insights and Forecast - by Type
- 8.1.1. Anti-corrosion
- 8.1.2. Antifouling
- 8.1.3. Other Types (Foul Release, Moisture Cure, etc.)
- 8.2. Market Analysis, Insights and Forecast - by Resin
- 8.2.1. Epoxy
- 8.2.2. Polyurethane
- 8.2.3. Acrylic
- 8.2.4. Alkyd
- 8.2.5. Other Resins (Polyester, Fluoropolymer, etc.)
- 8.3. Market Analysis, Insights and Forecast - by Technology
- 8.3.1. Water-borne
- 8.3.2. Solvent-borne
- 8.3.3. UV-cured
- 8.3.4. Powder Coatings
- 8.4. Market Analysis, Insights and Forecast - by Application
- 8.4.1. Marine OEM
- 8.4.2. Marine Aftermarket
- 8.1. Market Analysis, Insights and Forecast - by Type
- 9. Europe Marine Coatings Industry Analysis, Insights and Forecast, 2020-2032
- 9.1. Market Analysis, Insights and Forecast - by Type
- 9.1.1. Anti-corrosion
- 9.1.2. Antifouling
- 9.1.3. Other Types (Foul Release, Moisture Cure, etc.)
- 9.2. Market Analysis, Insights and Forecast - by Resin
- 9.2.1. Epoxy
- 9.2.2. Polyurethane
- 9.2.3. Acrylic
- 9.2.4. Alkyd
- 9.2.5. Other Resins (Polyester, Fluoropolymer, etc.)
- 9.3. Market Analysis, Insights and Forecast - by Technology
- 9.3.1. Water-borne
- 9.3.2. Solvent-borne
- 9.3.3. UV-cured
- 9.3.4. Powder Coatings
- 9.4. Market Analysis, Insights and Forecast - by Application
- 9.4.1. Marine OEM
- 9.4.2. Marine Aftermarket
- 9.1. Market Analysis, Insights and Forecast - by Type
- 10. South America Marine Coatings Industry Analysis, Insights and Forecast, 2020-2032
- 10.1. Market Analysis, Insights and Forecast - by Type
- 10.1.1. Anti-corrosion
- 10.1.2. Antifouling
- 10.1.3. Other Types (Foul Release, Moisture Cure, etc.)
- 10.2. Market Analysis, Insights and Forecast - by Resin
- 10.2.1. Epoxy
- 10.2.2. Polyurethane
- 10.2.3. Acrylic
- 10.2.4. Alkyd
- 10.2.5. Other Resins (Polyester, Fluoropolymer, etc.)
- 10.3. Market Analysis, Insights and Forecast - by Technology
- 10.3.1. Water-borne
- 10.3.2. Solvent-borne
- 10.3.3. UV-cured
- 10.3.4. Powder Coatings
- 10.4. Market Analysis, Insights and Forecast - by Application
- 10.4.1. Marine OEM
- 10.4.2. Marine Aftermarket
- 10.1. Market Analysis, Insights and Forecast - by Type
- 11. Middle East and Africa Marine Coatings Industry Analysis, Insights and Forecast, 2020-2032
- 11.1. Market Analysis, Insights and Forecast - by Type
- 11.1.1. Anti-corrosion
- 11.1.2. Antifouling
- 11.1.3. Other Types (Foul Release, Moisture Cure, etc.)
- 11.2. Market Analysis, Insights and Forecast - by Resin
- 11.2.1. Epoxy
- 11.2.2. Polyurethane
- 11.2.3. Acrylic
- 11.2.4. Alkyd
- 11.2.5. Other Resins (Polyester, Fluoropolymer, etc.)
- 11.3. Market Analysis, Insights and Forecast - by Technology
- 11.3.1. Water-borne
- 11.3.2. Solvent-borne
- 11.3.3. UV-cured
- 11.3.4. Powder Coatings
- 11.4. Market Analysis, Insights and Forecast - by Application
- 11.4.1. Marine OEM
- 11.4.2. Marine Aftermarket
- 11.1. Market Analysis, Insights and Forecast - by Type
- 12. Competitive Analysis
- 12.1. Company Profiles
- 12.1.1 Engineered Marine Coatings LLC
- 12.1.1.1. Company Overview
- 12.1.1.2. Products
- 12.1.1.3. Company Financials
- 12.1.1.4. SWOT Analysis
- 12.1.2 The Sherwin-Williams Company*List Not Exhaustive
- 12.1.2.1. Company Overview
- 12.1.2.2. Products
- 12.1.2.3. Company Financials
- 12.1.2.4. SWOT Analysis
- 12.1.3 AkzoNobel N V
- 12.1.3.1. Company Overview
- 12.1.3.2. Products
- 12.1.3.3. Company Financials
- 12.1.3.4. SWOT Analysis
- 12.1.4 Chugoku Marine Paints Ltd
- 12.1.4.1. Company Overview
- 12.1.4.2. Products
- 12.1.4.3. Company Financials
- 12.1.4.4. SWOT Analysis
- 12.1.5 KCC CORPORATION
- 12.1.5.1. Company Overview
- 12.1.5.2. Products
- 12.1.5.3. Company Financials
- 12.1.5.4. SWOT Analysis
- 12.1.6 Jotun
- 12.1.6.1. Company Overview
- 12.1.6.2. Products
- 12.1.6.3. Company Financials
- 12.1.6.4. SWOT Analysis
- 12.1.7 RPM International Inc
- 12.1.7.1. Company Overview
- 12.1.7.2. Products
- 12.1.7.3. Company Financials
- 12.1.7.4. SWOT Analysis
- 12.1.8 Kansai Paint Marine Co Ltd
- 12.1.8.1. Company Overview
- 12.1.8.2. Products
- 12.1.8.3. Company Financials
- 12.1.8.4. SWOT Analysis
- 12.1.9 Pettit Marine Paints
- 12.1.9.1. Company Overview
- 12.1.9.2. Products
- 12.1.9.3. Company Financials
- 12.1.9.4. SWOT Analysis
- 12.1.10 PPG Industries Inc
- 12.1.10.1. Company Overview
- 12.1.10.2. Products
- 12.1.10.3. Company Financials
- 12.1.10.4. SWOT Analysis
- 12.1.11 BOERO BARTOLOMEO S p A
- 12.1.11.1. Company Overview
- 12.1.11.2. Products
- 12.1.11.3. Company Financials
- 12.1.11.4. SWOT Analysis
- 12.1.12 Nippon Paint Marine Coatings Co Ltd
- 12.1.12.1. Company Overview
- 12.1.12.2. Products
- 12.1.12.3. Company Financials
- 12.1.12.4. SWOT Analysis
- 12.1.13 BASF SE
- 12.1.13.1. Company Overview
- 12.1.13.2. Products
- 12.1.13.3. Company Financials
- 12.1.13.4. SWOT Analysis
- 12.1.14 Axalta Coating Systems
- 12.1.14.1. Company Overview
- 12.1.14.2. Products
- 12.1.14.3. Company Financials
- 12.1.14.4. SWOT Analysis
- 12.1.15 Hempel A/S
- 12.1.15.1. Company Overview
- 12.1.15.2. Products
- 12.1.15.3. Company Financials
- 12.1.15.4. SWOT Analysis
- 12.1.16 MCU COATING INTERNATIONAL
- 12.1.16.1. Company Overview
- 12.1.16.2. Products
- 12.1.16.3. Company Financials
- 12.1.16.4. SWOT Analysis
- 12.1.1 Engineered Marine Coatings LLC
- 12.2. Market Entropy
- 12.2.1 Company's Key Areas Served
- 12.2.2 Recent Developments
- 12.3. Company Market Share Analysis 2025
- 12.3.1 Top 5 Companies Market Share Analysis
- 12.3.2 Top 3 Companies Market Share Analysis
- 12.4. List of Potential Customers
- 13. Research Methodology
List of Figures
- Figure 1: Global Marine Coatings Industry Revenue Breakdown (Million, %) by Region 2025 & 2033
- Figure 2: Global Marine Coatings Industry Volume Breakdown (liter , %) by Region 2025 & 2033
- Figure 3: Asia Pacific Marine Coatings Industry Revenue (Million), by Type 2025 & 2033
- Figure 4: Asia Pacific Marine Coatings Industry Volume (liter ), by Type 2025 & 2033
- Figure 5: Asia Pacific Marine Coatings Industry Revenue Share (%), by Type 2025 & 2033
- Figure 6: Asia Pacific Marine Coatings Industry Volume Share (%), by Type 2025 & 2033
- Figure 7: Asia Pacific Marine Coatings Industry Revenue (Million), by Resin 2025 & 2033
- Figure 8: Asia Pacific Marine Coatings Industry Volume (liter ), by Resin 2025 & 2033
- Figure 9: Asia Pacific Marine Coatings Industry Revenue Share (%), by Resin 2025 & 2033
- Figure 10: Asia Pacific Marine Coatings Industry Volume Share (%), by Resin 2025 & 2033
- Figure 11: Asia Pacific Marine Coatings Industry Revenue (Million), by Technology 2025 & 2033
- Figure 12: Asia Pacific Marine Coatings Industry Volume (liter ), by Technology 2025 & 2033
- Figure 13: Asia Pacific Marine Coatings Industry Revenue Share (%), by Technology 2025 & 2033
- Figure 14: Asia Pacific Marine Coatings Industry Volume Share (%), by Technology 2025 & 2033
- Figure 15: Asia Pacific Marine Coatings Industry Revenue (Million), by Application 2025 & 2033
- Figure 16: Asia Pacific Marine Coatings Industry Volume (liter ), by Application 2025 & 2033
- Figure 17: Asia Pacific Marine Coatings Industry Revenue Share (%), by Application 2025 & 2033
- Figure 18: Asia Pacific Marine Coatings Industry Volume Share (%), by Application 2025 & 2033
- Figure 19: Asia Pacific Marine Coatings Industry Revenue (Million), by Country 2025 & 2033
- Figure 20: Asia Pacific Marine Coatings Industry Volume (liter ), by Country 2025 & 2033
- Figure 21: Asia Pacific Marine Coatings Industry Revenue Share (%), by Country 2025 & 2033
- Figure 22: Asia Pacific Marine Coatings Industry Volume Share (%), by Country 2025 & 2033
- Figure 23: North America Marine Coatings Industry Revenue (Million), by Type 2025 & 2033
- Figure 24: North America Marine Coatings Industry Volume (liter ), by Type 2025 & 2033
- Figure 25: North America Marine Coatings Industry Revenue Share (%), by Type 2025 & 2033
- Figure 26: North America Marine Coatings Industry Volume Share (%), by Type 2025 & 2033
- Figure 27: North America Marine Coatings Industry Revenue (Million), by Resin 2025 & 2033
- Figure 28: North America Marine Coatings Industry Volume (liter ), by Resin 2025 & 2033
- Figure 29: North America Marine Coatings Industry Revenue Share (%), by Resin 2025 & 2033
- Figure 30: North America Marine Coatings Industry Volume Share (%), by Resin 2025 & 2033
- Figure 31: North America Marine Coatings Industry Revenue (Million), by Technology 2025 & 2033
- Figure 32: North America Marine Coatings Industry Volume (liter ), by Technology 2025 & 2033
- Figure 33: North America Marine Coatings Industry Revenue Share (%), by Technology 2025 & 2033
- Figure 34: North America Marine Coatings Industry Volume Share (%), by Technology 2025 & 2033
- Figure 35: North America Marine Coatings Industry Revenue (Million), by Application 2025 & 2033
- Figure 36: North America Marine Coatings Industry Volume (liter ), by Application 2025 & 2033
- Figure 37: North America Marine Coatings Industry Revenue Share (%), by Application 2025 & 2033
- Figure 38: North America Marine Coatings Industry Volume Share (%), by Application 2025 & 2033
- Figure 39: North America Marine Coatings Industry Revenue (Million), by Country 2025 & 2033
- Figure 40: North America Marine Coatings Industry Volume (liter ), by Country 2025 & 2033
- Figure 41: North America Marine Coatings Industry Revenue Share (%), by Country 2025 & 2033
- Figure 42: North America Marine Coatings Industry Volume Share (%), by Country 2025 & 2033
- Figure 43: Europe Marine Coatings Industry Revenue (Million), by Type 2025 & 2033
- Figure 44: Europe Marine Coatings Industry Volume (liter ), by Type 2025 & 2033
- Figure 45: Europe Marine Coatings Industry Revenue Share (%), by Type 2025 & 2033
- Figure 46: Europe Marine Coatings Industry Volume Share (%), by Type 2025 & 2033
- Figure 47: Europe Marine Coatings Industry Revenue (Million), by Resin 2025 & 2033
- Figure 48: Europe Marine Coatings Industry Volume (liter ), by Resin 2025 & 2033
- Figure 49: Europe Marine Coatings Industry Revenue Share (%), by Resin 2025 & 2033
- Figure 50: Europe Marine Coatings Industry Volume Share (%), by Resin 2025 & 2033
- Figure 51: Europe Marine Coatings Industry Revenue (Million), by Technology 2025 & 2033
- Figure 52: Europe Marine Coatings Industry Volume (liter ), by Technology 2025 & 2033
- Figure 53: Europe Marine Coatings Industry Revenue Share (%), by Technology 2025 & 2033
- Figure 54: Europe Marine Coatings Industry Volume Share (%), by Technology 2025 & 2033
- Figure 55: Europe Marine Coatings Industry Revenue (Million), by Application 2025 & 2033
- Figure 56: Europe Marine Coatings Industry Volume (liter ), by Application 2025 & 2033
- Figure 57: Europe Marine Coatings Industry Revenue Share (%), by Application 2025 & 2033
- Figure 58: Europe Marine Coatings Industry Volume Share (%), by Application 2025 & 2033
- Figure 59: Europe Marine Coatings Industry Revenue (Million), by Country 2025 & 2033
- Figure 60: Europe Marine Coatings Industry Volume (liter ), by Country 2025 & 2033
- Figure 61: Europe Marine Coatings Industry Revenue Share (%), by Country 2025 & 2033
- Figure 62: Europe Marine Coatings Industry Volume Share (%), by Country 2025 & 2033
- Figure 63: South America Marine Coatings Industry Revenue (Million), by Type 2025 & 2033
- Figure 64: South America Marine Coatings Industry Volume (liter ), by Type 2025 & 2033
- Figure 65: South America Marine Coatings Industry Revenue Share (%), by Type 2025 & 2033
- Figure 66: South America Marine Coatings Industry Volume Share (%), by Type 2025 & 2033
- Figure 67: South America Marine Coatings Industry Revenue (Million), by Resin 2025 & 2033
- Figure 68: South America Marine Coatings Industry Volume (liter ), by Resin 2025 & 2033
- Figure 69: South America Marine Coatings Industry Revenue Share (%), by Resin 2025 & 2033
- Figure 70: South America Marine Coatings Industry Volume Share (%), by Resin 2025 & 2033
- Figure 71: South America Marine Coatings Industry Revenue (Million), by Technology 2025 & 2033
- Figure 72: South America Marine Coatings Industry Volume (liter ), by Technology 2025 & 2033
- Figure 73: South America Marine Coatings Industry Revenue Share (%), by Technology 2025 & 2033
- Figure 74: South America Marine Coatings Industry Volume Share (%), by Technology 2025 & 2033
- Figure 75: South America Marine Coatings Industry Revenue (Million), by Application 2025 & 2033
- Figure 76: South America Marine Coatings Industry Volume (liter ), by Application 2025 & 2033
- Figure 77: South America Marine Coatings Industry Revenue Share (%), by Application 2025 & 2033
- Figure 78: South America Marine Coatings Industry Volume Share (%), by Application 2025 & 2033
- Figure 79: South America Marine Coatings Industry Revenue (Million), by Country 2025 & 2033
- Figure 80: South America Marine Coatings Industry Volume (liter ), by Country 2025 & 2033
- Figure 81: South America Marine Coatings Industry Revenue Share (%), by Country 2025 & 2033
- Figure 82: South America Marine Coatings Industry Volume Share (%), by Country 2025 & 2033
- Figure 83: Middle East and Africa Marine Coatings Industry Revenue (Million), by Type 2025 & 2033
- Figure 84: Middle East and Africa Marine Coatings Industry Volume (liter ), by Type 2025 & 2033
- Figure 85: Middle East and Africa Marine Coatings Industry Revenue Share (%), by Type 2025 & 2033
- Figure 86: Middle East and Africa Marine Coatings Industry Volume Share (%), by Type 2025 & 2033
- Figure 87: Middle East and Africa Marine Coatings Industry Revenue (Million), by Resin 2025 & 2033
- Figure 88: Middle East and Africa Marine Coatings Industry Volume (liter ), by Resin 2025 & 2033
- Figure 89: Middle East and Africa Marine Coatings Industry Revenue Share (%), by Resin 2025 & 2033
- Figure 90: Middle East and Africa Marine Coatings Industry Volume Share (%), by Resin 2025 & 2033
- Figure 91: Middle East and Africa Marine Coatings Industry Revenue (Million), by Technology 2025 & 2033
- Figure 92: Middle East and Africa Marine Coatings Industry Volume (liter ), by Technology 2025 & 2033
- Figure 93: Middle East and Africa Marine Coatings Industry Revenue Share (%), by Technology 2025 & 2033
- Figure 94: Middle East and Africa Marine Coatings Industry Volume Share (%), by Technology 2025 & 2033
- Figure 95: Middle East and Africa Marine Coatings Industry Revenue (Million), by Application 2025 & 2033
- Figure 96: Middle East and Africa Marine Coatings Industry Volume (liter ), by Application 2025 & 2033
- Figure 97: Middle East and Africa Marine Coatings Industry Revenue Share (%), by Application 2025 & 2033
- Figure 98: Middle East and Africa Marine Coatings Industry Volume Share (%), by Application 2025 & 2033
- Figure 99: Middle East and Africa Marine Coatings Industry Revenue (Million), by Country 2025 & 2033
- Figure 100: Middle East and Africa Marine Coatings Industry Volume (liter ), by Country 2025 & 2033
- Figure 101: Middle East and Africa Marine Coatings Industry Revenue Share (%), by Country 2025 & 2033
- Figure 102: Middle East and Africa Marine Coatings Industry Volume Share (%), by Country 2025 & 2033
List of Tables
- Table 1: Global Marine Coatings Industry Revenue Million Forecast, by Type 2020 & 2033
- Table 2: Global Marine Coatings Industry Volume liter Forecast, by Type 2020 & 2033
- Table 3: Global Marine Coatings Industry Revenue Million Forecast, by Resin 2020 & 2033
- Table 4: Global Marine Coatings Industry Volume liter Forecast, by Resin 2020 & 2033
- Table 5: Global Marine Coatings Industry Revenue Million Forecast, by Technology 2020 & 2033
- Table 6: Global Marine Coatings Industry Volume liter Forecast, by Technology 2020 & 2033
- Table 7: Global Marine Coatings Industry Revenue Million Forecast, by Application 2020 & 2033
- Table 8: Global Marine Coatings Industry Volume liter Forecast, by Application 2020 & 2033
- Table 9: Global Marine Coatings Industry Revenue Million Forecast, by Region 2020 & 2033
- Table 10: Global Marine Coatings Industry Volume liter Forecast, by Region 2020 & 2033
- Table 11: Global Marine Coatings Industry Revenue Million Forecast, by Type 2020 & 2033
- Table 12: Global Marine Coatings Industry Volume liter Forecast, by Type 2020 & 2033
- Table 13: Global Marine Coatings Industry Revenue Million Forecast, by Resin 2020 & 2033
- Table 14: Global Marine Coatings Industry Volume liter Forecast, by Resin 2020 & 2033
- Table 15: Global Marine Coatings Industry Revenue Million Forecast, by Technology 2020 & 2033
- Table 16: Global Marine Coatings Industry Volume liter Forecast, by Technology 2020 & 2033
- Table 17: Global Marine Coatings Industry Revenue Million Forecast, by Application 2020 & 2033
- Table 18: Global Marine Coatings Industry Volume liter Forecast, by Application 2020 & 2033
- Table 19: Global Marine Coatings Industry Revenue Million Forecast, by Country 2020 & 2033
- Table 20: Global Marine Coatings Industry Volume liter Forecast, by Country 2020 & 2033
- Table 21: China Marine Coatings Industry Revenue (Million) Forecast, by Application 2020 & 2033
- Table 22: China Marine Coatings Industry Volume (liter ) Forecast, by Application 2020 & 2033
- Table 23: India Marine Coatings Industry Revenue (Million) Forecast, by Application 2020 & 2033
- Table 24: India Marine Coatings Industry Volume (liter ) Forecast, by Application 2020 & 2033
- Table 25: Japan Marine Coatings Industry Revenue (Million) Forecast, by Application 2020 & 2033
- Table 26: Japan Marine Coatings Industry Volume (liter ) Forecast, by Application 2020 & 2033
- Table 27: South Korea Marine Coatings Industry Revenue (Million) Forecast, by Application 2020 & 2033
- Table 28: South Korea Marine Coatings Industry Volume (liter ) Forecast, by Application 2020 & 2033
- Table 29: Malaysia Marine Coatings Industry Revenue (Million) Forecast, by Application 2020 & 2033
- Table 30: Malaysia Marine Coatings Industry Volume (liter ) Forecast, by Application 2020 & 2033
- Table 31: Vietnam Marine Coatings Industry Revenue (Million) Forecast, by Application 2020 & 2033
- Table 32: Vietnam Marine Coatings Industry Volume (liter ) Forecast, by Application 2020 & 2033
- Table 33: Rest of Asia Pacific Marine Coatings Industry Revenue (Million) Forecast, by Application 2020 & 2033
- Table 34: Rest of Asia Pacific Marine Coatings Industry Volume (liter ) Forecast, by Application 2020 & 2033
- Table 35: Global Marine Coatings Industry Revenue Million Forecast, by Type 2020 & 2033
- Table 36: Global Marine Coatings Industry Volume liter Forecast, by Type 2020 & 2033
- Table 37: Global Marine Coatings Industry Revenue Million Forecast, by Resin 2020 & 2033
- Table 38: Global Marine Coatings Industry Volume liter Forecast, by Resin 2020 & 2033
- Table 39: Global Marine Coatings Industry Revenue Million Forecast, by Technology 2020 & 2033
- Table 40: Global Marine Coatings Industry Volume liter Forecast, by Technology 2020 & 2033
- Table 41: Global Marine Coatings Industry Revenue Million Forecast, by Application 2020 & 2033
- Table 42: Global Marine Coatings Industry Volume liter Forecast, by Application 2020 & 2033
- Table 43: Global Marine Coatings Industry Revenue Million Forecast, by Country 2020 & 2033
- Table 44: Global Marine Coatings Industry Volume liter Forecast, by Country 2020 & 2033
- Table 45: United States Marine Coatings Industry Revenue (Million) Forecast, by Application 2020 & 2033
- Table 46: United States Marine Coatings Industry Volume (liter ) Forecast, by Application 2020 & 2033
- Table 47: Canada Marine Coatings Industry Revenue (Million) Forecast, by Application 2020 & 2033
- Table 48: Canada Marine Coatings Industry Volume (liter ) Forecast, by Application 2020 & 2033
- Table 49: Mexico Marine Coatings Industry Revenue (Million) Forecast, by Application 2020 & 2033
- Table 50: Mexico Marine Coatings Industry Volume (liter ) Forecast, by Application 2020 & 2033
- Table 51: Global Marine Coatings Industry Revenue Million Forecast, by Type 2020 & 2033
- Table 52: Global Marine Coatings Industry Volume liter Forecast, by Type 2020 & 2033
- Table 53: Global Marine Coatings Industry Revenue Million Forecast, by Resin 2020 & 2033
- Table 54: Global Marine Coatings Industry Volume liter Forecast, by Resin 2020 & 2033
- Table 55: Global Marine Coatings Industry Revenue Million Forecast, by Technology 2020 & 2033
- Table 56: Global Marine Coatings Industry Volume liter Forecast, by Technology 2020 & 2033
- Table 57: Global Marine Coatings Industry Revenue Million Forecast, by Application 2020 & 2033
- Table 58: Global Marine Coatings Industry Volume liter Forecast, by Application 2020 & 2033
- Table 59: Global Marine Coatings Industry Revenue Million Forecast, by Country 2020 & 2033
- Table 60: Global Marine Coatings Industry Volume liter Forecast, by Country 2020 & 2033
- Table 61: Germany Marine Coatings Industry Revenue (Million) Forecast, by Application 2020 & 2033
- Table 62: Germany Marine Coatings Industry Volume (liter ) Forecast, by Application 2020 & 2033
- Table 63: United Kingdom Marine Coatings Industry Revenue (Million) Forecast, by Application 2020 & 2033
- Table 64: United Kingdom Marine Coatings Industry Volume (liter ) Forecast, by Application 2020 & 2033
- Table 65: Italy Marine Coatings Industry Revenue (Million) Forecast, by Application 2020 & 2033
- Table 66: Italy Marine Coatings Industry Volume (liter ) Forecast, by Application 2020 & 2033
- Table 67: France Marine Coatings Industry Revenue (Million) Forecast, by Application 2020 & 2033
- Table 68: France Marine Coatings Industry Volume (liter ) Forecast, by Application 2020 & 2033
- Table 69: Rest of Europe Marine Coatings Industry Revenue (Million) Forecast, by Application 2020 & 2033
- Table 70: Rest of Europe Marine Coatings Industry Volume (liter ) Forecast, by Application 2020 & 2033
- Table 71: Global Marine Coatings Industry Revenue Million Forecast, by Type 2020 & 2033
- Table 72: Global Marine Coatings Industry Volume liter Forecast, by Type 2020 & 2033
- Table 73: Global Marine Coatings Industry Revenue Million Forecast, by Resin 2020 & 2033
- Table 74: Global Marine Coatings Industry Volume liter Forecast, by Resin 2020 & 2033
- Table 75: Global Marine Coatings Industry Revenue Million Forecast, by Technology 2020 & 2033
- Table 76: Global Marine Coatings Industry Volume liter Forecast, by Technology 2020 & 2033
- Table 77: Global Marine Coatings Industry Revenue Million Forecast, by Application 2020 & 2033
- Table 78: Global Marine Coatings Industry Volume liter Forecast, by Application 2020 & 2033
- Table 79: Global Marine Coatings Industry Revenue Million Forecast, by Country 2020 & 2033
- Table 80: Global Marine Coatings Industry Volume liter Forecast, by Country 2020 & 2033
- Table 81: Brazil Marine Coatings Industry Revenue (Million) Forecast, by Application 2020 & 2033
- Table 82: Brazil Marine Coatings Industry Volume (liter ) Forecast, by Application 2020 & 2033
- Table 83: Argentina Marine Coatings Industry Revenue (Million) Forecast, by Application 2020 & 2033
- Table 84: Argentina Marine Coatings Industry Volume (liter ) Forecast, by Application 2020 & 2033
- Table 85: Rest of South America Marine Coatings Industry Revenue (Million) Forecast, by Application 2020 & 2033
- Table 86: Rest of South America Marine Coatings Industry Volume (liter ) Forecast, by Application 2020 & 2033
- Table 87: Global Marine Coatings Industry Revenue Million Forecast, by Type 2020 & 2033
- Table 88: Global Marine Coatings Industry Volume liter Forecast, by Type 2020 & 2033
- Table 89: Global Marine Coatings Industry Revenue Million Forecast, by Resin 2020 & 2033
- Table 90: Global Marine Coatings Industry Volume liter Forecast, by Resin 2020 & 2033
- Table 91: Global Marine Coatings Industry Revenue Million Forecast, by Technology 2020 & 2033
- Table 92: Global Marine Coatings Industry Volume liter Forecast, by Technology 2020 & 2033
- Table 93: Global Marine Coatings Industry Revenue Million Forecast, by Application 2020 & 2033
- Table 94: Global Marine Coatings Industry Volume liter Forecast, by Application 2020 & 2033
- Table 95: Global Marine Coatings Industry Revenue Million Forecast, by Country 2020 & 2033
- Table 96: Global Marine Coatings Industry Volume liter Forecast, by Country 2020 & 2033
- Table 97: Saudi Arabia Marine Coatings Industry Revenue (Million) Forecast, by Application 2020 & 2033
- Table 98: Saudi Arabia Marine Coatings Industry Volume (liter ) Forecast, by Application 2020 & 2033
- Table 99: South Africa Marine Coatings Industry Revenue (Million) Forecast, by Application 2020 & 2033
- Table 100: South Africa Marine Coatings Industry Volume (liter ) Forecast, by Application 2020 & 2033
- Table 101: Rest of Middle East and Africa Marine Coatings Industry Revenue (Million) Forecast, by Application 2020 & 2033
- Table 102: Rest of Middle East and Africa Marine Coatings Industry Volume (liter ) Forecast, by Application 2020 & 2033
Frequently Asked Questions
1. What is the projected Compound Annual Growth Rate (CAGR) of the Marine Coatings Industry?
The projected CAGR is approximately > 4.50%.
2. Which companies are prominent players in the Marine Coatings Industry?
Key companies in the market include Engineered Marine Coatings LLC, The Sherwin-Williams Company*List Not Exhaustive, AkzoNobel N V, Chugoku Marine Paints Ltd, KCC CORPORATION, Jotun, RPM International Inc, Kansai Paint Marine Co Ltd, Pettit Marine Paints, PPG Industries Inc, BOERO BARTOLOMEO S p A, Nippon Paint Marine Coatings Co Ltd, BASF SE, Axalta Coating Systems, Hempel A/S, MCU COATING INTERNATIONAL.
3. What are the main segments of the Marine Coatings Industry?
The market segments include Type, Resin, Technology, Application.
4. Can you provide details about the market size?
The market size is estimated to be USD 3.77 Million as of 2022.
5. What are some drivers contributing to market growth?
Increase in Production of Leisure Boats and Cruise Ships; Growing Ship Repairs and Maintenance Activities.
6. What are the notable trends driving market growth?
Marine OEM Application Segment to Dominate The Market.
7. Are there any restraints impacting market growth?
Stringent Government Regulations; Sluggish Growth in Shipbuilding Activities in Few Countries.
8. Can you provide examples of recent developments in the market?
March 2023: PPG launched the PPG SIGMAGLIDE 2390 marine coating to help shipowners lower power consumption and carbon emissions and meet demands for higher performance without adversely impacting the marine environment.
9. What pricing options are available for accessing the report?
Pricing options include single-user, multi-user, and enterprise licenses priced at USD 4750, USD 5250, and USD 8750 respectively.
10. Is the market size provided in terms of value or volume?
The market size is provided in terms of value, measured in Million and volume, measured in liter .
11. Are there any specific market keywords associated with the report?
Yes, the market keyword associated with the report is "Marine Coatings Industry," which aids in identifying and referencing the specific market segment covered.
12. How do I determine which pricing option suits my needs best?
The pricing options vary based on user requirements and access needs. Individual users may opt for single-user licenses, while businesses requiring broader access may choose multi-user or enterprise licenses for cost-effective access to the report.
13. Are there any additional resources or data provided in the Marine Coatings Industry report?
While the report offers comprehensive insights, it's advisable to review the specific contents or supplementary materials provided to ascertain if additional resources or data are available.
14. How can I stay updated on further developments or reports in the Marine Coatings Industry?
To stay informed about further developments, trends, and reports in the Marine Coatings Industry, consider subscribing to industry newsletters, following relevant companies and organizations, or regularly checking reputable industry news sources and publications.
Methodology
Step 1 - Identification of Relevant Samples Size from Population Database


Step 2 - Approaches for Defining Global Market Size (Value, Volume* & Price*)

Note*: In applicable scenarios
Step 3 - Data Sources
Primary Research
- Web Analytics
- Survey Reports
- Research Institute
- Latest Research Reports
- Opinion Leaders
Secondary Research
- Annual Reports
- White Paper
- Latest Press Release
- Industry Association
- Paid Database
- Investor Presentations

Step 4 - Data Triangulation
Involves using different sources of information in order to increase the validity of a study
These sources are likely to be stakeholders in a program - participants, other researchers, program staff, other community members, and so on.
Then we put all data in single framework & apply various statistical tools to find out the dynamic on the market.
During the analysis stage, feedback from the stakeholder groups would be compared to determine areas of agreement as well as areas of divergence