

Key Insights
The global lubricants market is experiencing robust growth, driven by the increasing demand from automotive, industrial, and marine sectors. The market's expansion is fueled by several key factors, including the rising number of vehicles globally, the growth of industrial manufacturing and construction activities, and the increasing adoption of advanced lubricant technologies offering enhanced performance and fuel efficiency. Significant advancements in lubricant formulations, such as the development of bio-based and synthetic lubricants, are also contributing to market expansion. These newer lubricants provide superior performance, extended drain intervals, and improved environmental friendliness, appealing to environmentally conscious consumers and businesses. Furthermore, stringent government regulations regarding emission standards are pushing the adoption of advanced lubricants designed to meet these requirements, creating additional market opportunities. While pricing fluctuations in crude oil and raw materials pose a challenge, the long-term outlook for the lubricants market remains positive, supported by sustained economic growth in emerging markets and ongoing technological advancements.

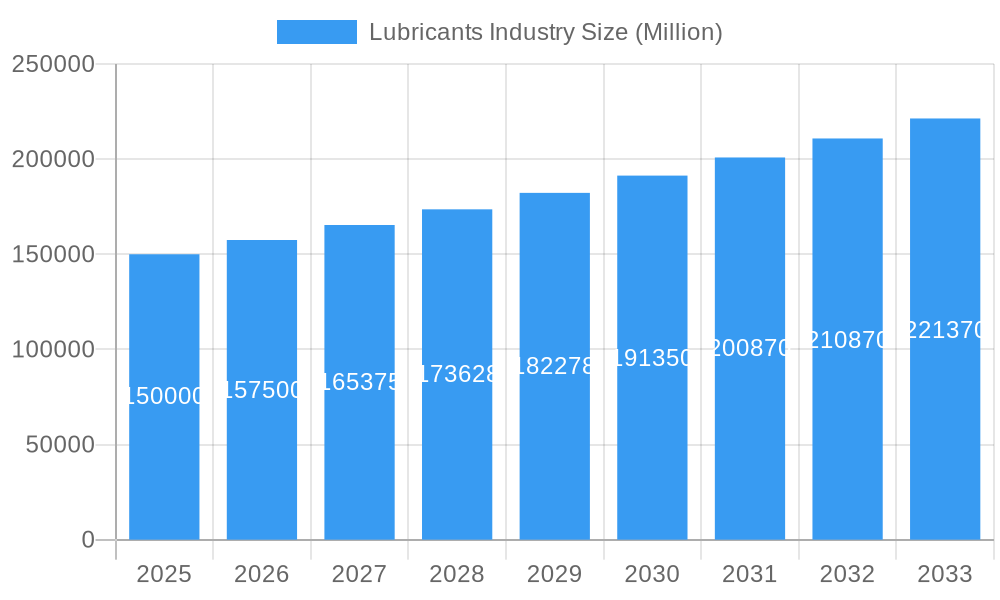
Lubricants Industry Market Size (In Billion)
Competition in the lubricants market is fierce, with established players like ExxonMobil, Shell, and BP dominating the global landscape alongside regional and specialized companies. These companies are focusing on strategic partnerships, mergers and acquisitions, and product diversification to strengthen their market position. The market is also witnessing increasing consolidation, as larger players acquire smaller companies to expand their product portfolios and geographic reach. Innovation is paramount; companies are investing heavily in research and development to create high-performance lubricants tailored to specific application needs, including specialized formulations for electric vehicles and renewable energy technologies. Future growth will depend on adapting to evolving consumer preferences, leveraging digital technologies for improved supply chain management, and strategically navigating the shifting regulatory landscape. The predicted CAGR, while not explicitly stated, suggests a healthy and consistent growth trajectory for the forecast period (2025-2033), indicating continued market expansion driven by global industrial growth and technological advances.
Lubricants Industry Company Market Share
Lubricants Industry Market Report: 2019-2033
This comprehensive report provides an in-depth analysis of the global lubricants industry, encompassing market dynamics, leading players, key trends, and future growth prospects. With a study period spanning 2019-2033, a base year of 2025, and a forecast period of 2025-2033, this report is an essential resource for industry stakeholders, investors, and strategic decision-makers. The report leverages extensive data analysis to provide actionable insights and projections, helping you navigate the complexities of this dynamic market. Estimated market values are in Millions.
Lubricants Industry Market Dynamics & Concentration
The global lubricants market exhibits a moderately concentrated structure, with several multinational corporations holding significant market share. Market concentration is influenced by factors such as economies of scale, technological advancements, and access to raw materials. The industry is characterized by intense competition, with companies engaging in strategic initiatives such as mergers and acquisitions (M&A), product innovation, and expansion into new markets to maintain their competitive edge.
- Market Share: ExxonMobil, Shell, and Chevron collectively hold an estimated xx% market share, while other major players, including TotalEnergies, BP, and FUCHS, also possess substantial shares. Smaller regional players cater to niche segments and regional markets.
- M&A Activity: The number of M&A deals in the lubricants industry has averaged xx per year during the historical period (2019-2024), driven by consolidation efforts and efforts to secure new technologies or market access.
- Innovation Drivers: Stringent emission regulations, the growing demand for energy-efficient lubricants, and the increasing adoption of advanced technologies are key drivers of innovation within the industry.
- Regulatory Frameworks: Government regulations concerning environmental protection, product safety, and worker health have a significant impact on industry operations and product development. Compliance costs and evolving regulations represent continuous challenges.
- Product Substitutes: The availability of alternative technologies and materials, such as biodegradable lubricants and synthetic fluids, poses a competitive threat to traditional petroleum-based lubricants.
- End-User Trends: The increasing demand from automotive, industrial, and agricultural sectors is driving the growth of the lubricants market. A shift towards higher-performance and specialized lubricants is also observed.
Lubricants Industry Industry Trends & Analysis
The global lubricants market is experiencing robust growth, driven by a confluence of factors. The compound annual growth rate (CAGR) is projected to be xx% during the forecast period (2025-2033). Key trends shaping the market include:
- Rising Global Demand: The expanding automotive and industrial sectors in developing economies fuel substantial demand growth. Market penetration in these regions remains significant growth opportunity.
- Technological Disruptions: The emergence of bio-based and synthetic lubricants is disrupting traditional market dynamics. Technological advancements in lubricant formulations enhance performance and reduce environmental impact.
- Consumer Preferences: Growing awareness of environmental issues and sustainability concerns are shifting consumer preferences towards eco-friendly lubricants. Demand for high-performance and energy-efficient products is also increasing.
- Competitive Dynamics: The industry is characterized by intense competition, with companies continuously innovating to secure a competitive edge. Pricing strategies, brand loyalty, and distribution networks heavily influence market dynamics.
Leading Markets & Segments in Lubricants Industry
The Asia-Pacific region is currently the dominant market for lubricants, driven by rapid industrialization, urbanization, and automotive growth in countries like China and India.
Key Drivers in Asia-Pacific:
- Rapid economic growth and infrastructure development.
- Increasing automotive sales and industrial activity.
- Favorable government policies and investments in the manufacturing sector.
Dominance Analysis: The dominance of the Asia-Pacific region stems from its substantial automotive and industrial sectors, a large and growing population, and continuous investment in infrastructure projects. While other regions, such as North America and Europe, also contribute significantly, Asia-Pacific's growth trajectory is expected to maintain its leading position. The specific market share of this region is predicted to be xx% in 2025.
Lubricants Industry Product Developments
Recent product innovations in the lubricants industry include the development of high-performance synthetic lubricants, bio-based lubricants, and specialized formulations for specific applications. These innovations focus on improving energy efficiency, reducing emissions, and enhancing equipment longevity. The market is witnessing a shift towards environmentally friendly products and formulations that cater to specific industry needs such as food-grade lubricants and those tailored to the demanding conditions of agricultural machinery and sugar processing plants. These advancements reflect a broader industry trend towards sustainability and performance enhancement.
Key Drivers of Lubricants Industry Growth
Several factors contribute to the projected growth of the lubricants industry:
- Technological advancements: The development of improved lubricant formulations, such as synthetic oils and bio-based lubricants, is boosting market growth.
- Economic growth: Global economic expansion, particularly in developing countries, leads to higher industrial output and vehicle sales, increasing demand for lubricants.
- Stringent emission regulations: Governments worldwide are imposing stricter regulations on vehicle and industrial emissions. This drives the need for eco-friendly lubricants that meet these standards.
Challenges in the Lubricants Industry Market
The lubricants industry faces several challenges:
- Fluctuating Crude Oil Prices: Volatility in crude oil prices significantly impacts raw material costs, affecting profitability and pricing strategies.
- Environmental Regulations: Compliance with increasingly stringent environmental regulations requires investments in research and development, increasing operational costs.
- Intense Competition: The market is highly competitive, with numerous players vying for market share, leading to price pressures and reduced profit margins.
Emerging Opportunities in Lubricants Industry
The lubricants market presents significant opportunities:
- Bio-based lubricants: The growing demand for sustainable and eco-friendly products creates a strong market for bio-based lubricants. Continued research and development in this area will unlock new opportunities.
- Strategic partnerships: Collaborations between lubricant manufacturers and equipment manufacturers can foster innovation and create new market segments. These partnerships can lead to development of tailored and high-performance products.
- Expansion into new markets: Emerging economies in Asia, Africa, and Latin America offer significant growth potential for lubricant manufacturers.
Leading Players in the Lubricants Industry Sector
- Behran Oil Company
- BP PLC (Castrol)
- Carl Bechem GmbH
- Chevron Corporation
- China National Petroleum Corporation
- China Petroleum & Chemical Corporation
- Coperative Soceite des petroleum
- ENEOS Corporation
- Eni SpA
- ExxonMobil Corporation
- FUCHS
- Gazprom
- GS Caltex
- Gulf Oil International
- Hindustan Petroleum Corporation Limited
- Idemitsu Kosan Co Ltd
- Indian Oil Corporation Limited
- Lukoil
- Motul
- Petromin Corporation
- Petronas Lubricants International
- Phillips 66 Lubricants
- PT Pertamina
- PTT Lubricants
- Rosneft
- Royal Dutch Shell PLC
- Terpel
- TotalEnergies
- Valvoline Inc
- YP
Key Milestones in Lubricants Industry Industry
- May 2022: TotalEnergies and NEXUS Automotive extend their strategic partnership for five years, expanding TotalEnergies' presence in the N! community (sales growth from EUR 7.2 billion in 2015 to nearly EUR 35 billion by the end of 2021). This significantly boosts TotalEnergies' market position and access to a rapidly growing distribution network.
- April 2022: FUCHS introduces AGRI FARM lubricants, specifically designed for high-end agricultural machinery. This product launch targets a niche but lucrative segment, highlighting innovation and market diversification.
- April 2022: FUCHS Lubricants South Africa launches food-grade Renolin SJL Heavy and Renolin SJL Winter lubricants for the sugar processing industry. This expands FUCHS' presence in specialized industrial segments, emphasizing product innovation and market penetration.
Strategic Outlook for Lubricants Industry Market
The lubricants industry is poised for continued growth, driven by technological innovation, expanding industrialization, and stringent environmental regulations. Opportunities exist in developing sustainable and high-performance lubricants to meet evolving market demands. Strategic partnerships and market expansion into emerging economies will play a crucial role in shaping future market dynamics. Companies that invest in research and development, adopt sustainable practices, and build strong distribution networks are likely to benefit most from the industry's projected growth.
Lubricants Industry Segmentation
-
1. End User
- 1.1. Automotive
- 1.2. Heavy Equipment
- 1.3. Metallurgy & Metalworking
- 1.4. Power Generation
- 1.5. Other End-user Industries
-
2. Product Type
- 2.1. Engine Oils
- 2.2. Greases
- 2.3. Hydraulic Fluids
- 2.4. Metalworking Fluids
- 2.5. Transmission & Gear Oils
- 2.6. Other Product Types
Lubricants Industry Segmentation By Geography
-
1. North America
- 1.1. United States
- 1.2. Canada
- 1.3. Mexico
-
2. South America
- 2.1. Brazil
- 2.2. Argentina
- 2.3. Rest of South America
-
3. Europe
- 3.1. United Kingdom
- 3.2. Germany
- 3.3. France
- 3.4. Italy
- 3.5. Spain
- 3.6. Russia
- 3.7. Benelux
- 3.8. Nordics
- 3.9. Rest of Europe
-
4. Middle East & Africa
- 4.1. Turkey
- 4.2. Israel
- 4.3. GCC
- 4.4. North Africa
- 4.5. South Africa
- 4.6. Rest of Middle East & Africa
-
5. Asia Pacific
- 5.1. China
- 5.2. India
- 5.3. Japan
- 5.4. South Korea
- 5.5. ASEAN
- 5.6. Oceania
- 5.7. Rest of Asia Pacific

Lubricants Industry Regional Market Share
Geographic Coverage of Lubricants Industry
Lubricants Industry REPORT HIGHLIGHTS
| Aspects | Details |
|---|---|
| Study Period | 2020-2034 |
| Base Year | 2025 |
| Estimated Year | 2026 |
| Forecast Period | 2026-2034 |
| Historical Period | 2020-2025 |
| Growth Rate | CAGR of 2% from 2020-2034 |
| Segmentation |
|
Table of Contents
- 1. Introduction
- 1.1. Research Scope
- 1.2. Market Segmentation
- 1.3. Research Methodology
- 1.4. Definitions and Assumptions
- 2. Executive Summary
- 2.1. Introduction
- 3. Market Dynamics
- 3.1. Introduction
- 3.2. Market Drivers
- 3.3. Market Restrains
- 3.4. Market Trends
- 3.4.1. Largest Segment By End User
- 4. Market Factor Analysis
- 4.1. Porters Five Forces
- 4.2. Supply/Value Chain
- 4.3. PESTEL analysis
- 4.4. Market Entropy
- 4.5. Patent/Trademark Analysis
- 5. Global Lubricants Industry Analysis, Insights and Forecast, 2020-2032
- 5.1. Market Analysis, Insights and Forecast - by End User
- 5.1.1. Automotive
- 5.1.2. Heavy Equipment
- 5.1.3. Metallurgy & Metalworking
- 5.1.4. Power Generation
- 5.1.5. Other End-user Industries
- 5.2. Market Analysis, Insights and Forecast - by Product Type
- 5.2.1. Engine Oils
- 5.2.2. Greases
- 5.2.3. Hydraulic Fluids
- 5.2.4. Metalworking Fluids
- 5.2.5. Transmission & Gear Oils
- 5.2.6. Other Product Types
- 5.3. Market Analysis, Insights and Forecast - by Region
- 5.3.1. North America
- 5.3.2. South America
- 5.3.3. Europe
- 5.3.4. Middle East & Africa
- 5.3.5. Asia Pacific
- 5.1. Market Analysis, Insights and Forecast - by End User
- 6. North America Lubricants Industry Analysis, Insights and Forecast, 2020-2032
- 6.1. Market Analysis, Insights and Forecast - by End User
- 6.1.1. Automotive
- 6.1.2. Heavy Equipment
- 6.1.3. Metallurgy & Metalworking
- 6.1.4. Power Generation
- 6.1.5. Other End-user Industries
- 6.2. Market Analysis, Insights and Forecast - by Product Type
- 6.2.1. Engine Oils
- 6.2.2. Greases
- 6.2.3. Hydraulic Fluids
- 6.2.4. Metalworking Fluids
- 6.2.5. Transmission & Gear Oils
- 6.2.6. Other Product Types
- 6.1. Market Analysis, Insights and Forecast - by End User
- 7. South America Lubricants Industry Analysis, Insights and Forecast, 2020-2032
- 7.1. Market Analysis, Insights and Forecast - by End User
- 7.1.1. Automotive
- 7.1.2. Heavy Equipment
- 7.1.3. Metallurgy & Metalworking
- 7.1.4. Power Generation
- 7.1.5. Other End-user Industries
- 7.2. Market Analysis, Insights and Forecast - by Product Type
- 7.2.1. Engine Oils
- 7.2.2. Greases
- 7.2.3. Hydraulic Fluids
- 7.2.4. Metalworking Fluids
- 7.2.5. Transmission & Gear Oils
- 7.2.6. Other Product Types
- 7.1. Market Analysis, Insights and Forecast - by End User
- 8. Europe Lubricants Industry Analysis, Insights and Forecast, 2020-2032
- 8.1. Market Analysis, Insights and Forecast - by End User
- 8.1.1. Automotive
- 8.1.2. Heavy Equipment
- 8.1.3. Metallurgy & Metalworking
- 8.1.4. Power Generation
- 8.1.5. Other End-user Industries
- 8.2. Market Analysis, Insights and Forecast - by Product Type
- 8.2.1. Engine Oils
- 8.2.2. Greases
- 8.2.3. Hydraulic Fluids
- 8.2.4. Metalworking Fluids
- 8.2.5. Transmission & Gear Oils
- 8.2.6. Other Product Types
- 8.1. Market Analysis, Insights and Forecast - by End User
- 9. Middle East & Africa Lubricants Industry Analysis, Insights and Forecast, 2020-2032
- 9.1. Market Analysis, Insights and Forecast - by End User
- 9.1.1. Automotive
- 9.1.2. Heavy Equipment
- 9.1.3. Metallurgy & Metalworking
- 9.1.4. Power Generation
- 9.1.5. Other End-user Industries
- 9.2. Market Analysis, Insights and Forecast - by Product Type
- 9.2.1. Engine Oils
- 9.2.2. Greases
- 9.2.3. Hydraulic Fluids
- 9.2.4. Metalworking Fluids
- 9.2.5. Transmission & Gear Oils
- 9.2.6. Other Product Types
- 9.1. Market Analysis, Insights and Forecast - by End User
- 10. Asia Pacific Lubricants Industry Analysis, Insights and Forecast, 2020-2032
- 10.1. Market Analysis, Insights and Forecast - by End User
- 10.1.1. Automotive
- 10.1.2. Heavy Equipment
- 10.1.3. Metallurgy & Metalworking
- 10.1.4. Power Generation
- 10.1.5. Other End-user Industries
- 10.2. Market Analysis, Insights and Forecast - by Product Type
- 10.2.1. Engine Oils
- 10.2.2. Greases
- 10.2.3. Hydraulic Fluids
- 10.2.4. Metalworking Fluids
- 10.2.5. Transmission & Gear Oils
- 10.2.6. Other Product Types
- 10.1. Market Analysis, Insights and Forecast - by End User
- 11. Competitive Analysis
- 11.1. Global Market Share Analysis 2025
- 11.2. Company Profiles
- 11.2.1 Behran Oil Company
- 11.2.1.1. Overview
- 11.2.1.2. Products
- 11.2.1.3. SWOT Analysis
- 11.2.1.4. Recent Developments
- 11.2.1.5. Financials (Based on Availability)
- 11.2.2 BP PLC (Castrol)
- 11.2.2.1. Overview
- 11.2.2.2. Products
- 11.2.2.3. SWOT Analysis
- 11.2.2.4. Recent Developments
- 11.2.2.5. Financials (Based on Availability)
- 11.2.3 Carl Bechem GmbH
- 11.2.3.1. Overview
- 11.2.3.2. Products
- 11.2.3.3. SWOT Analysis
- 11.2.3.4. Recent Developments
- 11.2.3.5. Financials (Based on Availability)
- 11.2.4 Chevron Corporation
- 11.2.4.1. Overview
- 11.2.4.2. Products
- 11.2.4.3. SWOT Analysis
- 11.2.4.4. Recent Developments
- 11.2.4.5. Financials (Based on Availability)
- 11.2.5 China National Petroleum Corporation
- 11.2.5.1. Overview
- 11.2.5.2. Products
- 11.2.5.3. SWOT Analysis
- 11.2.5.4. Recent Developments
- 11.2.5.5. Financials (Based on Availability)
- 11.2.6 China Petroleum & Chemical Corporation
- 11.2.6.1. Overview
- 11.2.6.2. Products
- 11.2.6.3. SWOT Analysis
- 11.2.6.4. Recent Developments
- 11.2.6.5. Financials (Based on Availability)
- 11.2.7 Coperative Soceite des petroleum
- 11.2.7.1. Overview
- 11.2.7.2. Products
- 11.2.7.3. SWOT Analysis
- 11.2.7.4. Recent Developments
- 11.2.7.5. Financials (Based on Availability)
- 11.2.8 ENEOS Corporation
- 11.2.8.1. Overview
- 11.2.8.2. Products
- 11.2.8.3. SWOT Analysis
- 11.2.8.4. Recent Developments
- 11.2.8.5. Financials (Based on Availability)
- 11.2.9 Eni SpA
- 11.2.9.1. Overview
- 11.2.9.2. Products
- 11.2.9.3. SWOT Analysis
- 11.2.9.4. Recent Developments
- 11.2.9.5. Financials (Based on Availability)
- 11.2.10 ExxonMobil Corporation
- 11.2.10.1. Overview
- 11.2.10.2. Products
- 11.2.10.3. SWOT Analysis
- 11.2.10.4. Recent Developments
- 11.2.10.5. Financials (Based on Availability)
- 11.2.11 FUCHS
- 11.2.11.1. Overview
- 11.2.11.2. Products
- 11.2.11.3. SWOT Analysis
- 11.2.11.4. Recent Developments
- 11.2.11.5. Financials (Based on Availability)
- 11.2.12 Gazprom
- 11.2.12.1. Overview
- 11.2.12.2. Products
- 11.2.12.3. SWOT Analysis
- 11.2.12.4. Recent Developments
- 11.2.12.5. Financials (Based on Availability)
- 11.2.13 GS Caltex
- 11.2.13.1. Overview
- 11.2.13.2. Products
- 11.2.13.3. SWOT Analysis
- 11.2.13.4. Recent Developments
- 11.2.13.5. Financials (Based on Availability)
- 11.2.14 Gulf Oil International
- 11.2.14.1. Overview
- 11.2.14.2. Products
- 11.2.14.3. SWOT Analysis
- 11.2.14.4. Recent Developments
- 11.2.14.5. Financials (Based on Availability)
- 11.2.15 Hindustan Petroleum Corporation Limited
- 11.2.15.1. Overview
- 11.2.15.2. Products
- 11.2.15.3. SWOT Analysis
- 11.2.15.4. Recent Developments
- 11.2.15.5. Financials (Based on Availability)
- 11.2.16 Idemitsu Kosan Co Ltd
- 11.2.16.1. Overview
- 11.2.16.2. Products
- 11.2.16.3. SWOT Analysis
- 11.2.16.4. Recent Developments
- 11.2.16.5. Financials (Based on Availability)
- 11.2.17 Indian Oil Corporation Limited
- 11.2.17.1. Overview
- 11.2.17.2. Products
- 11.2.17.3. SWOT Analysis
- 11.2.17.4. Recent Developments
- 11.2.17.5. Financials (Based on Availability)
- 11.2.18 Lukoil
- 11.2.18.1. Overview
- 11.2.18.2. Products
- 11.2.18.3. SWOT Analysis
- 11.2.18.4. Recent Developments
- 11.2.18.5. Financials (Based on Availability)
- 11.2.19 Motul
- 11.2.19.1. Overview
- 11.2.19.2. Products
- 11.2.19.3. SWOT Analysis
- 11.2.19.4. Recent Developments
- 11.2.19.5. Financials (Based on Availability)
- 11.2.20 Petromin Corporation
- 11.2.20.1. Overview
- 11.2.20.2. Products
- 11.2.20.3. SWOT Analysis
- 11.2.20.4. Recent Developments
- 11.2.20.5. Financials (Based on Availability)
- 11.2.21 Petronas Lubricants International
- 11.2.21.1. Overview
- 11.2.21.2. Products
- 11.2.21.3. SWOT Analysis
- 11.2.21.4. Recent Developments
- 11.2.21.5. Financials (Based on Availability)
- 11.2.22 Phillips 66 Lubricants
- 11.2.22.1. Overview
- 11.2.22.2. Products
- 11.2.22.3. SWOT Analysis
- 11.2.22.4. Recent Developments
- 11.2.22.5. Financials (Based on Availability)
- 11.2.23 PT Pertamina
- 11.2.23.1. Overview
- 11.2.23.2. Products
- 11.2.23.3. SWOT Analysis
- 11.2.23.4. Recent Developments
- 11.2.23.5. Financials (Based on Availability)
- 11.2.24 PTT Lubricants
- 11.2.24.1. Overview
- 11.2.24.2. Products
- 11.2.24.3. SWOT Analysis
- 11.2.24.4. Recent Developments
- 11.2.24.5. Financials (Based on Availability)
- 11.2.25 Rosneft
- 11.2.25.1. Overview
- 11.2.25.2. Products
- 11.2.25.3. SWOT Analysis
- 11.2.25.4. Recent Developments
- 11.2.25.5. Financials (Based on Availability)
- 11.2.26 Royal Dutch Shell PLC
- 11.2.26.1. Overview
- 11.2.26.2. Products
- 11.2.26.3. SWOT Analysis
- 11.2.26.4. Recent Developments
- 11.2.26.5. Financials (Based on Availability)
- 11.2.27 Terpel
- 11.2.27.1. Overview
- 11.2.27.2. Products
- 11.2.27.3. SWOT Analysis
- 11.2.27.4. Recent Developments
- 11.2.27.5. Financials (Based on Availability)
- 11.2.28 TotalEnergies
- 11.2.28.1. Overview
- 11.2.28.2. Products
- 11.2.28.3. SWOT Analysis
- 11.2.28.4. Recent Developments
- 11.2.28.5. Financials (Based on Availability)
- 11.2.29 Valvoline Inc
- 11.2.29.1. Overview
- 11.2.29.2. Products
- 11.2.29.3. SWOT Analysis
- 11.2.29.4. Recent Developments
- 11.2.29.5. Financials (Based on Availability)
- 11.2.30 YP
- 11.2.30.1. Overview
- 11.2.30.2. Products
- 11.2.30.3. SWOT Analysis
- 11.2.30.4. Recent Developments
- 11.2.30.5. Financials (Based on Availability)
- 11.2.1 Behran Oil Company
List of Figures
- Figure 1: Global Lubricants Industry Revenue Breakdown (undefined, %) by Region 2025 & 2033
- Figure 2: North America Lubricants Industry Revenue (undefined), by End User 2025 & 2033
- Figure 3: North America Lubricants Industry Revenue Share (%), by End User 2025 & 2033
- Figure 4: North America Lubricants Industry Revenue (undefined), by Product Type 2025 & 2033
- Figure 5: North America Lubricants Industry Revenue Share (%), by Product Type 2025 & 2033
- Figure 6: North America Lubricants Industry Revenue (undefined), by Country 2025 & 2033
- Figure 7: North America Lubricants Industry Revenue Share (%), by Country 2025 & 2033
- Figure 8: South America Lubricants Industry Revenue (undefined), by End User 2025 & 2033
- Figure 9: South America Lubricants Industry Revenue Share (%), by End User 2025 & 2033
- Figure 10: South America Lubricants Industry Revenue (undefined), by Product Type 2025 & 2033
- Figure 11: South America Lubricants Industry Revenue Share (%), by Product Type 2025 & 2033
- Figure 12: South America Lubricants Industry Revenue (undefined), by Country 2025 & 2033
- Figure 13: South America Lubricants Industry Revenue Share (%), by Country 2025 & 2033
- Figure 14: Europe Lubricants Industry Revenue (undefined), by End User 2025 & 2033
- Figure 15: Europe Lubricants Industry Revenue Share (%), by End User 2025 & 2033
- Figure 16: Europe Lubricants Industry Revenue (undefined), by Product Type 2025 & 2033
- Figure 17: Europe Lubricants Industry Revenue Share (%), by Product Type 2025 & 2033
- Figure 18: Europe Lubricants Industry Revenue (undefined), by Country 2025 & 2033
- Figure 19: Europe Lubricants Industry Revenue Share (%), by Country 2025 & 2033
- Figure 20: Middle East & Africa Lubricants Industry Revenue (undefined), by End User 2025 & 2033
- Figure 21: Middle East & Africa Lubricants Industry Revenue Share (%), by End User 2025 & 2033
- Figure 22: Middle East & Africa Lubricants Industry Revenue (undefined), by Product Type 2025 & 2033
- Figure 23: Middle East & Africa Lubricants Industry Revenue Share (%), by Product Type 2025 & 2033
- Figure 24: Middle East & Africa Lubricants Industry Revenue (undefined), by Country 2025 & 2033
- Figure 25: Middle East & Africa Lubricants Industry Revenue Share (%), by Country 2025 & 2033
- Figure 26: Asia Pacific Lubricants Industry Revenue (undefined), by End User 2025 & 2033
- Figure 27: Asia Pacific Lubricants Industry Revenue Share (%), by End User 2025 & 2033
- Figure 28: Asia Pacific Lubricants Industry Revenue (undefined), by Product Type 2025 & 2033
- Figure 29: Asia Pacific Lubricants Industry Revenue Share (%), by Product Type 2025 & 2033
- Figure 30: Asia Pacific Lubricants Industry Revenue (undefined), by Country 2025 & 2033
- Figure 31: Asia Pacific Lubricants Industry Revenue Share (%), by Country 2025 & 2033
List of Tables
- Table 1: Global Lubricants Industry Revenue undefined Forecast, by End User 2020 & 2033
- Table 2: Global Lubricants Industry Revenue undefined Forecast, by Product Type 2020 & 2033
- Table 3: Global Lubricants Industry Revenue undefined Forecast, by Region 2020 & 2033
- Table 4: Global Lubricants Industry Revenue undefined Forecast, by End User 2020 & 2033
- Table 5: Global Lubricants Industry Revenue undefined Forecast, by Product Type 2020 & 2033
- Table 6: Global Lubricants Industry Revenue undefined Forecast, by Country 2020 & 2033
- Table 7: United States Lubricants Industry Revenue (undefined) Forecast, by Application 2020 & 2033
- Table 8: Canada Lubricants Industry Revenue (undefined) Forecast, by Application 2020 & 2033
- Table 9: Mexico Lubricants Industry Revenue (undefined) Forecast, by Application 2020 & 2033
- Table 10: Global Lubricants Industry Revenue undefined Forecast, by End User 2020 & 2033
- Table 11: Global Lubricants Industry Revenue undefined Forecast, by Product Type 2020 & 2033
- Table 12: Global Lubricants Industry Revenue undefined Forecast, by Country 2020 & 2033
- Table 13: Brazil Lubricants Industry Revenue (undefined) Forecast, by Application 2020 & 2033
- Table 14: Argentina Lubricants Industry Revenue (undefined) Forecast, by Application 2020 & 2033
- Table 15: Rest of South America Lubricants Industry Revenue (undefined) Forecast, by Application 2020 & 2033
- Table 16: Global Lubricants Industry Revenue undefined Forecast, by End User 2020 & 2033
- Table 17: Global Lubricants Industry Revenue undefined Forecast, by Product Type 2020 & 2033
- Table 18: Global Lubricants Industry Revenue undefined Forecast, by Country 2020 & 2033
- Table 19: United Kingdom Lubricants Industry Revenue (undefined) Forecast, by Application 2020 & 2033
- Table 20: Germany Lubricants Industry Revenue (undefined) Forecast, by Application 2020 & 2033
- Table 21: France Lubricants Industry Revenue (undefined) Forecast, by Application 2020 & 2033
- Table 22: Italy Lubricants Industry Revenue (undefined) Forecast, by Application 2020 & 2033
- Table 23: Spain Lubricants Industry Revenue (undefined) Forecast, by Application 2020 & 2033
- Table 24: Russia Lubricants Industry Revenue (undefined) Forecast, by Application 2020 & 2033
- Table 25: Benelux Lubricants Industry Revenue (undefined) Forecast, by Application 2020 & 2033
- Table 26: Nordics Lubricants Industry Revenue (undefined) Forecast, by Application 2020 & 2033
- Table 27: Rest of Europe Lubricants Industry Revenue (undefined) Forecast, by Application 2020 & 2033
- Table 28: Global Lubricants Industry Revenue undefined Forecast, by End User 2020 & 2033
- Table 29: Global Lubricants Industry Revenue undefined Forecast, by Product Type 2020 & 2033
- Table 30: Global Lubricants Industry Revenue undefined Forecast, by Country 2020 & 2033
- Table 31: Turkey Lubricants Industry Revenue (undefined) Forecast, by Application 2020 & 2033
- Table 32: Israel Lubricants Industry Revenue (undefined) Forecast, by Application 2020 & 2033
- Table 33: GCC Lubricants Industry Revenue (undefined) Forecast, by Application 2020 & 2033
- Table 34: North Africa Lubricants Industry Revenue (undefined) Forecast, by Application 2020 & 2033
- Table 35: South Africa Lubricants Industry Revenue (undefined) Forecast, by Application 2020 & 2033
- Table 36: Rest of Middle East & Africa Lubricants Industry Revenue (undefined) Forecast, by Application 2020 & 2033
- Table 37: Global Lubricants Industry Revenue undefined Forecast, by End User 2020 & 2033
- Table 38: Global Lubricants Industry Revenue undefined Forecast, by Product Type 2020 & 2033
- Table 39: Global Lubricants Industry Revenue undefined Forecast, by Country 2020 & 2033
- Table 40: China Lubricants Industry Revenue (undefined) Forecast, by Application 2020 & 2033
- Table 41: India Lubricants Industry Revenue (undefined) Forecast, by Application 2020 & 2033
- Table 42: Japan Lubricants Industry Revenue (undefined) Forecast, by Application 2020 & 2033
- Table 43: South Korea Lubricants Industry Revenue (undefined) Forecast, by Application 2020 & 2033
- Table 44: ASEAN Lubricants Industry Revenue (undefined) Forecast, by Application 2020 & 2033
- Table 45: Oceania Lubricants Industry Revenue (undefined) Forecast, by Application 2020 & 2033
- Table 46: Rest of Asia Pacific Lubricants Industry Revenue (undefined) Forecast, by Application 2020 & 2033
Frequently Asked Questions
1. What is the projected Compound Annual Growth Rate (CAGR) of the Lubricants Industry?
The projected CAGR is approximately 2%.
2. Which companies are prominent players in the Lubricants Industry?
Key companies in the market include Behran Oil Company, BP PLC (Castrol), Carl Bechem GmbH, Chevron Corporation, China National Petroleum Corporation, China Petroleum & Chemical Corporation, Coperative Soceite des petroleum, ENEOS Corporation, Eni SpA, ExxonMobil Corporation, FUCHS, Gazprom, GS Caltex, Gulf Oil International, Hindustan Petroleum Corporation Limited, Idemitsu Kosan Co Ltd, Indian Oil Corporation Limited, Lukoil, Motul, Petromin Corporation, Petronas Lubricants International, Phillips 66 Lubricants, PT Pertamina, PTT Lubricants, Rosneft, Royal Dutch Shell PLC, Terpel, TotalEnergies, Valvoline Inc, YP.
3. What are the main segments of the Lubricants Industry?
The market segments include End User, Product Type.
4. Can you provide details about the market size?
The market size is estimated to be USD XXX N/A as of 2022.
5. What are some drivers contributing to market growth?
N/A
6. What are the notable trends driving market growth?
Largest Segment By End User : Automotive.
7. Are there any restraints impacting market growth?
N/A
8. Can you provide examples of recent developments in the market?
May 2022: TotalEnergies, NEXUS Automotive Extend Strategic Partnership for a period of five years. As part of this partnership, TotalEnergies Lubricants will be expanding its presence in the burgeoning N! community, which has seen rapid growth in sales from EUR 7.2 billion in 2015 to nearly EUR 35 billion by the end of 2021.April 2022: FUCHS company introduced AGRI FARM lubricants which are especially suited for high-end agricultural machines.April 2022: FUCHS Lubricants South Africa has introduced new food-grade Renolin SJL Heavy and Renolin SJL Winter lubricants for the sugar processing industry.The new lubricant offers benefits such as equipment longevity and food safety.
9. What pricing options are available for accessing the report?
Pricing options include single-user, multi-user, and enterprise licenses priced at USD 3800, USD 4500, and USD 5800 respectively.
10. Is the market size provided in terms of value or volume?
The market size is provided in terms of value, measured in N/A.
11. Are there any specific market keywords associated with the report?
Yes, the market keyword associated with the report is "Lubricants Industry," which aids in identifying and referencing the specific market segment covered.
12. How do I determine which pricing option suits my needs best?
The pricing options vary based on user requirements and access needs. Individual users may opt for single-user licenses, while businesses requiring broader access may choose multi-user or enterprise licenses for cost-effective access to the report.
13. Are there any additional resources or data provided in the Lubricants Industry report?
While the report offers comprehensive insights, it's advisable to review the specific contents or supplementary materials provided to ascertain if additional resources or data are available.
14. How can I stay updated on further developments or reports in the Lubricants Industry?
To stay informed about further developments, trends, and reports in the Lubricants Industry, consider subscribing to industry newsletters, following relevant companies and organizations, or regularly checking reputable industry news sources and publications.
Methodology
Step 1 - Identification of Relevant Samples Size from Population Database


Step 2 - Approaches for Defining Global Market Size (Value, Volume* & Price*)

Note*: In applicable scenarios
Step 3 - Data Sources
Primary Research
- Web Analytics
- Survey Reports
- Research Institute
- Latest Research Reports
- Opinion Leaders
Secondary Research
- Annual Reports
- White Paper
- Latest Press Release
- Industry Association
- Paid Database
- Investor Presentations

Step 4 - Data Triangulation
Involves using different sources of information in order to increase the validity of a study
These sources are likely to be stakeholders in a program - participants, other researchers, program staff, other community members, and so on.
Then we put all data in single framework & apply various statistical tools to find out the dynamic on the market.
During the analysis stage, feedback from the stakeholder groups would be compared to determine areas of agreement as well as areas of divergence