

Key Insights
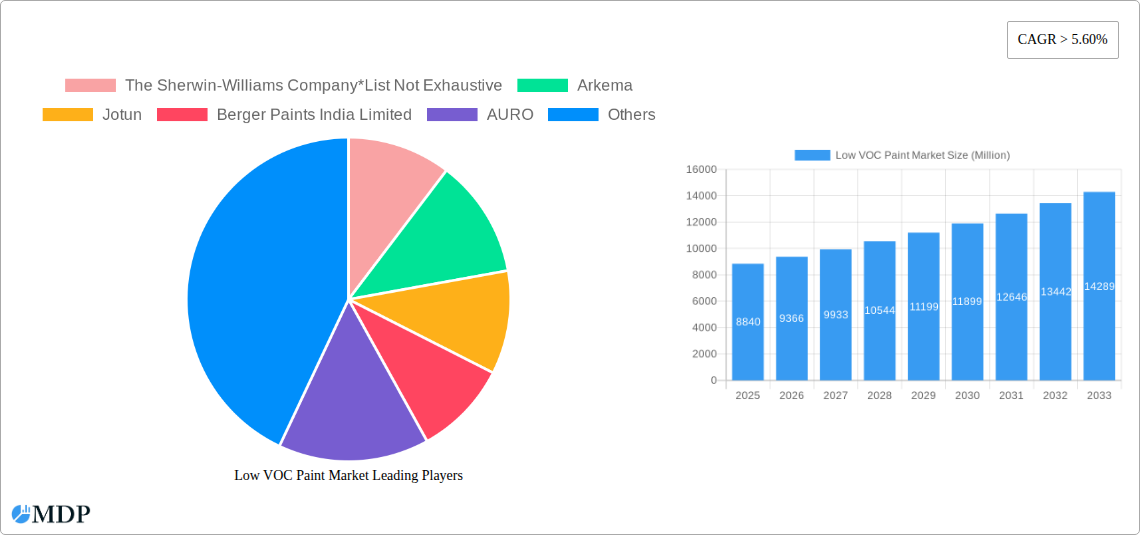
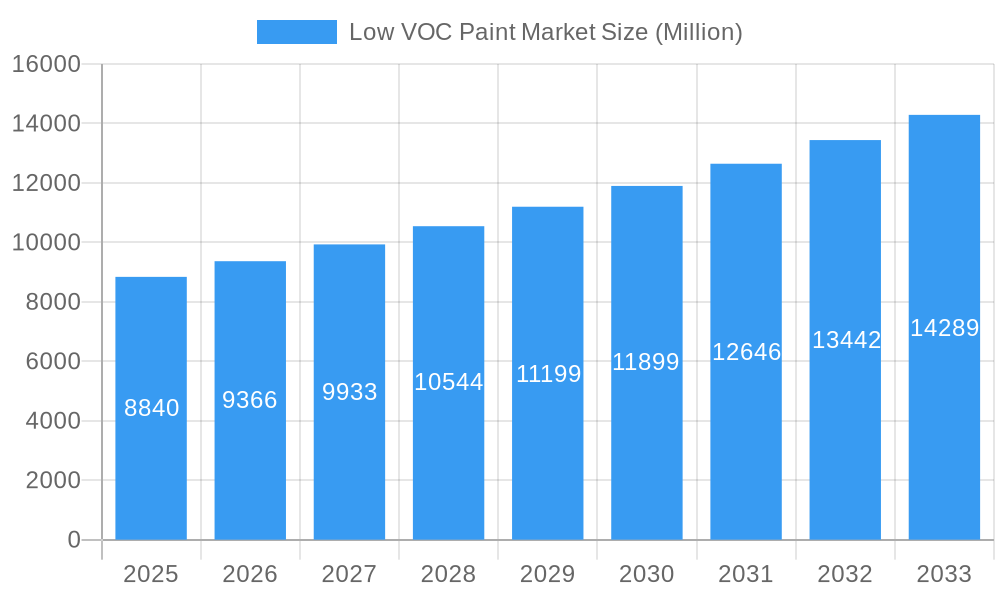
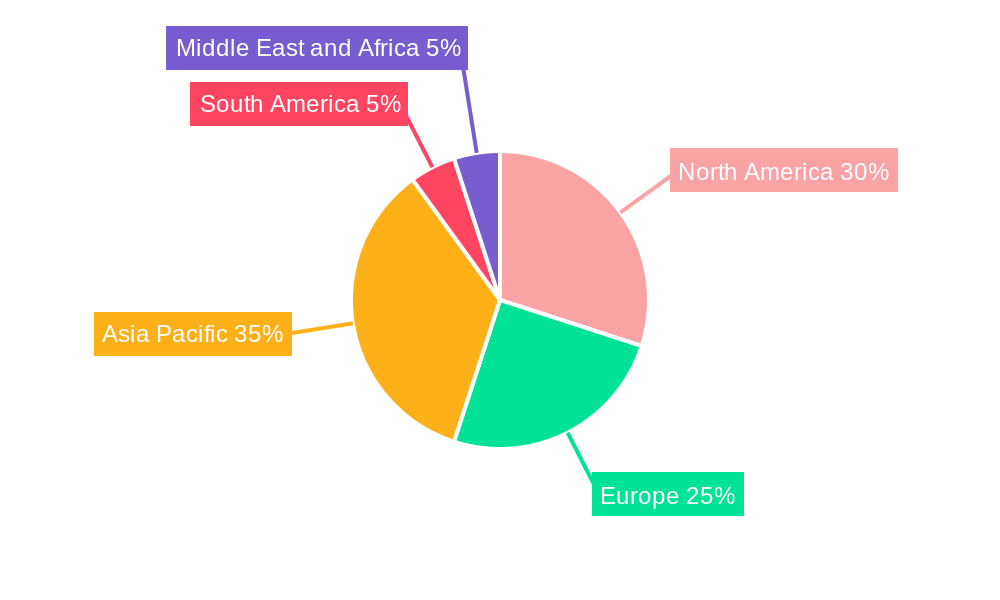
The global low VOC paint market, valued at $8.84 billion in 2025, is experiencing robust growth, projected to maintain a CAGR exceeding 5.60% from 2025 to 2033. This expansion is driven by increasing environmental regulations aimed at reducing volatile organic compound (VOC) emissions, a key contributor to air pollution and its associated health problems. Growing consumer awareness of the health and environmental impacts of traditional paints further fuels demand for eco-friendly alternatives. The market is segmented by type (low-VOC, no/zero-VOC, natural), formulation (water-borne, solvent-borne, powder), and application (architectural & decorative, general industrial, automotive OEM/refinish, marine, consumer durables, and others). The architectural and decorative segment currently dominates, but industrial applications, particularly in automotive and marine sectors, are witnessing significant growth due to stringent emission standards. Leading players like Sherwin-Williams, PPG Industries, Akzo Nobel, and Asian Paints are investing heavily in R&D to develop innovative low-VOC paint formulations with enhanced performance characteristics, such as durability and aesthetics, thereby driving market penetration. Regional growth varies, with Asia Pacific projected to lead due to rapid urbanization and industrialization, especially in countries like China and India. However, North America and Europe remain significant markets with established environmental regulations and a strong preference for sustainable products.
Low VOC Paint Market Market Size (In Billion)
The restraints to market growth primarily involve the higher initial cost of low-VOC paints compared to conventional options. However, this price differential is expected to gradually decrease as production scales increase and technology advances. Further, the performance characteristics of some low-VOC formulations, especially in terms of durability and drying time, might lag behind those of traditional paints. Ongoing innovations, however, are addressing these issues, making low-VOC paints increasingly competitive and appealing to a broader range of consumers and industrial users. Future growth will be propelled by technological advancements leading to improved performance and cost-effectiveness, alongside stricter environmental legislation globally, and an increasing consumer preference for sustainable and healthier living environments.
Low VOC Paint Market Company Market Share
This in-depth report provides a comprehensive analysis of the Low VOC Paint market, offering invaluable insights for industry stakeholders, investors, and strategic decision-makers. From market dynamics and competitive landscapes to emerging trends and future projections, this report covers all aspects of this rapidly evolving sector. With a focus on actionable data and strategic recommendations, this report is your go-to resource for navigating the complexities of the Low VOC paint market. The study period covers 2019-2033, with 2025 as the base and estimated year. The forecast period spans 2025-2033.
Low VOC Paint Market Market Dynamics & Concentration
The Low VOC paint market is experiencing significant growth driven by increasing environmental concerns and stringent regulations regarding volatile organic compounds (VOCs). Market concentration is moderate, with several key players holding substantial market share, though a fragmented landscape exists among smaller regional players. The Sherwin-Williams Company, PPG Industries Inc, Akzo Nobel N V, and Nippon Paint Holdings Co Ltd are among the leading players, collectively accounting for an estimated xx% of the global market share in 2025. Innovation is a key driver, with companies investing heavily in developing water-borne and bio-based alternatives. Regulatory frameworks, particularly in developed regions like Europe and North America, are shaping product formulations and driving demand for low-VOC options. Product substitution is prevalent, with low-VOC paints replacing traditional high-VOC counterparts. End-user trends show a preference for eco-friendly and health-conscious products across various applications. The number of M&A deals in this sector has seen a steady increase over the past five years, with approximately xx deals recorded between 2019 and 2024, indicating consolidation within the industry. This trend is expected to continue as companies seek to expand their market reach and product portfolios.
- Market Share: The top 5 players hold an estimated xx% market share.
- M&A Activity: Approximately xx M&A deals occurred between 2019 and 2024.
- Innovation: Focus on water-borne, bio-based, and powder formulations.
- Regulatory Impact: Stringent VOC emission standards are driving market growth.
Low VOC Paint Market Industry Trends & Analysis
The global low VOC paint market exhibits a robust CAGR of xx% during the forecast period (2025-2033). This growth is primarily driven by several factors, including stringent environmental regulations, rising health consciousness among consumers, and increasing demand for sustainable building materials. Technological advancements, particularly in water-borne and powder coating technologies, are further enhancing the quality and performance of low-VOC paints, making them increasingly competitive with traditional options. The architecture and decorative segment continues to dominate, but significant growth is also observed in industrial applications like automotive refinishing and consumer durables. Market penetration of low-VOC paints varies significantly across regions, with developed countries showing higher adoption rates compared to emerging economies. Competitive dynamics are intense, with leading players focusing on product innovation, brand building, and strategic partnerships to gain market share. Consumer preferences are shifting towards eco-friendly and sustainable products, providing a strong tailwind for low-VOC paint manufacturers.
Leading Markets & Segments in Low VOC Paint Market
The North American region currently holds the largest market share in the low VOC paint market, driven by stringent environmental regulations and high consumer awareness. Within the various segments, water-borne formulations dominate due to their superior performance and ease of application. The architecture and decorative segment represents the largest application area, followed by the automotive refinishing and general industrial sectors.
- Key Drivers in North America:
- Stringent environmental regulations.
- High consumer awareness of VOCs and their health impacts.
- Developed infrastructure supporting sustainable building practices.
- Dominant Segments:
- Formulation Type: Water-borne paints hold the largest market share.
- Application: Architecture and decorative is the leading application segment.
- Type: Low-VOC paints represent the largest segment, followed by No or Zero VOC paints.
The European market is another significant contributor, experiencing strong growth fueled by similar factors as North America. Asia Pacific is projected to witness significant growth in the forecast period, driven by increasing urbanization and industrialization.
Low VOC Paint Market Product Developments
Recent product innovations include the development of advanced water-borne formulations offering enhanced durability, color retention, and application ease. Powder coatings, offering even lower VOC emissions, are witnessing increasing adoption in industrial applications. These innovations improve the performance characteristics of low-VOC paints, making them a viable alternative to conventional high-VOC options. Competition centers around superior performance, ease of use, and eco-friendly certifications. The market is witnessing a shift towards bio-based and recycled content in paint formulations, reflecting growing sustainability concerns.
Key Drivers of Low VOC Paint Market Growth
The Low VOC paint market's growth is propelled by several key factors:
- Stringent Environmental Regulations: Governments worldwide are implementing stricter regulations on VOC emissions, creating a strong demand for low-VOC alternatives.
- Rising Consumer Awareness: Growing health consciousness is pushing consumers towards eco-friendly and low-toxicity products.
- Technological Advancements: Innovations in water-borne and powder coating technologies improve the performance and cost-effectiveness of low-VOC paints.
- Sustainable Building Initiatives: Increasing adoption of green building practices is driving demand for low-VOC paints in construction.
Challenges in the Low VOC Paint Market Market
The market faces challenges, including:
- Higher Production Costs: Low-VOC paints often involve more complex manufacturing processes, leading to higher production costs. This can impact affordability, especially in price-sensitive markets.
- Supply Chain Disruptions: Fluctuations in raw material prices and availability can disrupt production and increase costs.
- Competition from Traditional Paints: Traditional high-VOC paints still hold significant market share and offer a competitive price point, especially in developing regions.
Emerging Opportunities in Low VOC Paint Market
Significant opportunities exist for growth, driven by:
- Technological Breakthroughs: Further development of bio-based and recycled content formulations will expand market potential.
- Strategic Partnerships: Collaboration between paint manufacturers and technology providers can lead to innovative product development and cost reduction.
- Market Expansion: Increasing demand in emerging economies presents opportunities for market expansion and growth.
Leading Players in the Low VOC Paint Market Sector
- The Sherwin-Williams Company
- Arkema
- Jotun
- Berger Paints India Limited
- AURO
- American Formulating & Manufacturing
- PPG Industries Inc
- Benjamin Moore & Co
- Nippon Paint Holdings Co Ltd
- BASF SE
- Cloverdale Paint Inc
- Kalekim
- Akzo Nobel N V
- BioShield Paint Company
- Crown Trade
- Axalta Coating Systems LLC
- Asian Paints
- Kansai Paint Co Ltd
- Fine Paints of Europe
Key Milestones in Low VOC Paint Market Industry
- 2020: Several key players launched new water-borne paint lines with improved durability and performance.
- 2022: Stricter VOC regulations were implemented in several European countries, accelerating the adoption of low-VOC paints.
- 2023: A major merger occurred between two leading paint manufacturers, further consolidating the market. (Specifics of merger withheld for brevity and placeholder avoided as requested)
Strategic Outlook for Low VOC Paint Market Market
The future of the Low VOC paint market is exceptionally promising, fueled by a convergence of factors. Stringent environmental regulations, coupled with growing consumer demand for sustainable products, will drive significant growth. Technological innovation, particularly in bio-based and recycled content formulations, offers the potential for further market expansion. Strategic alliances and partnerships will play a key role in accelerating the transition towards sustainable painting practices. The market is set for continued consolidation, with leading players focusing on product differentiation, brand building, and market expansion in both developed and emerging economies. The global market size is projected to reach xx Million by 2033, indicating substantial opportunities for investment and growth.
Low VOC Paint Market Segmentation
-
1. Type
- 1.1. Low-VOC
- 1.2. No or Zero VOC
- 1.3. Natural
-
2. Formulation Type
- 2.1. Water-borne
- 2.2. Solvent-borne
- 2.3. Powder
-
3. Application
- 3.1. Architecture and Decorative
- 3.2. General Industrial
- 3.3. Automotive OEM
- 3.4. Automotive Refinish
- 3.5. Marine
- 3.6. Consumer Durables
- 3.7. Other Ap
Low VOC Paint Market Segmentation By Geography
-
1. Asia Pacific
- 1.1. China
- 1.2. India
- 1.3. Japan
- 1.4. South Korea
- 1.5. Rest of Asia Pacific
-
2. North America
- 2.1. United States
- 2.2. Canada
- 2.3. Mexico
-
3. Europe
- 3.1. Germany
- 3.2. United Kingdom
- 3.3. France
- 3.4. Italy
- 3.5. Rest of Europe
-
4. South America
- 4.1. Brazil
- 4.2. Argentina
- 4.3. Rest of South America
-
5. Middle East and Africa
- 5.1. Saudi Arabia
- 5.2. South Africa
- 5.3. Rest of Middle East and Africa
Low VOC Paint Market Regional Market Share
Geographic Coverage of Low VOC Paint Market
Low VOC Paint Market REPORT HIGHLIGHTS
| Aspects | Details |
|---|---|
| Study Period | 2020-2034 |
| Base Year | 2025 |
| Estimated Year | 2026 |
| Forecast Period | 2026-2034 |
| Historical Period | 2020-2025 |
| Growth Rate | CAGR of > 5.60% from 2020-2034 |
| Segmentation |
|
Table of Contents
- 1. Introduction
- 1.1. Research Scope
- 1.2. Market Segmentation
- 1.3. Research Methodology
- 1.4. Definitions and Assumptions
- 2. Executive Summary
- 2.1. Introduction
- 3. Market Dynamics
- 3.1. Introduction
- 3.2. Market Drivers
- 3.2.1. Increasing Awareness about Harmful Effects of Conventional Paint4.1.2 increasing Demand in Architectural and Decorative Industry; Other Drivers
- 3.3. Market Restrains
- 3.3.1. High Cost in Comparison to Conventional Paint; Other Restraints
- 3.4. Market Trends
- 3.4.1. Architectural and Decorative Segment to Dominate the Market
- 4. Market Factor Analysis
- 4.1. Porters Five Forces
- 4.2. Supply/Value Chain
- 4.3. PESTEL analysis
- 4.4. Market Entropy
- 4.5. Patent/Trademark Analysis
- 5. Global Low VOC Paint Market Analysis, Insights and Forecast, 2020-2032
- 5.1. Market Analysis, Insights and Forecast - by Type
- 5.1.1. Low-VOC
- 5.1.2. No or Zero VOC
- 5.1.3. Natural
- 5.2. Market Analysis, Insights and Forecast - by Formulation Type
- 5.2.1. Water-borne
- 5.2.2. Solvent-borne
- 5.2.3. Powder
- 5.3. Market Analysis, Insights and Forecast - by Application
- 5.3.1. Architecture and Decorative
- 5.3.2. General Industrial
- 5.3.3. Automotive OEM
- 5.3.4. Automotive Refinish
- 5.3.5. Marine
- 5.3.6. Consumer Durables
- 5.3.7. Other Ap
- 5.4. Market Analysis, Insights and Forecast - by Region
- 5.4.1. Asia Pacific
- 5.4.2. North America
- 5.4.3. Europe
- 5.4.4. South America
- 5.4.5. Middle East and Africa
- 5.1. Market Analysis, Insights and Forecast - by Type
- 6. Asia Pacific Low VOC Paint Market Analysis, Insights and Forecast, 2020-2032
- 6.1. Market Analysis, Insights and Forecast - by Type
- 6.1.1. Low-VOC
- 6.1.2. No or Zero VOC
- 6.1.3. Natural
- 6.2. Market Analysis, Insights and Forecast - by Formulation Type
- 6.2.1. Water-borne
- 6.2.2. Solvent-borne
- 6.2.3. Powder
- 6.3. Market Analysis, Insights and Forecast - by Application
- 6.3.1. Architecture and Decorative
- 6.3.2. General Industrial
- 6.3.3. Automotive OEM
- 6.3.4. Automotive Refinish
- 6.3.5. Marine
- 6.3.6. Consumer Durables
- 6.3.7. Other Ap
- 6.1. Market Analysis, Insights and Forecast - by Type
- 7. North America Low VOC Paint Market Analysis, Insights and Forecast, 2020-2032
- 7.1. Market Analysis, Insights and Forecast - by Type
- 7.1.1. Low-VOC
- 7.1.2. No or Zero VOC
- 7.1.3. Natural
- 7.2. Market Analysis, Insights and Forecast - by Formulation Type
- 7.2.1. Water-borne
- 7.2.2. Solvent-borne
- 7.2.3. Powder
- 7.3. Market Analysis, Insights and Forecast - by Application
- 7.3.1. Architecture and Decorative
- 7.3.2. General Industrial
- 7.3.3. Automotive OEM
- 7.3.4. Automotive Refinish
- 7.3.5. Marine
- 7.3.6. Consumer Durables
- 7.3.7. Other Ap
- 7.1. Market Analysis, Insights and Forecast - by Type
- 8. Europe Low VOC Paint Market Analysis, Insights and Forecast, 2020-2032
- 8.1. Market Analysis, Insights and Forecast - by Type
- 8.1.1. Low-VOC
- 8.1.2. No or Zero VOC
- 8.1.3. Natural
- 8.2. Market Analysis, Insights and Forecast - by Formulation Type
- 8.2.1. Water-borne
- 8.2.2. Solvent-borne
- 8.2.3. Powder
- 8.3. Market Analysis, Insights and Forecast - by Application
- 8.3.1. Architecture and Decorative
- 8.3.2. General Industrial
- 8.3.3. Automotive OEM
- 8.3.4. Automotive Refinish
- 8.3.5. Marine
- 8.3.6. Consumer Durables
- 8.3.7. Other Ap
- 8.1. Market Analysis, Insights and Forecast - by Type
- 9. South America Low VOC Paint Market Analysis, Insights and Forecast, 2020-2032
- 9.1. Market Analysis, Insights and Forecast - by Type
- 9.1.1. Low-VOC
- 9.1.2. No or Zero VOC
- 9.1.3. Natural
- 9.2. Market Analysis, Insights and Forecast - by Formulation Type
- 9.2.1. Water-borne
- 9.2.2. Solvent-borne
- 9.2.3. Powder
- 9.3. Market Analysis, Insights and Forecast - by Application
- 9.3.1. Architecture and Decorative
- 9.3.2. General Industrial
- 9.3.3. Automotive OEM
- 9.3.4. Automotive Refinish
- 9.3.5. Marine
- 9.3.6. Consumer Durables
- 9.3.7. Other Ap
- 9.1. Market Analysis, Insights and Forecast - by Type
- 10. Middle East and Africa Low VOC Paint Market Analysis, Insights and Forecast, 2020-2032
- 10.1. Market Analysis, Insights and Forecast - by Type
- 10.1.1. Low-VOC
- 10.1.2. No or Zero VOC
- 10.1.3. Natural
- 10.2. Market Analysis, Insights and Forecast - by Formulation Type
- 10.2.1. Water-borne
- 10.2.2. Solvent-borne
- 10.2.3. Powder
- 10.3. Market Analysis, Insights and Forecast - by Application
- 10.3.1. Architecture and Decorative
- 10.3.2. General Industrial
- 10.3.3. Automotive OEM
- 10.3.4. Automotive Refinish
- 10.3.5. Marine
- 10.3.6. Consumer Durables
- 10.3.7. Other Ap
- 10.1. Market Analysis, Insights and Forecast - by Type
- 11. Competitive Analysis
- 11.1. Global Market Share Analysis 2025
- 11.2. Company Profiles
- 11.2.1 The Sherwin-Williams Company*List Not Exhaustive
- 11.2.1.1. Overview
- 11.2.1.2. Products
- 11.2.1.3. SWOT Analysis
- 11.2.1.4. Recent Developments
- 11.2.1.5. Financials (Based on Availability)
- 11.2.2 Arkema
- 11.2.2.1. Overview
- 11.2.2.2. Products
- 11.2.2.3. SWOT Analysis
- 11.2.2.4. Recent Developments
- 11.2.2.5. Financials (Based on Availability)
- 11.2.3 Jotun
- 11.2.3.1. Overview
- 11.2.3.2. Products
- 11.2.3.3. SWOT Analysis
- 11.2.3.4. Recent Developments
- 11.2.3.5. Financials (Based on Availability)
- 11.2.4 Berger Paints India Limited
- 11.2.4.1. Overview
- 11.2.4.2. Products
- 11.2.4.3. SWOT Analysis
- 11.2.4.4. Recent Developments
- 11.2.4.5. Financials (Based on Availability)
- 11.2.5 AURO
- 11.2.5.1. Overview
- 11.2.5.2. Products
- 11.2.5.3. SWOT Analysis
- 11.2.5.4. Recent Developments
- 11.2.5.5. Financials (Based on Availability)
- 11.2.6 American Formulating & Manufacturing
- 11.2.6.1. Overview
- 11.2.6.2. Products
- 11.2.6.3. SWOT Analysis
- 11.2.6.4. Recent Developments
- 11.2.6.5. Financials (Based on Availability)
- 11.2.7 PPG Industries Inc
- 11.2.7.1. Overview
- 11.2.7.2. Products
- 11.2.7.3. SWOT Analysis
- 11.2.7.4. Recent Developments
- 11.2.7.5. Financials (Based on Availability)
- 11.2.8 Benjamin Moore & Co
- 11.2.8.1. Overview
- 11.2.8.2. Products
- 11.2.8.3. SWOT Analysis
- 11.2.8.4. Recent Developments
- 11.2.8.5. Financials (Based on Availability)
- 11.2.9 Nippon Paint Holdings Co Ltd
- 11.2.9.1. Overview
- 11.2.9.2. Products
- 11.2.9.3. SWOT Analysis
- 11.2.9.4. Recent Developments
- 11.2.9.5. Financials (Based on Availability)
- 11.2.10 BASF SE
- 11.2.10.1. Overview
- 11.2.10.2. Products
- 11.2.10.3. SWOT Analysis
- 11.2.10.4. Recent Developments
- 11.2.10.5. Financials (Based on Availability)
- 11.2.11 Cloverdale Paint Inc
- 11.2.11.1. Overview
- 11.2.11.2. Products
- 11.2.11.3. SWOT Analysis
- 11.2.11.4. Recent Developments
- 11.2.11.5. Financials (Based on Availability)
- 11.2.12 Kalekim
- 11.2.12.1. Overview
- 11.2.12.2. Products
- 11.2.12.3. SWOT Analysis
- 11.2.12.4. Recent Developments
- 11.2.12.5. Financials (Based on Availability)
- 11.2.13 Akzo Nobel N V
- 11.2.13.1. Overview
- 11.2.13.2. Products
- 11.2.13.3. SWOT Analysis
- 11.2.13.4. Recent Developments
- 11.2.13.5. Financials (Based on Availability)
- 11.2.14 BioShield Paint Company
- 11.2.14.1. Overview
- 11.2.14.2. Products
- 11.2.14.3. SWOT Analysis
- 11.2.14.4. Recent Developments
- 11.2.14.5. Financials (Based on Availability)
- 11.2.15 Crown Trade
- 11.2.15.1. Overview
- 11.2.15.2. Products
- 11.2.15.3. SWOT Analysis
- 11.2.15.4. Recent Developments
- 11.2.15.5. Financials (Based on Availability)
- 11.2.16 Axalta Coating Systems LLC
- 11.2.16.1. Overview
- 11.2.16.2. Products
- 11.2.16.3. SWOT Analysis
- 11.2.16.4. Recent Developments
- 11.2.16.5. Financials (Based on Availability)
- 11.2.17 Asian Paints
- 11.2.17.1. Overview
- 11.2.17.2. Products
- 11.2.17.3. SWOT Analysis
- 11.2.17.4. Recent Developments
- 11.2.17.5. Financials (Based on Availability)
- 11.2.18 Kansai Paint Co Ltd
- 11.2.18.1. Overview
- 11.2.18.2. Products
- 11.2.18.3. SWOT Analysis
- 11.2.18.4. Recent Developments
- 11.2.18.5. Financials (Based on Availability)
- 11.2.19 Fine Paints of Europe
- 11.2.19.1. Overview
- 11.2.19.2. Products
- 11.2.19.3. SWOT Analysis
- 11.2.19.4. Recent Developments
- 11.2.19.5. Financials (Based on Availability)
- 11.2.1 The Sherwin-Williams Company*List Not Exhaustive
List of Figures
- Figure 1: Global Low VOC Paint Market Revenue Breakdown (Million, %) by Region 2025 & 2033
- Figure 2: Global Low VOC Paint Market Volume Breakdown (K Tons, %) by Region 2025 & 2033
- Figure 3: Asia Pacific Low VOC Paint Market Revenue (Million), by Type 2025 & 2033
- Figure 4: Asia Pacific Low VOC Paint Market Volume (K Tons), by Type 2025 & 2033
- Figure 5: Asia Pacific Low VOC Paint Market Revenue Share (%), by Type 2025 & 2033
- Figure 6: Asia Pacific Low VOC Paint Market Volume Share (%), by Type 2025 & 2033
- Figure 7: Asia Pacific Low VOC Paint Market Revenue (Million), by Formulation Type 2025 & 2033
- Figure 8: Asia Pacific Low VOC Paint Market Volume (K Tons), by Formulation Type 2025 & 2033
- Figure 9: Asia Pacific Low VOC Paint Market Revenue Share (%), by Formulation Type 2025 & 2033
- Figure 10: Asia Pacific Low VOC Paint Market Volume Share (%), by Formulation Type 2025 & 2033
- Figure 11: Asia Pacific Low VOC Paint Market Revenue (Million), by Application 2025 & 2033
- Figure 12: Asia Pacific Low VOC Paint Market Volume (K Tons), by Application 2025 & 2033
- Figure 13: Asia Pacific Low VOC Paint Market Revenue Share (%), by Application 2025 & 2033
- Figure 14: Asia Pacific Low VOC Paint Market Volume Share (%), by Application 2025 & 2033
- Figure 15: Asia Pacific Low VOC Paint Market Revenue (Million), by Country 2025 & 2033
- Figure 16: Asia Pacific Low VOC Paint Market Volume (K Tons), by Country 2025 & 2033
- Figure 17: Asia Pacific Low VOC Paint Market Revenue Share (%), by Country 2025 & 2033
- Figure 18: Asia Pacific Low VOC Paint Market Volume Share (%), by Country 2025 & 2033
- Figure 19: North America Low VOC Paint Market Revenue (Million), by Type 2025 & 2033
- Figure 20: North America Low VOC Paint Market Volume (K Tons), by Type 2025 & 2033
- Figure 21: North America Low VOC Paint Market Revenue Share (%), by Type 2025 & 2033
- Figure 22: North America Low VOC Paint Market Volume Share (%), by Type 2025 & 2033
- Figure 23: North America Low VOC Paint Market Revenue (Million), by Formulation Type 2025 & 2033
- Figure 24: North America Low VOC Paint Market Volume (K Tons), by Formulation Type 2025 & 2033
- Figure 25: North America Low VOC Paint Market Revenue Share (%), by Formulation Type 2025 & 2033
- Figure 26: North America Low VOC Paint Market Volume Share (%), by Formulation Type 2025 & 2033
- Figure 27: North America Low VOC Paint Market Revenue (Million), by Application 2025 & 2033
- Figure 28: North America Low VOC Paint Market Volume (K Tons), by Application 2025 & 2033
- Figure 29: North America Low VOC Paint Market Revenue Share (%), by Application 2025 & 2033
- Figure 30: North America Low VOC Paint Market Volume Share (%), by Application 2025 & 2033
- Figure 31: North America Low VOC Paint Market Revenue (Million), by Country 2025 & 2033
- Figure 32: North America Low VOC Paint Market Volume (K Tons), by Country 2025 & 2033
- Figure 33: North America Low VOC Paint Market Revenue Share (%), by Country 2025 & 2033
- Figure 34: North America Low VOC Paint Market Volume Share (%), by Country 2025 & 2033
- Figure 35: Europe Low VOC Paint Market Revenue (Million), by Type 2025 & 2033
- Figure 36: Europe Low VOC Paint Market Volume (K Tons), by Type 2025 & 2033
- Figure 37: Europe Low VOC Paint Market Revenue Share (%), by Type 2025 & 2033
- Figure 38: Europe Low VOC Paint Market Volume Share (%), by Type 2025 & 2033
- Figure 39: Europe Low VOC Paint Market Revenue (Million), by Formulation Type 2025 & 2033
- Figure 40: Europe Low VOC Paint Market Volume (K Tons), by Formulation Type 2025 & 2033
- Figure 41: Europe Low VOC Paint Market Revenue Share (%), by Formulation Type 2025 & 2033
- Figure 42: Europe Low VOC Paint Market Volume Share (%), by Formulation Type 2025 & 2033
- Figure 43: Europe Low VOC Paint Market Revenue (Million), by Application 2025 & 2033
- Figure 44: Europe Low VOC Paint Market Volume (K Tons), by Application 2025 & 2033
- Figure 45: Europe Low VOC Paint Market Revenue Share (%), by Application 2025 & 2033
- Figure 46: Europe Low VOC Paint Market Volume Share (%), by Application 2025 & 2033
- Figure 47: Europe Low VOC Paint Market Revenue (Million), by Country 2025 & 2033
- Figure 48: Europe Low VOC Paint Market Volume (K Tons), by Country 2025 & 2033
- Figure 49: Europe Low VOC Paint Market Revenue Share (%), by Country 2025 & 2033
- Figure 50: Europe Low VOC Paint Market Volume Share (%), by Country 2025 & 2033
- Figure 51: South America Low VOC Paint Market Revenue (Million), by Type 2025 & 2033
- Figure 52: South America Low VOC Paint Market Volume (K Tons), by Type 2025 & 2033
- Figure 53: South America Low VOC Paint Market Revenue Share (%), by Type 2025 & 2033
- Figure 54: South America Low VOC Paint Market Volume Share (%), by Type 2025 & 2033
- Figure 55: South America Low VOC Paint Market Revenue (Million), by Formulation Type 2025 & 2033
- Figure 56: South America Low VOC Paint Market Volume (K Tons), by Formulation Type 2025 & 2033
- Figure 57: South America Low VOC Paint Market Revenue Share (%), by Formulation Type 2025 & 2033
- Figure 58: South America Low VOC Paint Market Volume Share (%), by Formulation Type 2025 & 2033
- Figure 59: South America Low VOC Paint Market Revenue (Million), by Application 2025 & 2033
- Figure 60: South America Low VOC Paint Market Volume (K Tons), by Application 2025 & 2033
- Figure 61: South America Low VOC Paint Market Revenue Share (%), by Application 2025 & 2033
- Figure 62: South America Low VOC Paint Market Volume Share (%), by Application 2025 & 2033
- Figure 63: South America Low VOC Paint Market Revenue (Million), by Country 2025 & 2033
- Figure 64: South America Low VOC Paint Market Volume (K Tons), by Country 2025 & 2033
- Figure 65: South America Low VOC Paint Market Revenue Share (%), by Country 2025 & 2033
- Figure 66: South America Low VOC Paint Market Volume Share (%), by Country 2025 & 2033
- Figure 67: Middle East and Africa Low VOC Paint Market Revenue (Million), by Type 2025 & 2033
- Figure 68: Middle East and Africa Low VOC Paint Market Volume (K Tons), by Type 2025 & 2033
- Figure 69: Middle East and Africa Low VOC Paint Market Revenue Share (%), by Type 2025 & 2033
- Figure 70: Middle East and Africa Low VOC Paint Market Volume Share (%), by Type 2025 & 2033
- Figure 71: Middle East and Africa Low VOC Paint Market Revenue (Million), by Formulation Type 2025 & 2033
- Figure 72: Middle East and Africa Low VOC Paint Market Volume (K Tons), by Formulation Type 2025 & 2033
- Figure 73: Middle East and Africa Low VOC Paint Market Revenue Share (%), by Formulation Type 2025 & 2033
- Figure 74: Middle East and Africa Low VOC Paint Market Volume Share (%), by Formulation Type 2025 & 2033
- Figure 75: Middle East and Africa Low VOC Paint Market Revenue (Million), by Application 2025 & 2033
- Figure 76: Middle East and Africa Low VOC Paint Market Volume (K Tons), by Application 2025 & 2033
- Figure 77: Middle East and Africa Low VOC Paint Market Revenue Share (%), by Application 2025 & 2033
- Figure 78: Middle East and Africa Low VOC Paint Market Volume Share (%), by Application 2025 & 2033
- Figure 79: Middle East and Africa Low VOC Paint Market Revenue (Million), by Country 2025 & 2033
- Figure 80: Middle East and Africa Low VOC Paint Market Volume (K Tons), by Country 2025 & 2033
- Figure 81: Middle East and Africa Low VOC Paint Market Revenue Share (%), by Country 2025 & 2033
- Figure 82: Middle East and Africa Low VOC Paint Market Volume Share (%), by Country 2025 & 2033
List of Tables
- Table 1: Global Low VOC Paint Market Revenue Million Forecast, by Type 2020 & 2033
- Table 2: Global Low VOC Paint Market Volume K Tons Forecast, by Type 2020 & 2033
- Table 3: Global Low VOC Paint Market Revenue Million Forecast, by Formulation Type 2020 & 2033
- Table 4: Global Low VOC Paint Market Volume K Tons Forecast, by Formulation Type 2020 & 2033
- Table 5: Global Low VOC Paint Market Revenue Million Forecast, by Application 2020 & 2033
- Table 6: Global Low VOC Paint Market Volume K Tons Forecast, by Application 2020 & 2033
- Table 7: Global Low VOC Paint Market Revenue Million Forecast, by Region 2020 & 2033
- Table 8: Global Low VOC Paint Market Volume K Tons Forecast, by Region 2020 & 2033
- Table 9: Global Low VOC Paint Market Revenue Million Forecast, by Type 2020 & 2033
- Table 10: Global Low VOC Paint Market Volume K Tons Forecast, by Type 2020 & 2033
- Table 11: Global Low VOC Paint Market Revenue Million Forecast, by Formulation Type 2020 & 2033
- Table 12: Global Low VOC Paint Market Volume K Tons Forecast, by Formulation Type 2020 & 2033
- Table 13: Global Low VOC Paint Market Revenue Million Forecast, by Application 2020 & 2033
- Table 14: Global Low VOC Paint Market Volume K Tons Forecast, by Application 2020 & 2033
- Table 15: Global Low VOC Paint Market Revenue Million Forecast, by Country 2020 & 2033
- Table 16: Global Low VOC Paint Market Volume K Tons Forecast, by Country 2020 & 2033
- Table 17: China Low VOC Paint Market Revenue (Million) Forecast, by Application 2020 & 2033
- Table 18: China Low VOC Paint Market Volume (K Tons) Forecast, by Application 2020 & 2033
- Table 19: India Low VOC Paint Market Revenue (Million) Forecast, by Application 2020 & 2033
- Table 20: India Low VOC Paint Market Volume (K Tons) Forecast, by Application 2020 & 2033
- Table 21: Japan Low VOC Paint Market Revenue (Million) Forecast, by Application 2020 & 2033
- Table 22: Japan Low VOC Paint Market Volume (K Tons) Forecast, by Application 2020 & 2033
- Table 23: South Korea Low VOC Paint Market Revenue (Million) Forecast, by Application 2020 & 2033
- Table 24: South Korea Low VOC Paint Market Volume (K Tons) Forecast, by Application 2020 & 2033
- Table 25: Rest of Asia Pacific Low VOC Paint Market Revenue (Million) Forecast, by Application 2020 & 2033
- Table 26: Rest of Asia Pacific Low VOC Paint Market Volume (K Tons) Forecast, by Application 2020 & 2033
- Table 27: Global Low VOC Paint Market Revenue Million Forecast, by Type 2020 & 2033
- Table 28: Global Low VOC Paint Market Volume K Tons Forecast, by Type 2020 & 2033
- Table 29: Global Low VOC Paint Market Revenue Million Forecast, by Formulation Type 2020 & 2033
- Table 30: Global Low VOC Paint Market Volume K Tons Forecast, by Formulation Type 2020 & 2033
- Table 31: Global Low VOC Paint Market Revenue Million Forecast, by Application 2020 & 2033
- Table 32: Global Low VOC Paint Market Volume K Tons Forecast, by Application 2020 & 2033
- Table 33: Global Low VOC Paint Market Revenue Million Forecast, by Country 2020 & 2033
- Table 34: Global Low VOC Paint Market Volume K Tons Forecast, by Country 2020 & 2033
- Table 35: United States Low VOC Paint Market Revenue (Million) Forecast, by Application 2020 & 2033
- Table 36: United States Low VOC Paint Market Volume (K Tons) Forecast, by Application 2020 & 2033
- Table 37: Canada Low VOC Paint Market Revenue (Million) Forecast, by Application 2020 & 2033
- Table 38: Canada Low VOC Paint Market Volume (K Tons) Forecast, by Application 2020 & 2033
- Table 39: Mexico Low VOC Paint Market Revenue (Million) Forecast, by Application 2020 & 2033
- Table 40: Mexico Low VOC Paint Market Volume (K Tons) Forecast, by Application 2020 & 2033
- Table 41: Global Low VOC Paint Market Revenue Million Forecast, by Type 2020 & 2033
- Table 42: Global Low VOC Paint Market Volume K Tons Forecast, by Type 2020 & 2033
- Table 43: Global Low VOC Paint Market Revenue Million Forecast, by Formulation Type 2020 & 2033
- Table 44: Global Low VOC Paint Market Volume K Tons Forecast, by Formulation Type 2020 & 2033
- Table 45: Global Low VOC Paint Market Revenue Million Forecast, by Application 2020 & 2033
- Table 46: Global Low VOC Paint Market Volume K Tons Forecast, by Application 2020 & 2033
- Table 47: Global Low VOC Paint Market Revenue Million Forecast, by Country 2020 & 2033
- Table 48: Global Low VOC Paint Market Volume K Tons Forecast, by Country 2020 & 2033
- Table 49: Germany Low VOC Paint Market Revenue (Million) Forecast, by Application 2020 & 2033
- Table 50: Germany Low VOC Paint Market Volume (K Tons) Forecast, by Application 2020 & 2033
- Table 51: United Kingdom Low VOC Paint Market Revenue (Million) Forecast, by Application 2020 & 2033
- Table 52: United Kingdom Low VOC Paint Market Volume (K Tons) Forecast, by Application 2020 & 2033
- Table 53: France Low VOC Paint Market Revenue (Million) Forecast, by Application 2020 & 2033
- Table 54: France Low VOC Paint Market Volume (K Tons) Forecast, by Application 2020 & 2033
- Table 55: Italy Low VOC Paint Market Revenue (Million) Forecast, by Application 2020 & 2033
- Table 56: Italy Low VOC Paint Market Volume (K Tons) Forecast, by Application 2020 & 2033
- Table 57: Rest of Europe Low VOC Paint Market Revenue (Million) Forecast, by Application 2020 & 2033
- Table 58: Rest of Europe Low VOC Paint Market Volume (K Tons) Forecast, by Application 2020 & 2033
- Table 59: Global Low VOC Paint Market Revenue Million Forecast, by Type 2020 & 2033
- Table 60: Global Low VOC Paint Market Volume K Tons Forecast, by Type 2020 & 2033
- Table 61: Global Low VOC Paint Market Revenue Million Forecast, by Formulation Type 2020 & 2033
- Table 62: Global Low VOC Paint Market Volume K Tons Forecast, by Formulation Type 2020 & 2033
- Table 63: Global Low VOC Paint Market Revenue Million Forecast, by Application 2020 & 2033
- Table 64: Global Low VOC Paint Market Volume K Tons Forecast, by Application 2020 & 2033
- Table 65: Global Low VOC Paint Market Revenue Million Forecast, by Country 2020 & 2033
- Table 66: Global Low VOC Paint Market Volume K Tons Forecast, by Country 2020 & 2033
- Table 67: Brazil Low VOC Paint Market Revenue (Million) Forecast, by Application 2020 & 2033
- Table 68: Brazil Low VOC Paint Market Volume (K Tons) Forecast, by Application 2020 & 2033
- Table 69: Argentina Low VOC Paint Market Revenue (Million) Forecast, by Application 2020 & 2033
- Table 70: Argentina Low VOC Paint Market Volume (K Tons) Forecast, by Application 2020 & 2033
- Table 71: Rest of South America Low VOC Paint Market Revenue (Million) Forecast, by Application 2020 & 2033
- Table 72: Rest of South America Low VOC Paint Market Volume (K Tons) Forecast, by Application 2020 & 2033
- Table 73: Global Low VOC Paint Market Revenue Million Forecast, by Type 2020 & 2033
- Table 74: Global Low VOC Paint Market Volume K Tons Forecast, by Type 2020 & 2033
- Table 75: Global Low VOC Paint Market Revenue Million Forecast, by Formulation Type 2020 & 2033
- Table 76: Global Low VOC Paint Market Volume K Tons Forecast, by Formulation Type 2020 & 2033
- Table 77: Global Low VOC Paint Market Revenue Million Forecast, by Application 2020 & 2033
- Table 78: Global Low VOC Paint Market Volume K Tons Forecast, by Application 2020 & 2033
- Table 79: Global Low VOC Paint Market Revenue Million Forecast, by Country 2020 & 2033
- Table 80: Global Low VOC Paint Market Volume K Tons Forecast, by Country 2020 & 2033
- Table 81: Saudi Arabia Low VOC Paint Market Revenue (Million) Forecast, by Application 2020 & 2033
- Table 82: Saudi Arabia Low VOC Paint Market Volume (K Tons) Forecast, by Application 2020 & 2033
- Table 83: South Africa Low VOC Paint Market Revenue (Million) Forecast, by Application 2020 & 2033
- Table 84: South Africa Low VOC Paint Market Volume (K Tons) Forecast, by Application 2020 & 2033
- Table 85: Rest of Middle East and Africa Low VOC Paint Market Revenue (Million) Forecast, by Application 2020 & 2033
- Table 86: Rest of Middle East and Africa Low VOC Paint Market Volume (K Tons) Forecast, by Application 2020 & 2033
Frequently Asked Questions
1. What is the projected Compound Annual Growth Rate (CAGR) of the Low VOC Paint Market?
The projected CAGR is approximately > 5.60%.
2. Which companies are prominent players in the Low VOC Paint Market?
Key companies in the market include The Sherwin-Williams Company*List Not Exhaustive, Arkema, Jotun, Berger Paints India Limited, AURO, American Formulating & Manufacturing, PPG Industries Inc, Benjamin Moore & Co, Nippon Paint Holdings Co Ltd, BASF SE, Cloverdale Paint Inc, Kalekim, Akzo Nobel N V, BioShield Paint Company, Crown Trade, Axalta Coating Systems LLC, Asian Paints, Kansai Paint Co Ltd, Fine Paints of Europe.
3. What are the main segments of the Low VOC Paint Market?
The market segments include Type, Formulation Type, Application.
4. Can you provide details about the market size?
The market size is estimated to be USD 8.84 Million as of 2022.
5. What are some drivers contributing to market growth?
Increasing Awareness about Harmful Effects of Conventional Paint4.1.2 increasing Demand in Architectural and Decorative Industry; Other Drivers.
6. What are the notable trends driving market growth?
Architectural and Decorative Segment to Dominate the Market.
7. Are there any restraints impacting market growth?
High Cost in Comparison to Conventional Paint; Other Restraints.
8. Can you provide examples of recent developments in the market?
N/A
9. What pricing options are available for accessing the report?
Pricing options include single-user, multi-user, and enterprise licenses priced at USD 4750, USD 5250, and USD 8750 respectively.
10. Is the market size provided in terms of value or volume?
The market size is provided in terms of value, measured in Million and volume, measured in K Tons.
11. Are there any specific market keywords associated with the report?
Yes, the market keyword associated with the report is "Low VOC Paint Market," which aids in identifying and referencing the specific market segment covered.
12. How do I determine which pricing option suits my needs best?
The pricing options vary based on user requirements and access needs. Individual users may opt for single-user licenses, while businesses requiring broader access may choose multi-user or enterprise licenses for cost-effective access to the report.
13. Are there any additional resources or data provided in the Low VOC Paint Market report?
While the report offers comprehensive insights, it's advisable to review the specific contents or supplementary materials provided to ascertain if additional resources or data are available.
14. How can I stay updated on further developments or reports in the Low VOC Paint Market?
To stay informed about further developments, trends, and reports in the Low VOC Paint Market, consider subscribing to industry newsletters, following relevant companies and organizations, or regularly checking reputable industry news sources and publications.
Methodology
Step 1 - Identification of Relevant Samples Size from Population Database


Step 2 - Approaches for Defining Global Market Size (Value, Volume* & Price*)

Note*: In applicable scenarios
Step 3 - Data Sources
Primary Research
- Web Analytics
- Survey Reports
- Research Institute
- Latest Research Reports
- Opinion Leaders
Secondary Research
- Annual Reports
- White Paper
- Latest Press Release
- Industry Association
- Paid Database
- Investor Presentations

Step 4 - Data Triangulation
Involves using different sources of information in order to increase the validity of a study
These sources are likely to be stakeholders in a program - participants, other researchers, program staff, other community members, and so on.
Then we put all data in single framework & apply various statistical tools to find out the dynamic on the market.
During the analysis stage, feedback from the stakeholder groups would be compared to determine areas of agreement as well as areas of divergence