

Key Insights
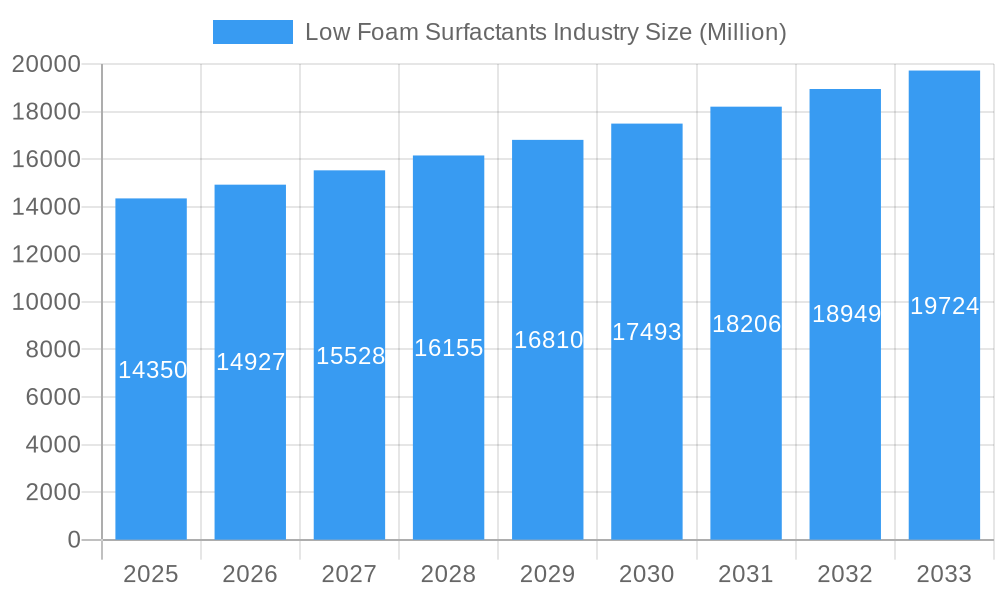
The global low foam surfactants market, valued at $14.35 billion in 2025, is projected to experience robust growth, exhibiting a Compound Annual Growth Rate (CAGR) exceeding 4.00% from 2025 to 2033. This expansion is driven by several key factors. Firstly, the increasing demand for efficient and environmentally friendly cleaning solutions across diverse industries, including agrochemicals, detergents, and food processing, fuels market growth. The rising adoption of low-foam surfactants in these sectors stems from their superior cleaning performance with minimal foaming, crucial for applications requiring precise control of foam formation. Secondly, stringent environmental regulations promoting the use of biodegradable and less-toxic surfactants are further propelling market expansion. This is particularly evident in the detergents and cleaning agents segment, where manufacturers are increasingly incorporating low-foam surfactants to meet evolving consumer preferences and regulatory standards. Finally, continuous innovations in surfactant chemistry are leading to the development of high-performance, specialized low-foam surfactants catering to niche applications, such as oilfield chemicals and metal cleaning.
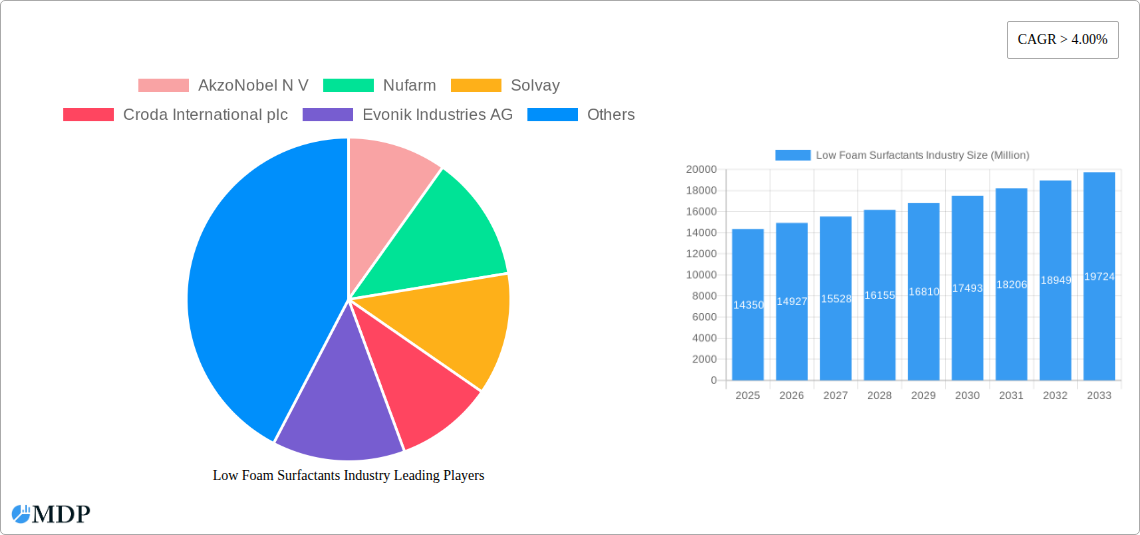
Low Foam Surfactants Industry Market Size (In Billion)
The market segmentation reveals a diverse landscape. Amphoteric, cationic, and non-ionic surfactants represent the major types, each catering to specific application needs. Geographically, the Asia-Pacific region, driven by strong growth in China and India, is expected to dominate the market. North America and Europe will also contribute significantly, owing to the established presence of key players and increasing demand across various sectors. However, the market faces certain restraints including price volatility of raw materials and potential supply chain disruptions. Nevertheless, ongoing research and development efforts focused on enhancing surfactant performance and sustainability, coupled with increasing industry demand, are poised to mitigate these challenges and sustain the market's positive growth trajectory. Leading players like AkzoNobel, Solvay, BASF, and Huntsman are strategically positioned to capitalize on these opportunities, through innovation, expansion, and strategic partnerships.
Low Foam Surfactants Industry Company Market Share
Low Foam Surfactants Market Report: 2019-2033
This comprehensive report provides an in-depth analysis of the global low foam surfactants market, offering invaluable insights for industry stakeholders, investors, and strategic decision-makers. With a study period spanning 2019-2033, a base year of 2025, and a forecast period of 2025-2033, this report unveils the market's dynamics, trends, and future potential. The market is segmented by type (Amphoteric, Cationic, Non-ionic) and end-user industry (Agrochemicals, Food and Dairy Process Cleaners, Detergents and Cleaning Agents, Pulp and Paper, Metal Cleaning and Metal Working Fluids, Oilfield Chemicals, Others), providing a granular understanding of this crucial sector. The report's detailed analysis incorporates data on key players like AkzoNobel N V, Nufarm, Solvay, Croda International plc, Evonik Industries AG, BASF SE, Huntsman International LLC, Dow, KAO CORPORATION, Oxiteno SA, Stepan Company, Clariant AG, and others, offering a complete picture of the competitive landscape. The market size is projected to reach xx Million by 2033.
Low Foam Surfactants Industry Market Dynamics & Concentration
The global low foam surfactants market is characterized by moderate concentration, with several major players holding significant market share. Market share data for 2024 indicates that the top 5 companies hold approximately xx% of the market. However, the market exhibits considerable dynamism, driven by continuous innovation in surfactant technology and formulations. Stringent regulatory frameworks concerning environmental sustainability and product safety are also shaping market dynamics. Furthermore, the emergence of bio-based and sustainable surfactants is disrupting the traditional market landscape. The increasing demand for eco-friendly cleaning and processing solutions across various industries is further fueling market growth. Mergers and acquisitions (M&A) activities have played a role in market consolidation, with approximately xx M&A deals recorded between 2019 and 2024. These deals primarily aimed at expanding product portfolios, accessing new markets, and strengthening technological capabilities. Product substitution is another factor influencing market dynamics, with bio-based surfactants gaining traction as alternatives to conventional petrochemical-based counterparts.
- Market Concentration: Moderately concentrated, top 5 players hold approximately xx% of the market share (2024).
- Innovation Drivers: Sustainable surfactants, improved performance characteristics, and cost optimization.
- Regulatory Frameworks: Stringent environmental regulations impacting product formulations and manufacturing processes.
- Product Substitutes: Bio-based surfactants are emerging as viable alternatives.
- End-User Trends: Growing demand for eco-friendly and high-performance cleaning solutions.
- M&A Activities: Approximately xx M&A deals recorded between 2019 and 2024.
Low Foam Surfactants Industry Industry Trends & Analysis
The low foam surfactants market is experiencing robust growth, driven by several key factors. The rising demand for specialized cleaning and processing solutions across various end-use industries is a primary growth driver. Technological advancements in surfactant chemistry have led to the development of high-performance, environmentally friendly products, further fueling market expansion. The increasing consumer preference for sustainable and biodegradable products is also shaping market trends. Furthermore, the competitive landscape is dynamic, with companies continuously investing in research and development to enhance product offerings and expand market share. The market is anticipated to witness a CAGR of xx% during the forecast period (2025-2033), reaching xx Million by 2033. Market penetration of bio-based surfactants is expected to increase significantly, reaching xx% by 2033. Competitive dynamics are intense, with companies focusing on strategic collaborations, product diversification, and capacity expansion to maintain their market positions.
Leading Markets & Segments in Low Foam Surfactants Industry
The Detergents and Cleaning Agents segment currently dominates the low foam surfactants market, followed by the Agrochemicals and Pulp and Paper sectors. This dominance is primarily attributed to high volume consumption and strong growth prospects in these industries. The Non-ionic segment holds the largest market share amongst the different types, due to its versatile applications and cost-effectiveness.
Key Drivers by Segment:
- Detergents and Cleaning Agents: Growing demand for effective, eco-friendly cleaning products in households and commercial settings.
- Agrochemicals: Increasing demand for crop protection and improved agricultural practices.
- Pulp and Paper: Need for efficient and environmentally sound processing solutions.
- Non-ionic Surfactants: Cost-effectiveness, versatile applications, and compatibility with other chemicals.
Regional Dominance: (Detailed analysis will follow with specific data based on geographic market research data.)
Low Foam Surfactants Industry Product Developments
Recent product innovations in the low foam surfactants market focus on enhancing product performance, sustainability, and biodegradability. Companies are developing high-performance surfactants with improved cleaning efficiency, reduced environmental impact, and broader application versatility. Technological advancements such as nanotechnology and biotechnology are driving the development of novel surfactant formulations. These innovations cater to the growing demand for environmentally friendly and sustainable solutions in various end-use industries. This focus on eco-conscious product development strengthens the market's competitive edge.
Key Drivers of Low Foam Surfactants Industry Growth
The growth of the low foam surfactants market is propelled by several factors, including:
- Technological advancements: Development of novel, high-performance surfactant formulations with improved sustainability.
- Economic growth: Increased industrial activity and consumer spending are driving demand in several end-use sectors.
- Stringent environmental regulations: The focus on eco-friendly solutions is driving innovation and adoption of sustainable surfactants.
Challenges in the Low Foam Surfactants Industry Market
The low foam surfactants market faces challenges such as:
- Fluctuating raw material prices: Impacts the profitability of manufacturers.
- Stringent regulatory compliance: Requires significant investment in research and development.
- Intense competition: Forces companies to constantly innovate and differentiate their products.
Emerging Opportunities in Low Foam Surfactants Industry
Significant long-term growth opportunities exist in the low foam surfactants market. Strategic partnerships and collaborations are enabling companies to gain access to new technologies and expand their market reach. Technological breakthroughs in bio-based surfactant development and nanotechnology are creating novel application possibilities. Furthermore, the growing focus on sustainable and environmentally friendly products presents a significant market expansion opportunity.
Leading Players in the Low Foam Surfactants Industry Sector
- AkzoNobel N V
- Nufarm
- Solvay
- Croda International plc
- Evonik Industries AG
- BASF SE
- Huntsman International LLC
- Dow
- KAO CORPORATION
- Oxiteno SA
- Stepan Company
- Clariant AG
Key Milestones in Low Foam Surfactants Industry Industry
- April 2022: BASF SE announced the expansion of a new line of products, such as Dehypound M and Dehypound HDG. These high-performance nonionic surfactant blends are used for multi-soil, multi-application cleaning, and degreasing. This expansion strengthened BASF's position in the high-performance cleaning segment.
- February 2022: Clariant launched a 100% bio-based surfactant range, driving the transition toward renewable carbon. The development of bio-based surfactants helped Clariant expand its sustainable product portfolio globally, enhancing its competitive advantage.
Strategic Outlook for Low Foam Surfactants Industry Market
The low foam surfactants market exhibits strong growth potential, driven by several factors including increasing demand for sustainable solutions, technological innovations, and the expansion of end-use industries. Companies are expected to focus on strategic partnerships, product diversification, and capacity expansion to capitalize on this growth. The adoption of sustainable and biodegradable surfactants will continue to gain momentum, shaping the future of the market. The market is poised for significant growth, with continuous innovation and market expansion expected in the coming years.
Low Foam Surfactants Industry Segmentation
-
1. Type
- 1.1. Amphoteric
- 1.2. Cationic
- 1.3. Non-ionic
-
2. End-user Industry
- 2.1. Agrochemicals
- 2.2. Food and Dairy Process Cleaners
- 2.3. Detergents and Cleaning Agents
- 2.4. Pulp and Paper
- 2.5. Metal Cleaning and Metal Working Fluids
- 2.6. Oilfield Chemicals
- 2.7. Others (Textiles, Personal care, etc.)
Low Foam Surfactants Industry Segmentation By Geography
-
1. Asia Pacific
- 1.1. China
- 1.2. India
- 1.3. Japan
- 1.4. South Korea
- 1.5. Rest of Asia Pacific
-
2. North America
- 2.1. United States
- 2.2. Canada
- 2.3. Mexico
-
3. Europe
- 3.1. Germany
- 3.2. United Kingdom
- 3.3. Italy
- 3.4. France
- 3.5. Rest of Europe
-
4. South America
- 4.1. Brazil
- 4.2. Argentina
- 4.3. Rest of South America
-
5. Middle East and Africa
- 5.1. Saudi Arabia
- 5.2. South Africa
- 5.3. Rest of Middle East and Africa
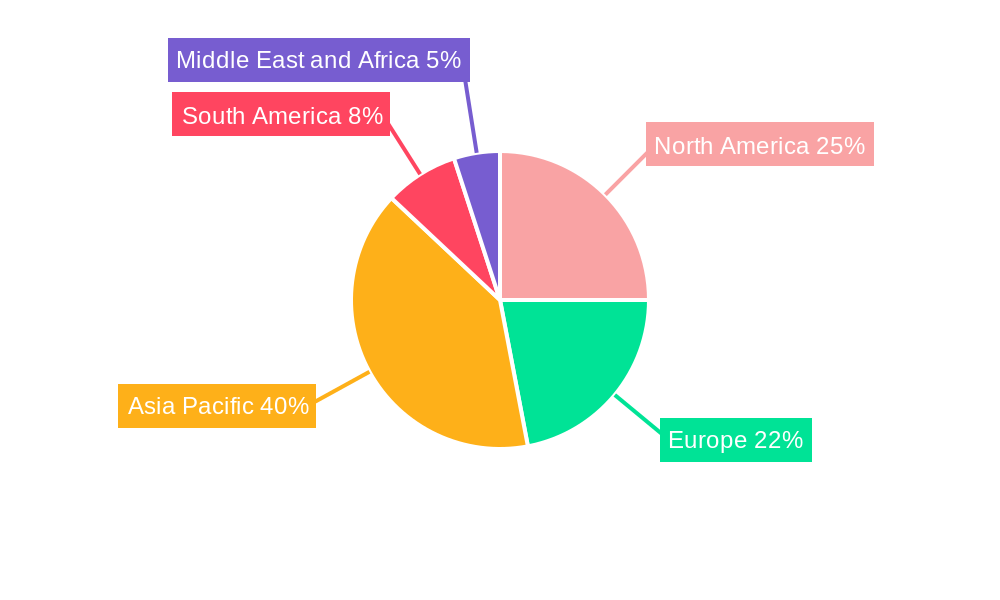
Low Foam Surfactants Industry Regional Market Share
Geographic Coverage of Low Foam Surfactants Industry
Low Foam Surfactants Industry REPORT HIGHLIGHTS
| Aspects | Details |
|---|---|
| Study Period | 2020-2034 |
| Base Year | 2025 |
| Estimated Year | 2026 |
| Forecast Period | 2026-2034 |
| Historical Period | 2020-2025 |
| Growth Rate | CAGR of > 4.00% from 2020-2034 |
| Segmentation |
|
Table of Contents
- 1. Introduction
- 1.1. Research Scope
- 1.2. Market Segmentation
- 1.3. Research Objective
- 1.4. Definitions and Assumptions
- 2. Executive Summary
- 2.1. Market Snapshot
- 3. Market Dynamics
- 3.1. Market Drivers
- 3.2. Market Restrains
- 3.3. Market Trends
- 3.4. Market Opportunities
- 4. Market Factor Analysis
- 4.1. Porters Five Forces
- 4.1.1. Bargaining Power of Suppliers
- 4.1.2. Bargaining Power of Buyers
- 4.1.3. Threat of New Entrants
- 4.1.4. Threat of Substitutes
- 4.1.5. Competitive Rivalry
- 4.2. PESTEL analysis
- 4.3. BCG Analysis
- 4.3.1. Stars (High Growth, High Market Share)
- 4.3.2. Cash Cows (Low Growth, High Market Share)
- 4.3.3. Question Mark (High Growth, Low Market Share)
- 4.3.4. Dogs (Low Growth, Low Market Share)
- 4.4. Ansoff Matrix Analysis
- 4.5. Supply Chain Analysis
- 4.6. Regulatory Landscape
- 4.7. Current Market Potential and Opportunity Assessment (TAM–SAM–SOM Framework)
- 4.8. MDP Analyst Note
- 4.1. Porters Five Forces
- 5. Market Analysis, Insights and Forecast 2021-2033
- 5.1. Market Analysis, Insights and Forecast - by Type
- 5.1.1. Amphoteric
- 5.1.2. Cationic
- 5.1.3. Non-ionic
- 5.2. Market Analysis, Insights and Forecast - by End-user Industry
- 5.2.1. Agrochemicals
- 5.2.2. Food and Dairy Process Cleaners
- 5.2.3. Detergents and Cleaning Agents
- 5.2.4. Pulp and Paper
- 5.2.5. Metal Cleaning and Metal Working Fluids
- 5.2.6. Oilfield Chemicals
- 5.2.7. Others (Textiles, Personal care, etc.)
- 5.3. Market Analysis, Insights and Forecast - by Region
- 5.3.1. Asia Pacific
- 5.3.2. North America
- 5.3.3. Europe
- 5.3.4. South America
- 5.3.5. Middle East and Africa
- 5.1. Market Analysis, Insights and Forecast - by Type
- 6. Global Low Foam Surfactants Industry Analysis, Insights and Forecast, 2021-2033
- 6.1. Market Analysis, Insights and Forecast - by Type
- 6.1.1. Amphoteric
- 6.1.2. Cationic
- 6.1.3. Non-ionic
- 6.2. Market Analysis, Insights and Forecast - by End-user Industry
- 6.2.1. Agrochemicals
- 6.2.2. Food and Dairy Process Cleaners
- 6.2.3. Detergents and Cleaning Agents
- 6.2.4. Pulp and Paper
- 6.2.5. Metal Cleaning and Metal Working Fluids
- 6.2.6. Oilfield Chemicals
- 6.2.7. Others (Textiles, Personal care, etc.)
- 6.1. Market Analysis, Insights and Forecast - by Type
- 7. Asia Pacific Low Foam Surfactants Industry Analysis, Insights and Forecast, 2020-2032
- 7.1. Market Analysis, Insights and Forecast - by Type
- 7.1.1. Amphoteric
- 7.1.2. Cationic
- 7.1.3. Non-ionic
- 7.2. Market Analysis, Insights and Forecast - by End-user Industry
- 7.2.1. Agrochemicals
- 7.2.2. Food and Dairy Process Cleaners
- 7.2.3. Detergents and Cleaning Agents
- 7.2.4. Pulp and Paper
- 7.2.5. Metal Cleaning and Metal Working Fluids
- 7.2.6. Oilfield Chemicals
- 7.2.7. Others (Textiles, Personal care, etc.)
- 7.1. Market Analysis, Insights and Forecast - by Type
- 8. North America Low Foam Surfactants Industry Analysis, Insights and Forecast, 2020-2032
- 8.1. Market Analysis, Insights and Forecast - by Type
- 8.1.1. Amphoteric
- 8.1.2. Cationic
- 8.1.3. Non-ionic
- 8.2. Market Analysis, Insights and Forecast - by End-user Industry
- 8.2.1. Agrochemicals
- 8.2.2. Food and Dairy Process Cleaners
- 8.2.3. Detergents and Cleaning Agents
- 8.2.4. Pulp and Paper
- 8.2.5. Metal Cleaning and Metal Working Fluids
- 8.2.6. Oilfield Chemicals
- 8.2.7. Others (Textiles, Personal care, etc.)
- 8.1. Market Analysis, Insights and Forecast - by Type
- 9. Europe Low Foam Surfactants Industry Analysis, Insights and Forecast, 2020-2032
- 9.1. Market Analysis, Insights and Forecast - by Type
- 9.1.1. Amphoteric
- 9.1.2. Cationic
- 9.1.3. Non-ionic
- 9.2. Market Analysis, Insights and Forecast - by End-user Industry
- 9.2.1. Agrochemicals
- 9.2.2. Food and Dairy Process Cleaners
- 9.2.3. Detergents and Cleaning Agents
- 9.2.4. Pulp and Paper
- 9.2.5. Metal Cleaning and Metal Working Fluids
- 9.2.6. Oilfield Chemicals
- 9.2.7. Others (Textiles, Personal care, etc.)
- 9.1. Market Analysis, Insights and Forecast - by Type
- 10. South America Low Foam Surfactants Industry Analysis, Insights and Forecast, 2020-2032
- 10.1. Market Analysis, Insights and Forecast - by Type
- 10.1.1. Amphoteric
- 10.1.2. Cationic
- 10.1.3. Non-ionic
- 10.2. Market Analysis, Insights and Forecast - by End-user Industry
- 10.2.1. Agrochemicals
- 10.2.2. Food and Dairy Process Cleaners
- 10.2.3. Detergents and Cleaning Agents
- 10.2.4. Pulp and Paper
- 10.2.5. Metal Cleaning and Metal Working Fluids
- 10.2.6. Oilfield Chemicals
- 10.2.7. Others (Textiles, Personal care, etc.)
- 10.1. Market Analysis, Insights and Forecast - by Type
- 11. Middle East and Africa Low Foam Surfactants Industry Analysis, Insights and Forecast, 2020-2032
- 11.1. Market Analysis, Insights and Forecast - by Type
- 11.1.1. Amphoteric
- 11.1.2. Cationic
- 11.1.3. Non-ionic
- 11.2. Market Analysis, Insights and Forecast - by End-user Industry
- 11.2.1. Agrochemicals
- 11.2.2. Food and Dairy Process Cleaners
- 11.2.3. Detergents and Cleaning Agents
- 11.2.4. Pulp and Paper
- 11.2.5. Metal Cleaning and Metal Working Fluids
- 11.2.6. Oilfield Chemicals
- 11.2.7. Others (Textiles, Personal care, etc.)
- 11.1. Market Analysis, Insights and Forecast - by Type
- 12. Competitive Analysis
- 12.1. Company Profiles
- 12.1.1 AkzoNobel N V
- 12.1.1.1. Company Overview
- 12.1.1.2. Products
- 12.1.1.3. Company Financials
- 12.1.1.4. SWOT Analysis
- 12.1.2 Nufarm
- 12.1.2.1. Company Overview
- 12.1.2.2. Products
- 12.1.2.3. Company Financials
- 12.1.2.4. SWOT Analysis
- 12.1.3 Solvay
- 12.1.3.1. Company Overview
- 12.1.3.2. Products
- 12.1.3.3. Company Financials
- 12.1.3.4. SWOT Analysis
- 12.1.4 Croda International plc
- 12.1.4.1. Company Overview
- 12.1.4.2. Products
- 12.1.4.3. Company Financials
- 12.1.4.4. SWOT Analysis
- 12.1.5 Evonik Industries AG
- 12.1.5.1. Company Overview
- 12.1.5.2. Products
- 12.1.5.3. Company Financials
- 12.1.5.4. SWOT Analysis
- 12.1.6 BASF SE
- 12.1.6.1. Company Overview
- 12.1.6.2. Products
- 12.1.6.3. Company Financials
- 12.1.6.4. SWOT Analysis
- 12.1.7 Huntsman International LLC
- 12.1.7.1. Company Overview
- 12.1.7.2. Products
- 12.1.7.3. Company Financials
- 12.1.7.4. SWOT Analysis
- 12.1.8 Dow
- 12.1.8.1. Company Overview
- 12.1.8.2. Products
- 12.1.8.3. Company Financials
- 12.1.8.4. SWOT Analysis
- 12.1.9 KAO CORPORATION
- 12.1.9.1. Company Overview
- 12.1.9.2. Products
- 12.1.9.3. Company Financials
- 12.1.9.4. SWOT Analysis
- 12.1.10 Oxiteno SA
- 12.1.10.1. Company Overview
- 12.1.10.2. Products
- 12.1.10.3. Company Financials
- 12.1.10.4. SWOT Analysis
- 12.1.11 Stepan Company*List Not Exhaustive
- 12.1.11.1. Company Overview
- 12.1.11.2. Products
- 12.1.11.3. Company Financials
- 12.1.11.4. SWOT Analysis
- 12.1.12 Clariant AG
- 12.1.12.1. Company Overview
- 12.1.12.2. Products
- 12.1.12.3. Company Financials
- 12.1.12.4. SWOT Analysis
- 12.1.1 AkzoNobel N V
- 12.2. Market Entropy
- 12.2.1 Company's Key Areas Served
- 12.2.2 Recent Developments
- 12.3. Company Market Share Analysis 2025
- 12.3.1 Top 5 Companies Market Share Analysis
- 12.3.2 Top 3 Companies Market Share Analysis
- 12.4. List of Potential Customers
- 13. Research Methodology
List of Figures
- Figure 1: Global Low Foam Surfactants Industry Revenue Breakdown (Million, %) by Region 2025 & 2033
- Figure 2: Global Low Foam Surfactants Industry Volume Breakdown (liter , %) by Region 2025 & 2033
- Figure 3: Asia Pacific Low Foam Surfactants Industry Revenue (Million), by Type 2025 & 2033
- Figure 4: Asia Pacific Low Foam Surfactants Industry Volume (liter ), by Type 2025 & 2033
- Figure 5: Asia Pacific Low Foam Surfactants Industry Revenue Share (%), by Type 2025 & 2033
- Figure 6: Asia Pacific Low Foam Surfactants Industry Volume Share (%), by Type 2025 & 2033
- Figure 7: Asia Pacific Low Foam Surfactants Industry Revenue (Million), by End-user Industry 2025 & 2033
- Figure 8: Asia Pacific Low Foam Surfactants Industry Volume (liter ), by End-user Industry 2025 & 2033
- Figure 9: Asia Pacific Low Foam Surfactants Industry Revenue Share (%), by End-user Industry 2025 & 2033
- Figure 10: Asia Pacific Low Foam Surfactants Industry Volume Share (%), by End-user Industry 2025 & 2033
- Figure 11: Asia Pacific Low Foam Surfactants Industry Revenue (Million), by Country 2025 & 2033
- Figure 12: Asia Pacific Low Foam Surfactants Industry Volume (liter ), by Country 2025 & 2033
- Figure 13: Asia Pacific Low Foam Surfactants Industry Revenue Share (%), by Country 2025 & 2033
- Figure 14: Asia Pacific Low Foam Surfactants Industry Volume Share (%), by Country 2025 & 2033
- Figure 15: North America Low Foam Surfactants Industry Revenue (Million), by Type 2025 & 2033
- Figure 16: North America Low Foam Surfactants Industry Volume (liter ), by Type 2025 & 2033
- Figure 17: North America Low Foam Surfactants Industry Revenue Share (%), by Type 2025 & 2033
- Figure 18: North America Low Foam Surfactants Industry Volume Share (%), by Type 2025 & 2033
- Figure 19: North America Low Foam Surfactants Industry Revenue (Million), by End-user Industry 2025 & 2033
- Figure 20: North America Low Foam Surfactants Industry Volume (liter ), by End-user Industry 2025 & 2033
- Figure 21: North America Low Foam Surfactants Industry Revenue Share (%), by End-user Industry 2025 & 2033
- Figure 22: North America Low Foam Surfactants Industry Volume Share (%), by End-user Industry 2025 & 2033
- Figure 23: North America Low Foam Surfactants Industry Revenue (Million), by Country 2025 & 2033
- Figure 24: North America Low Foam Surfactants Industry Volume (liter ), by Country 2025 & 2033
- Figure 25: North America Low Foam Surfactants Industry Revenue Share (%), by Country 2025 & 2033
- Figure 26: North America Low Foam Surfactants Industry Volume Share (%), by Country 2025 & 2033
- Figure 27: Europe Low Foam Surfactants Industry Revenue (Million), by Type 2025 & 2033
- Figure 28: Europe Low Foam Surfactants Industry Volume (liter ), by Type 2025 & 2033
- Figure 29: Europe Low Foam Surfactants Industry Revenue Share (%), by Type 2025 & 2033
- Figure 30: Europe Low Foam Surfactants Industry Volume Share (%), by Type 2025 & 2033
- Figure 31: Europe Low Foam Surfactants Industry Revenue (Million), by End-user Industry 2025 & 2033
- Figure 32: Europe Low Foam Surfactants Industry Volume (liter ), by End-user Industry 2025 & 2033
- Figure 33: Europe Low Foam Surfactants Industry Revenue Share (%), by End-user Industry 2025 & 2033
- Figure 34: Europe Low Foam Surfactants Industry Volume Share (%), by End-user Industry 2025 & 2033
- Figure 35: Europe Low Foam Surfactants Industry Revenue (Million), by Country 2025 & 2033
- Figure 36: Europe Low Foam Surfactants Industry Volume (liter ), by Country 2025 & 2033
- Figure 37: Europe Low Foam Surfactants Industry Revenue Share (%), by Country 2025 & 2033
- Figure 38: Europe Low Foam Surfactants Industry Volume Share (%), by Country 2025 & 2033
- Figure 39: South America Low Foam Surfactants Industry Revenue (Million), by Type 2025 & 2033
- Figure 40: South America Low Foam Surfactants Industry Volume (liter ), by Type 2025 & 2033
- Figure 41: South America Low Foam Surfactants Industry Revenue Share (%), by Type 2025 & 2033
- Figure 42: South America Low Foam Surfactants Industry Volume Share (%), by Type 2025 & 2033
- Figure 43: South America Low Foam Surfactants Industry Revenue (Million), by End-user Industry 2025 & 2033
- Figure 44: South America Low Foam Surfactants Industry Volume (liter ), by End-user Industry 2025 & 2033
- Figure 45: South America Low Foam Surfactants Industry Revenue Share (%), by End-user Industry 2025 & 2033
- Figure 46: South America Low Foam Surfactants Industry Volume Share (%), by End-user Industry 2025 & 2033
- Figure 47: South America Low Foam Surfactants Industry Revenue (Million), by Country 2025 & 2033
- Figure 48: South America Low Foam Surfactants Industry Volume (liter ), by Country 2025 & 2033
- Figure 49: South America Low Foam Surfactants Industry Revenue Share (%), by Country 2025 & 2033
- Figure 50: South America Low Foam Surfactants Industry Volume Share (%), by Country 2025 & 2033
- Figure 51: Middle East and Africa Low Foam Surfactants Industry Revenue (Million), by Type 2025 & 2033
- Figure 52: Middle East and Africa Low Foam Surfactants Industry Volume (liter ), by Type 2025 & 2033
- Figure 53: Middle East and Africa Low Foam Surfactants Industry Revenue Share (%), by Type 2025 & 2033
- Figure 54: Middle East and Africa Low Foam Surfactants Industry Volume Share (%), by Type 2025 & 2033
- Figure 55: Middle East and Africa Low Foam Surfactants Industry Revenue (Million), by End-user Industry 2025 & 2033
- Figure 56: Middle East and Africa Low Foam Surfactants Industry Volume (liter ), by End-user Industry 2025 & 2033
- Figure 57: Middle East and Africa Low Foam Surfactants Industry Revenue Share (%), by End-user Industry 2025 & 2033
- Figure 58: Middle East and Africa Low Foam Surfactants Industry Volume Share (%), by End-user Industry 2025 & 2033
- Figure 59: Middle East and Africa Low Foam Surfactants Industry Revenue (Million), by Country 2025 & 2033
- Figure 60: Middle East and Africa Low Foam Surfactants Industry Volume (liter ), by Country 2025 & 2033
- Figure 61: Middle East and Africa Low Foam Surfactants Industry Revenue Share (%), by Country 2025 & 2033
- Figure 62: Middle East and Africa Low Foam Surfactants Industry Volume Share (%), by Country 2025 & 2033
List of Tables
- Table 1: Global Low Foam Surfactants Industry Revenue Million Forecast, by Type 2020 & 2033
- Table 2: Global Low Foam Surfactants Industry Volume liter Forecast, by Type 2020 & 2033
- Table 3: Global Low Foam Surfactants Industry Revenue Million Forecast, by End-user Industry 2020 & 2033
- Table 4: Global Low Foam Surfactants Industry Volume liter Forecast, by End-user Industry 2020 & 2033
- Table 5: Global Low Foam Surfactants Industry Revenue Million Forecast, by Region 2020 & 2033
- Table 6: Global Low Foam Surfactants Industry Volume liter Forecast, by Region 2020 & 2033
- Table 7: Global Low Foam Surfactants Industry Revenue Million Forecast, by Type 2020 & 2033
- Table 8: Global Low Foam Surfactants Industry Volume liter Forecast, by Type 2020 & 2033
- Table 9: Global Low Foam Surfactants Industry Revenue Million Forecast, by End-user Industry 2020 & 2033
- Table 10: Global Low Foam Surfactants Industry Volume liter Forecast, by End-user Industry 2020 & 2033
- Table 11: Global Low Foam Surfactants Industry Revenue Million Forecast, by Country 2020 & 2033
- Table 12: Global Low Foam Surfactants Industry Volume liter Forecast, by Country 2020 & 2033
- Table 13: China Low Foam Surfactants Industry Revenue (Million) Forecast, by Application 2020 & 2033
- Table 14: China Low Foam Surfactants Industry Volume (liter ) Forecast, by Application 2020 & 2033
- Table 15: India Low Foam Surfactants Industry Revenue (Million) Forecast, by Application 2020 & 2033
- Table 16: India Low Foam Surfactants Industry Volume (liter ) Forecast, by Application 2020 & 2033
- Table 17: Japan Low Foam Surfactants Industry Revenue (Million) Forecast, by Application 2020 & 2033
- Table 18: Japan Low Foam Surfactants Industry Volume (liter ) Forecast, by Application 2020 & 2033
- Table 19: South Korea Low Foam Surfactants Industry Revenue (Million) Forecast, by Application 2020 & 2033
- Table 20: South Korea Low Foam Surfactants Industry Volume (liter ) Forecast, by Application 2020 & 2033
- Table 21: Rest of Asia Pacific Low Foam Surfactants Industry Revenue (Million) Forecast, by Application 2020 & 2033
- Table 22: Rest of Asia Pacific Low Foam Surfactants Industry Volume (liter ) Forecast, by Application 2020 & 2033
- Table 23: Global Low Foam Surfactants Industry Revenue Million Forecast, by Type 2020 & 2033
- Table 24: Global Low Foam Surfactants Industry Volume liter Forecast, by Type 2020 & 2033
- Table 25: Global Low Foam Surfactants Industry Revenue Million Forecast, by End-user Industry 2020 & 2033
- Table 26: Global Low Foam Surfactants Industry Volume liter Forecast, by End-user Industry 2020 & 2033
- Table 27: Global Low Foam Surfactants Industry Revenue Million Forecast, by Country 2020 & 2033
- Table 28: Global Low Foam Surfactants Industry Volume liter Forecast, by Country 2020 & 2033
- Table 29: United States Low Foam Surfactants Industry Revenue (Million) Forecast, by Application 2020 & 2033
- Table 30: United States Low Foam Surfactants Industry Volume (liter ) Forecast, by Application 2020 & 2033
- Table 31: Canada Low Foam Surfactants Industry Revenue (Million) Forecast, by Application 2020 & 2033
- Table 32: Canada Low Foam Surfactants Industry Volume (liter ) Forecast, by Application 2020 & 2033
- Table 33: Mexico Low Foam Surfactants Industry Revenue (Million) Forecast, by Application 2020 & 2033
- Table 34: Mexico Low Foam Surfactants Industry Volume (liter ) Forecast, by Application 2020 & 2033
- Table 35: Global Low Foam Surfactants Industry Revenue Million Forecast, by Type 2020 & 2033
- Table 36: Global Low Foam Surfactants Industry Volume liter Forecast, by Type 2020 & 2033
- Table 37: Global Low Foam Surfactants Industry Revenue Million Forecast, by End-user Industry 2020 & 2033
- Table 38: Global Low Foam Surfactants Industry Volume liter Forecast, by End-user Industry 2020 & 2033
- Table 39: Global Low Foam Surfactants Industry Revenue Million Forecast, by Country 2020 & 2033
- Table 40: Global Low Foam Surfactants Industry Volume liter Forecast, by Country 2020 & 2033
- Table 41: Germany Low Foam Surfactants Industry Revenue (Million) Forecast, by Application 2020 & 2033
- Table 42: Germany Low Foam Surfactants Industry Volume (liter ) Forecast, by Application 2020 & 2033
- Table 43: United Kingdom Low Foam Surfactants Industry Revenue (Million) Forecast, by Application 2020 & 2033
- Table 44: United Kingdom Low Foam Surfactants Industry Volume (liter ) Forecast, by Application 2020 & 2033
- Table 45: Italy Low Foam Surfactants Industry Revenue (Million) Forecast, by Application 2020 & 2033
- Table 46: Italy Low Foam Surfactants Industry Volume (liter ) Forecast, by Application 2020 & 2033
- Table 47: France Low Foam Surfactants Industry Revenue (Million) Forecast, by Application 2020 & 2033
- Table 48: France Low Foam Surfactants Industry Volume (liter ) Forecast, by Application 2020 & 2033
- Table 49: Rest of Europe Low Foam Surfactants Industry Revenue (Million) Forecast, by Application 2020 & 2033
- Table 50: Rest of Europe Low Foam Surfactants Industry Volume (liter ) Forecast, by Application 2020 & 2033
- Table 51: Global Low Foam Surfactants Industry Revenue Million Forecast, by Type 2020 & 2033
- Table 52: Global Low Foam Surfactants Industry Volume liter Forecast, by Type 2020 & 2033
- Table 53: Global Low Foam Surfactants Industry Revenue Million Forecast, by End-user Industry 2020 & 2033
- Table 54: Global Low Foam Surfactants Industry Volume liter Forecast, by End-user Industry 2020 & 2033
- Table 55: Global Low Foam Surfactants Industry Revenue Million Forecast, by Country 2020 & 2033
- Table 56: Global Low Foam Surfactants Industry Volume liter Forecast, by Country 2020 & 2033
- Table 57: Brazil Low Foam Surfactants Industry Revenue (Million) Forecast, by Application 2020 & 2033
- Table 58: Brazil Low Foam Surfactants Industry Volume (liter ) Forecast, by Application 2020 & 2033
- Table 59: Argentina Low Foam Surfactants Industry Revenue (Million) Forecast, by Application 2020 & 2033
- Table 60: Argentina Low Foam Surfactants Industry Volume (liter ) Forecast, by Application 2020 & 2033
- Table 61: Rest of South America Low Foam Surfactants Industry Revenue (Million) Forecast, by Application 2020 & 2033
- Table 62: Rest of South America Low Foam Surfactants Industry Volume (liter ) Forecast, by Application 2020 & 2033
- Table 63: Global Low Foam Surfactants Industry Revenue Million Forecast, by Type 2020 & 2033
- Table 64: Global Low Foam Surfactants Industry Volume liter Forecast, by Type 2020 & 2033
- Table 65: Global Low Foam Surfactants Industry Revenue Million Forecast, by End-user Industry 2020 & 2033
- Table 66: Global Low Foam Surfactants Industry Volume liter Forecast, by End-user Industry 2020 & 2033
- Table 67: Global Low Foam Surfactants Industry Revenue Million Forecast, by Country 2020 & 2033
- Table 68: Global Low Foam Surfactants Industry Volume liter Forecast, by Country 2020 & 2033
- Table 69: Saudi Arabia Low Foam Surfactants Industry Revenue (Million) Forecast, by Application 2020 & 2033
- Table 70: Saudi Arabia Low Foam Surfactants Industry Volume (liter ) Forecast, by Application 2020 & 2033
- Table 71: South Africa Low Foam Surfactants Industry Revenue (Million) Forecast, by Application 2020 & 2033
- Table 72: South Africa Low Foam Surfactants Industry Volume (liter ) Forecast, by Application 2020 & 2033
- Table 73: Rest of Middle East and Africa Low Foam Surfactants Industry Revenue (Million) Forecast, by Application 2020 & 2033
- Table 74: Rest of Middle East and Africa Low Foam Surfactants Industry Volume (liter ) Forecast, by Application 2020 & 2033
Frequently Asked Questions
1. What is the projected Compound Annual Growth Rate (CAGR) of the Low Foam Surfactants Industry?
The projected CAGR is approximately > 4.00%.
2. Which companies are prominent players in the Low Foam Surfactants Industry?
Key companies in the market include AkzoNobel N V, Nufarm, Solvay, Croda International plc, Evonik Industries AG, BASF SE, Huntsman International LLC, Dow, KAO CORPORATION, Oxiteno SA, Stepan Company*List Not Exhaustive, Clariant AG.
3. What are the main segments of the Low Foam Surfactants Industry?
The market segments include Type, End-user Industry.
4. Can you provide details about the market size?
The market size is estimated to be USD 14.35 Million as of 2022.
5. What are some drivers contributing to market growth?
Significant Growth in Detergents and Cleaning Agents; Increased Demand for Sustainable Surfactants; The rising demand for personal care products.
6. What are the notable trends driving market growth?
Detergents and Cleaning Agents End-user Industry Segment to Dominate the Market.
7. Are there any restraints impacting market growth?
The Stringent Enviornmental Regulations; The Availability of Other Substitutes.
8. Can you provide examples of recent developments in the market?
April 2022: BASF SE announced the expansion of a new line of products, such as Dehypound M and Dehypound HDG. These high-performance nonionic surfactant blends are used for multi-soil, multi-application cleaning, and degreasing.
9. What pricing options are available for accessing the report?
Pricing options include single-user, multi-user, and enterprise licenses priced at USD 4750, USD 5250, and USD 8750 respectively.
10. Is the market size provided in terms of value or volume?
The market size is provided in terms of value, measured in Million and volume, measured in liter .
11. Are there any specific market keywords associated with the report?
Yes, the market keyword associated with the report is "Low Foam Surfactants Industry," which aids in identifying and referencing the specific market segment covered.
12. How do I determine which pricing option suits my needs best?
The pricing options vary based on user requirements and access needs. Individual users may opt for single-user licenses, while businesses requiring broader access may choose multi-user or enterprise licenses for cost-effective access to the report.
13. Are there any additional resources or data provided in the Low Foam Surfactants Industry report?
While the report offers comprehensive insights, it's advisable to review the specific contents or supplementary materials provided to ascertain if additional resources or data are available.
14. How can I stay updated on further developments or reports in the Low Foam Surfactants Industry?
To stay informed about further developments, trends, and reports in the Low Foam Surfactants Industry, consider subscribing to industry newsletters, following relevant companies and organizations, or regularly checking reputable industry news sources and publications.
Methodology
Step 1 - Identification of Relevant Samples Size from Population Database


Step 2 - Approaches for Defining Global Market Size (Value, Volume* & Price*)

Note*: In applicable scenarios
Step 3 - Data Sources
Primary Research
- Web Analytics
- Survey Reports
- Research Institute
- Latest Research Reports
- Opinion Leaders
Secondary Research
- Annual Reports
- White Paper
- Latest Press Release
- Industry Association
- Paid Database
- Investor Presentations

Step 4 - Data Triangulation
Involves using different sources of information in order to increase the validity of a study
These sources are likely to be stakeholders in a program - participants, other researchers, program staff, other community members, and so on.
Then we put all data in single framework & apply various statistical tools to find out the dynamic on the market.
During the analysis stage, feedback from the stakeholder groups would be compared to determine areas of agreement as well as areas of divergence