

Key Insights
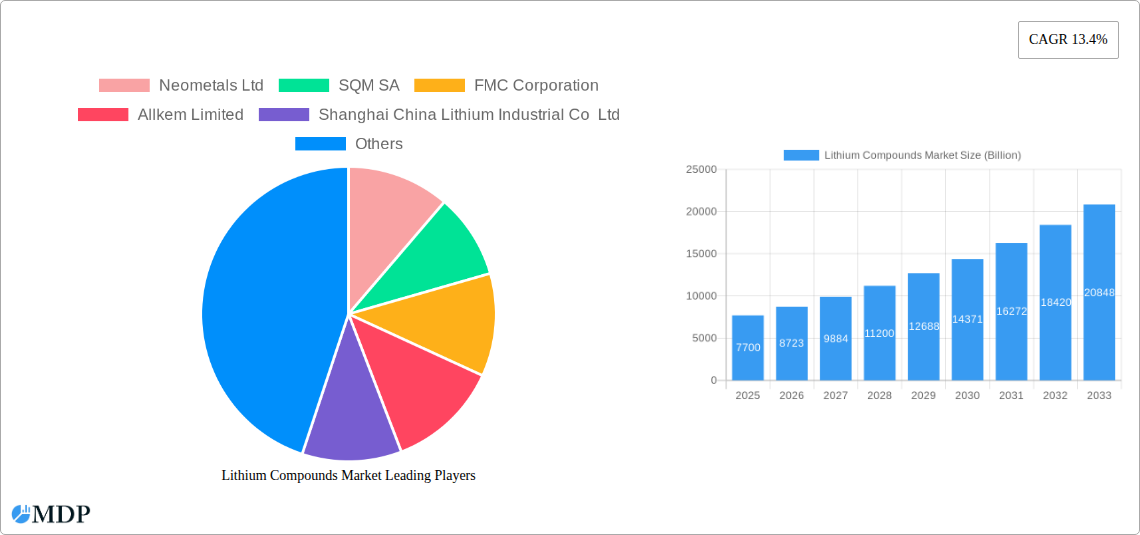
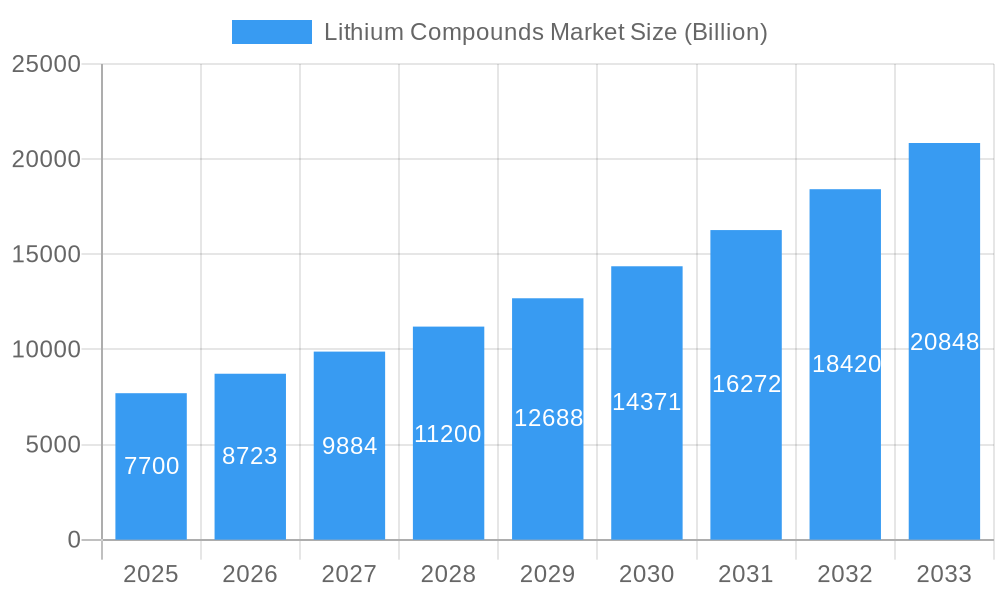
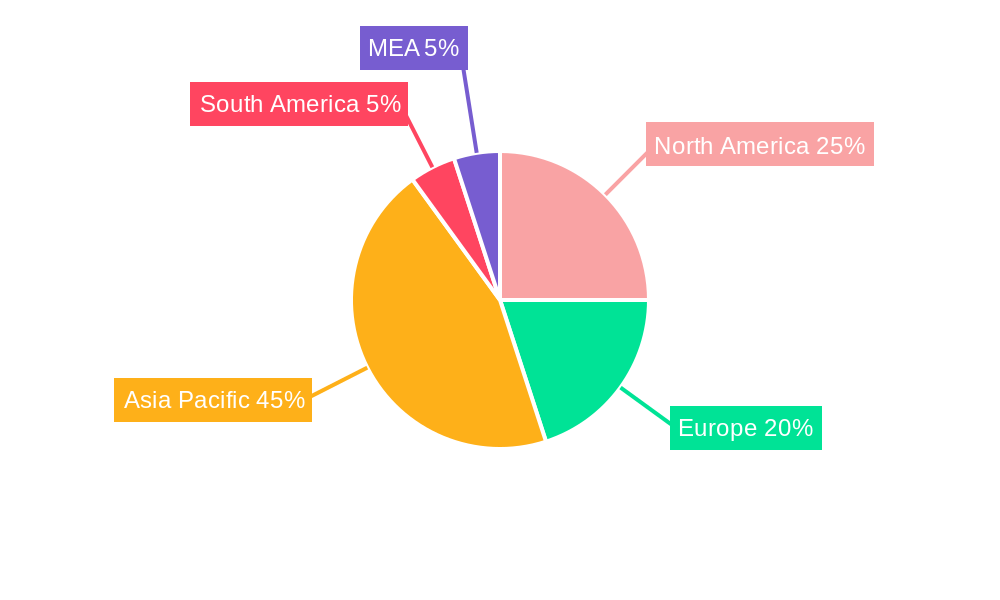
The lithium compounds market, valued at $7.7 billion in 2025, is projected to experience robust growth, driven primarily by the burgeoning electric vehicle (EV) sector's insatiable demand for lithium-ion batteries. This explosive growth is further fueled by the increasing adoption of lithium compounds in various applications, including ceramics and glass manufacturing, lubricants, pharmaceuticals, and metallurgy. The market's Compound Annual Growth Rate (CAGR) of 13.4% from 2025 to 2033 indicates a significant expansion, with substantial opportunities across different geographical regions. While the dominance of Asia-Pacific, particularly China, is expected to continue due to its vast EV manufacturing base and established lithium production capabilities, North America and Europe will also witness significant market expansion driven by supportive government policies promoting clean energy and investments in renewable energy infrastructure. Growth may be slightly moderated by fluctuating lithium prices and concerns regarding the environmental impact of lithium mining, necessitating sustainable sourcing and processing methods. However, ongoing research and development in lithium extraction and battery technology promise to address these challenges and maintain market momentum.
Lithium Compounds Market Market Size (In Billion)
The market segmentation reveals a diversified landscape. Lithium carbonate and lithium hydroxide are projected to dominate the compounds segment, owing to their widespread use in battery manufacturing. Among applications, the battery sector will continue to be the key driver, but growth in other segments, particularly ceramics and glass, is expected due to increasing demand for lightweight and durable materials. Major players like Albemarle Corporation, SQM SA, and FMC Corporation are expected to maintain their leading positions, but increased competition from emerging companies, particularly in Asia, is anticipated. Regional analysis suggests that the Asia-Pacific region will continue its leading role, while North America and Europe will witness considerable growth driven by expanding clean energy initiatives. The market's future trajectory heavily depends on the continued growth of the EV industry, advancements in battery technology, and the implementation of sustainable mining practices.
Lithium Compounds Market Company Market Share
Lithium Compounds Market: A Comprehensive Report (2019-2033)
This comprehensive report provides an in-depth analysis of the global Lithium Compounds market, offering invaluable insights for stakeholders across the value chain. From market dynamics and leading players to future growth opportunities, this report is your essential resource for understanding and navigating this rapidly evolving market projected to reach xx Billion by 2033. The study period covers 2019-2033, with 2025 serving as the base and estimated year.
Lithium Compounds Market Market Dynamics & Concentration
The Lithium Compounds market is characterized by moderate concentration, with several major players holding significant market share. However, the market is witnessing increased competition from new entrants and smaller players, particularly in the battery chemicals segment driven by the burgeoning EV industry. Innovation is a key driver, with companies investing heavily in R&D to develop new and improved lithium compounds for diverse applications. Stringent regulatory frameworks concerning environmental protection and resource management significantly influence the market landscape. Product substitutes, while limited, are emerging, particularly in the battery sector, presenting a challenge to established lithium-based solutions. End-user trends, especially the surging demand for electric vehicles and energy storage solutions, are boosting the overall market.
Market share distribution among leading players varies significantly depending on the compound type and application; however, some companies consistently hold a large percentage. The report details market share for key players, including Albemarle Corporation, SQM SA, and others. Furthermore, the report analyzes the considerable amount of M&A activity in the sector. Over the past few years, the number of M&A deals has significantly increased, driven primarily by the consolidation of upstream and downstream sectors, leading to stronger supply chains and vertical integration. The past five years have witnessed approximately xx M&A deals, with the average deal size exceeding xx Billion.
Lithium Compounds Market Industry Trends & Analysis
The Lithium Compounds market is experiencing robust growth, driven by the exponential increase in demand for lithium-ion batteries. This is propelled by the global shift towards electric vehicles, portable electronics, and renewable energy storage solutions. Technological advancements in battery technology, such as solid-state batteries, are reshaping the market, creating new opportunities and demanding higher-performing lithium compounds. Consumer preferences are increasingly shifting towards eco-friendly and sustainable products, pushing manufacturers to adopt environmentally responsible practices throughout the supply chain. The market's competitive landscape is intensely dynamic, with established players aggressively expanding their production capacity and market share while new entrants are emerging with innovative technologies and business models. The CAGR for the market during the forecast period (2025-2033) is estimated to be xx%, with the market penetration rate expected to reach xx% by 2033.
Leading Markets & Segments in Lithium Compounds Market
Dominant Regions/Segments:
- Application: The battery segment dominates the market, accounting for over xx% of total demand, driven primarily by the growing electric vehicle (EV) industry. The market is also significantly impacted by demand from portable electronics and energy storage systems.
- Compound: Lithium Carbonate and Lithium Hydroxide currently hold the largest market share among the lithium compounds, followed by Lithium Chloride and Butyllithium. These compounds are critical components of lithium-ion batteries.
Key Drivers for Dominant Segments:
- Batteries: Government incentives for EVs, rising concerns about climate change, and advancements in battery technology are driving growth.
- Ceramics and Glass: The increasing demand for lightweight, high-strength materials in various industries is fueling this sector.
Dominance Analysis:
The Asia-Pacific region is currently the leading market for lithium compounds, largely driven by the rapid expansion of the Chinese EV market and the presence of major lithium producers and processors in the region. However, North America and Europe are also witnessing significant growth due to increasing EV adoption and government support for renewable energy.
Lithium Compounds Market Product Developments
Recent product innovations have focused on improving the purity, consistency, and performance of lithium compounds, particularly those used in high-performance batteries. This includes developing new synthesis methods, refining processes, and material characterization techniques to optimize the properties of lithium compounds for specific applications. These developments are aimed at enhancing battery performance, extending their lifespan, and improving safety. Competitive advantages are increasingly derived from cost efficiency, superior product quality, sustainable manufacturing practices, and strong supply chain management.
Key Drivers of Lithium Compounds Market Growth
The Lithium Compounds market's growth is fundamentally driven by the increasing demand for electric vehicles and energy storage systems globally. Technological advancements, such as the development of solid-state batteries, further accelerate demand for higher-performance lithium compounds. Furthermore, supportive government policies aimed at promoting renewable energy and sustainable transportation also contribute to market expansion. Favorable economic conditions in key regions further strengthen market demand. For example, the significant investments by companies like General Motors in lithium mining and processing demonstrate strong market confidence.
Challenges in the Lithium Compounds Market Market
The lithium compounds market faces challenges relating to price volatility, supply chain disruptions, and geopolitical factors affecting lithium sourcing. Environmental concerns regarding lithium mining and processing also pose a challenge, demanding sustainable and environmentally responsible practices. The intensive competition among established and emerging players and potential regulatory changes around lithium sourcing and processing all further influence the overall market dynamics. For instance, xx% of lithium production is concentrated in a few countries, making the market susceptible to supply shocks.
Emerging Opportunities in Lithium Compounds Market
Significant opportunities exist in developing and deploying more sustainable and efficient lithium extraction and processing technologies. The growing demand for lithium-ion batteries for grid-scale energy storage presents a substantial growth avenue. Strategic partnerships and collaborations between lithium producers, battery manufacturers, and technology companies are creating innovative solutions and expanding market reach. Exploration and development of new lithium resources, coupled with technological advancements in battery recycling, are poised to shape the future of the lithium compounds market.
Leading Players in the Lithium Compounds Market Sector
- Neometals Ltd
- SQM SA
- FMC Corporation
- Allkem Limited
- Shanghai China Lithium Industrial Co Ltd
- Sichuan Tianqi Lithium Chemicals Inc
- China Lithium Products Technology Co Ltd
- Lithium Americas Corp
- Albemarle Corporation
Key Milestones in Lithium Compounds Market Industry
- February 2023: Lithium Americas secured a $320M investment from General Motors, accelerating development of the Thacker Pass lithium project.
- September 2022: Lithium Americas collaborated with Green Technology Metals to develop a North American lithium chemicals business.
- March 2022: Neometals' joint venture progressed talks with Mercedes-Benz to build a lithium-ion battery recycling plant.
Strategic Outlook for Lithium Compounds Market Market
The Lithium Compounds market is poised for significant growth, driven by the sustained increase in demand for electric vehicles and energy storage. Strategic investments in research and development, coupled with sustainable and efficient production practices, will be critical for success. Companies focusing on vertical integration, strategic partnerships, and geographic diversification will be well-positioned to capitalize on emerging opportunities. The long-term outlook is extremely positive, with continued growth expected across all major segments and regions.
Lithium Compounds Market Segmentation
-
1. Compounds
- 1.1. Lithium Nitride
- 1.2. Lithium Metal
- 1.3. Lithium Carbonate
- 1.4. Lithium Hydroxide
- 1.5. Lithium Chloride
- 1.6. Butyllithium
- 1.7. Other Compounds
-
2. Application
- 2.1. Ceramics and Glass
- 2.2. Lubricants
- 2.3. Pharmaceuticals
- 2.4. Batteries
- 2.5. Chemicals
- 2.6. Metallurgy
- 2.7. Other Applications
Lithium Compounds Market Segmentation By Geography
-
1. Asia Pacific
- 1.1. China
- 1.2. India
- 1.3. Japan
- 1.4. South Korea
- 1.5. Rest of Asia Pacific
-
2. North America
- 2.1. United States
- 2.2. Canada
- 2.3. Mexico
-
3. Europe
- 3.1. Germany
- 3.2. United Kingdom
- 3.3. France
- 3.4. Italy
- 3.5. Rest of Europe
-
4. South America
- 4.1. Brazil
- 4.2. Argentina
- 4.3. Rest of South America
-
5. Middle East and Africa
- 5.1. Saudi Arabia
- 5.2. South Africa
- 5.3. Rest of Middle East and Africa
Lithium Compounds Market Regional Market Share
Geographic Coverage of Lithium Compounds Market
Lithium Compounds Market REPORT HIGHLIGHTS
| Aspects | Details |
|---|---|
| Study Period | 2020-2034 |
| Base Year | 2025 |
| Estimated Year | 2026 |
| Forecast Period | 2026-2034 |
| Historical Period | 2020-2025 |
| Growth Rate | CAGR of 13.4% from 2020-2034 |
| Segmentation |
|
Table of Contents
- 1. Introduction
- 1.1. Research Scope
- 1.2. Market Segmentation
- 1.3. Research Objective
- 1.4. Definitions and Assumptions
- 2. Executive Summary
- 2.1. Market Snapshot
- 3. Market Dynamics
- 3.1. Market Drivers
- 3.2. Market Restrains
- 3.3. Market Trends
- 3.4. Market Opportunities
- 4. Market Factor Analysis
- 4.1. Porters Five Forces
- 4.1.1. Bargaining Power of Suppliers
- 4.1.2. Bargaining Power of Buyers
- 4.1.3. Threat of New Entrants
- 4.1.4. Threat of Substitutes
- 4.1.5. Competitive Rivalry
- 4.2. PESTEL analysis
- 4.3. BCG Analysis
- 4.3.1. Stars (High Growth, High Market Share)
- 4.3.2. Cash Cows (Low Growth, High Market Share)
- 4.3.3. Question Mark (High Growth, Low Market Share)
- 4.3.4. Dogs (Low Growth, Low Market Share)
- 4.4. Ansoff Matrix Analysis
- 4.5. Supply Chain Analysis
- 4.6. Regulatory Landscape
- 4.7. Current Market Potential and Opportunity Assessment (TAM–SAM–SOM Framework)
- 4.8. MDP Analyst Note
- 4.1. Porters Five Forces
- 5. Market Analysis, Insights and Forecast 2021-2033
- 5.1. Market Analysis, Insights and Forecast - by Compounds
- 5.1.1. Lithium Nitride
- 5.1.2. Lithium Metal
- 5.1.3. Lithium Carbonate
- 5.1.4. Lithium Hydroxide
- 5.1.5. Lithium Chloride
- 5.1.6. Butyllithium
- 5.1.7. Other Compounds
- 5.2. Market Analysis, Insights and Forecast - by Application
- 5.2.1. Ceramics and Glass
- 5.2.2. Lubricants
- 5.2.3. Pharmaceuticals
- 5.2.4. Batteries
- 5.2.5. Chemicals
- 5.2.6. Metallurgy
- 5.2.7. Other Applications
- 5.3. Market Analysis, Insights and Forecast - by Region
- 5.3.1. Asia Pacific
- 5.3.2. North America
- 5.3.3. Europe
- 5.3.4. South America
- 5.3.5. Middle East and Africa
- 5.1. Market Analysis, Insights and Forecast - by Compounds
- 6. Global Lithium Compounds Market Analysis, Insights and Forecast, 2021-2033
- 6.1. Market Analysis, Insights and Forecast - by Compounds
- 6.1.1. Lithium Nitride
- 6.1.2. Lithium Metal
- 6.1.3. Lithium Carbonate
- 6.1.4. Lithium Hydroxide
- 6.1.5. Lithium Chloride
- 6.1.6. Butyllithium
- 6.1.7. Other Compounds
- 6.2. Market Analysis, Insights and Forecast - by Application
- 6.2.1. Ceramics and Glass
- 6.2.2. Lubricants
- 6.2.3. Pharmaceuticals
- 6.2.4. Batteries
- 6.2.5. Chemicals
- 6.2.6. Metallurgy
- 6.2.7. Other Applications
- 6.1. Market Analysis, Insights and Forecast - by Compounds
- 7. Asia Pacific Lithium Compounds Market Analysis, Insights and Forecast, 2020-2032
- 7.1. Market Analysis, Insights and Forecast - by Compounds
- 7.1.1. Lithium Nitride
- 7.1.2. Lithium Metal
- 7.1.3. Lithium Carbonate
- 7.1.4. Lithium Hydroxide
- 7.1.5. Lithium Chloride
- 7.1.6. Butyllithium
- 7.1.7. Other Compounds
- 7.2. Market Analysis, Insights and Forecast - by Application
- 7.2.1. Ceramics and Glass
- 7.2.2. Lubricants
- 7.2.3. Pharmaceuticals
- 7.2.4. Batteries
- 7.2.5. Chemicals
- 7.2.6. Metallurgy
- 7.2.7. Other Applications
- 7.1. Market Analysis, Insights and Forecast - by Compounds
- 8. North America Lithium Compounds Market Analysis, Insights and Forecast, 2020-2032
- 8.1. Market Analysis, Insights and Forecast - by Compounds
- 8.1.1. Lithium Nitride
- 8.1.2. Lithium Metal
- 8.1.3. Lithium Carbonate
- 8.1.4. Lithium Hydroxide
- 8.1.5. Lithium Chloride
- 8.1.6. Butyllithium
- 8.1.7. Other Compounds
- 8.2. Market Analysis, Insights and Forecast - by Application
- 8.2.1. Ceramics and Glass
- 8.2.2. Lubricants
- 8.2.3. Pharmaceuticals
- 8.2.4. Batteries
- 8.2.5. Chemicals
- 8.2.6. Metallurgy
- 8.2.7. Other Applications
- 8.1. Market Analysis, Insights and Forecast - by Compounds
- 9. Europe Lithium Compounds Market Analysis, Insights and Forecast, 2020-2032
- 9.1. Market Analysis, Insights and Forecast - by Compounds
- 9.1.1. Lithium Nitride
- 9.1.2. Lithium Metal
- 9.1.3. Lithium Carbonate
- 9.1.4. Lithium Hydroxide
- 9.1.5. Lithium Chloride
- 9.1.6. Butyllithium
- 9.1.7. Other Compounds
- 9.2. Market Analysis, Insights and Forecast - by Application
- 9.2.1. Ceramics and Glass
- 9.2.2. Lubricants
- 9.2.3. Pharmaceuticals
- 9.2.4. Batteries
- 9.2.5. Chemicals
- 9.2.6. Metallurgy
- 9.2.7. Other Applications
- 9.1. Market Analysis, Insights and Forecast - by Compounds
- 10. South America Lithium Compounds Market Analysis, Insights and Forecast, 2020-2032
- 10.1. Market Analysis, Insights and Forecast - by Compounds
- 10.1.1. Lithium Nitride
- 10.1.2. Lithium Metal
- 10.1.3. Lithium Carbonate
- 10.1.4. Lithium Hydroxide
- 10.1.5. Lithium Chloride
- 10.1.6. Butyllithium
- 10.1.7. Other Compounds
- 10.2. Market Analysis, Insights and Forecast - by Application
- 10.2.1. Ceramics and Glass
- 10.2.2. Lubricants
- 10.2.3. Pharmaceuticals
- 10.2.4. Batteries
- 10.2.5. Chemicals
- 10.2.6. Metallurgy
- 10.2.7. Other Applications
- 10.1. Market Analysis, Insights and Forecast - by Compounds
- 11. Middle East and Africa Lithium Compounds Market Analysis, Insights and Forecast, 2020-2032
- 11.1. Market Analysis, Insights and Forecast - by Compounds
- 11.1.1. Lithium Nitride
- 11.1.2. Lithium Metal
- 11.1.3. Lithium Carbonate
- 11.1.4. Lithium Hydroxide
- 11.1.5. Lithium Chloride
- 11.1.6. Butyllithium
- 11.1.7. Other Compounds
- 11.2. Market Analysis, Insights and Forecast - by Application
- 11.2.1. Ceramics and Glass
- 11.2.2. Lubricants
- 11.2.3. Pharmaceuticals
- 11.2.4. Batteries
- 11.2.5. Chemicals
- 11.2.6. Metallurgy
- 11.2.7. Other Applications
- 11.1. Market Analysis, Insights and Forecast - by Compounds
- 12. Competitive Analysis
- 12.1. Company Profiles
- 12.1.1 Neometals Ltd
- 12.1.1.1. Company Overview
- 12.1.1.2. Products
- 12.1.1.3. Company Financials
- 12.1.1.4. SWOT Analysis
- 12.1.2 SQM SA
- 12.1.2.1. Company Overview
- 12.1.2.2. Products
- 12.1.2.3. Company Financials
- 12.1.2.4. SWOT Analysis
- 12.1.3 FMC Corporation
- 12.1.3.1. Company Overview
- 12.1.3.2. Products
- 12.1.3.3. Company Financials
- 12.1.3.4. SWOT Analysis
- 12.1.4 Allkem Limited
- 12.1.4.1. Company Overview
- 12.1.4.2. Products
- 12.1.4.3. Company Financials
- 12.1.4.4. SWOT Analysis
- 12.1.5 Shanghai China Lithium Industrial Co Ltd
- 12.1.5.1. Company Overview
- 12.1.5.2. Products
- 12.1.5.3. Company Financials
- 12.1.5.4. SWOT Analysis
- 12.1.6 Sichuan Tianqi Lithium Chemicals Inc
- 12.1.6.1. Company Overview
- 12.1.6.2. Products
- 12.1.6.3. Company Financials
- 12.1.6.4. SWOT Analysis
- 12.1.7 China Lithium Products Technology Co Ltd
- 12.1.7.1. Company Overview
- 12.1.7.2. Products
- 12.1.7.3. Company Financials
- 12.1.7.4. SWOT Analysis
- 12.1.8 Lithium Americas Corp
- 12.1.8.1. Company Overview
- 12.1.8.2. Products
- 12.1.8.3. Company Financials
- 12.1.8.4. SWOT Analysis
- 12.1.9 Albemarle Corporation
- 12.1.9.1. Company Overview
- 12.1.9.2. Products
- 12.1.9.3. Company Financials
- 12.1.9.4. SWOT Analysis
- 12.1.1 Neometals Ltd
- 12.2. Market Entropy
- 12.2.1 Company's Key Areas Served
- 12.2.2 Recent Developments
- 12.3. Company Market Share Analysis 2025
- 12.3.1 Top 5 Companies Market Share Analysis
- 12.3.2 Top 3 Companies Market Share Analysis
- 12.4. List of Potential Customers
- 13. Research Methodology
List of Figures
- Figure 1: Global Lithium Compounds Market Revenue Breakdown (Billion, %) by Region 2025 & 2033
- Figure 2: Global Lithium Compounds Market Volume Breakdown (K Tons, %) by Region 2025 & 2033
- Figure 3: Asia Pacific Lithium Compounds Market Revenue (Billion), by Compounds 2025 & 2033
- Figure 4: Asia Pacific Lithium Compounds Market Volume (K Tons), by Compounds 2025 & 2033
- Figure 5: Asia Pacific Lithium Compounds Market Revenue Share (%), by Compounds 2025 & 2033
- Figure 6: Asia Pacific Lithium Compounds Market Volume Share (%), by Compounds 2025 & 2033
- Figure 7: Asia Pacific Lithium Compounds Market Revenue (Billion), by Application 2025 & 2033
- Figure 8: Asia Pacific Lithium Compounds Market Volume (K Tons), by Application 2025 & 2033
- Figure 9: Asia Pacific Lithium Compounds Market Revenue Share (%), by Application 2025 & 2033
- Figure 10: Asia Pacific Lithium Compounds Market Volume Share (%), by Application 2025 & 2033
- Figure 11: Asia Pacific Lithium Compounds Market Revenue (Billion), by Country 2025 & 2033
- Figure 12: Asia Pacific Lithium Compounds Market Volume (K Tons), by Country 2025 & 2033
- Figure 13: Asia Pacific Lithium Compounds Market Revenue Share (%), by Country 2025 & 2033
- Figure 14: Asia Pacific Lithium Compounds Market Volume Share (%), by Country 2025 & 2033
- Figure 15: North America Lithium Compounds Market Revenue (Billion), by Compounds 2025 & 2033
- Figure 16: North America Lithium Compounds Market Volume (K Tons), by Compounds 2025 & 2033
- Figure 17: North America Lithium Compounds Market Revenue Share (%), by Compounds 2025 & 2033
- Figure 18: North America Lithium Compounds Market Volume Share (%), by Compounds 2025 & 2033
- Figure 19: North America Lithium Compounds Market Revenue (Billion), by Application 2025 & 2033
- Figure 20: North America Lithium Compounds Market Volume (K Tons), by Application 2025 & 2033
- Figure 21: North America Lithium Compounds Market Revenue Share (%), by Application 2025 & 2033
- Figure 22: North America Lithium Compounds Market Volume Share (%), by Application 2025 & 2033
- Figure 23: North America Lithium Compounds Market Revenue (Billion), by Country 2025 & 2033
- Figure 24: North America Lithium Compounds Market Volume (K Tons), by Country 2025 & 2033
- Figure 25: North America Lithium Compounds Market Revenue Share (%), by Country 2025 & 2033
- Figure 26: North America Lithium Compounds Market Volume Share (%), by Country 2025 & 2033
- Figure 27: Europe Lithium Compounds Market Revenue (Billion), by Compounds 2025 & 2033
- Figure 28: Europe Lithium Compounds Market Volume (K Tons), by Compounds 2025 & 2033
- Figure 29: Europe Lithium Compounds Market Revenue Share (%), by Compounds 2025 & 2033
- Figure 30: Europe Lithium Compounds Market Volume Share (%), by Compounds 2025 & 2033
- Figure 31: Europe Lithium Compounds Market Revenue (Billion), by Application 2025 & 2033
- Figure 32: Europe Lithium Compounds Market Volume (K Tons), by Application 2025 & 2033
- Figure 33: Europe Lithium Compounds Market Revenue Share (%), by Application 2025 & 2033
- Figure 34: Europe Lithium Compounds Market Volume Share (%), by Application 2025 & 2033
- Figure 35: Europe Lithium Compounds Market Revenue (Billion), by Country 2025 & 2033
- Figure 36: Europe Lithium Compounds Market Volume (K Tons), by Country 2025 & 2033
- Figure 37: Europe Lithium Compounds Market Revenue Share (%), by Country 2025 & 2033
- Figure 38: Europe Lithium Compounds Market Volume Share (%), by Country 2025 & 2033
- Figure 39: South America Lithium Compounds Market Revenue (Billion), by Compounds 2025 & 2033
- Figure 40: South America Lithium Compounds Market Volume (K Tons), by Compounds 2025 & 2033
- Figure 41: South America Lithium Compounds Market Revenue Share (%), by Compounds 2025 & 2033
- Figure 42: South America Lithium Compounds Market Volume Share (%), by Compounds 2025 & 2033
- Figure 43: South America Lithium Compounds Market Revenue (Billion), by Application 2025 & 2033
- Figure 44: South America Lithium Compounds Market Volume (K Tons), by Application 2025 & 2033
- Figure 45: South America Lithium Compounds Market Revenue Share (%), by Application 2025 & 2033
- Figure 46: South America Lithium Compounds Market Volume Share (%), by Application 2025 & 2033
- Figure 47: South America Lithium Compounds Market Revenue (Billion), by Country 2025 & 2033
- Figure 48: South America Lithium Compounds Market Volume (K Tons), by Country 2025 & 2033
- Figure 49: South America Lithium Compounds Market Revenue Share (%), by Country 2025 & 2033
- Figure 50: South America Lithium Compounds Market Volume Share (%), by Country 2025 & 2033
- Figure 51: Middle East and Africa Lithium Compounds Market Revenue (Billion), by Compounds 2025 & 2033
- Figure 52: Middle East and Africa Lithium Compounds Market Volume (K Tons), by Compounds 2025 & 2033
- Figure 53: Middle East and Africa Lithium Compounds Market Revenue Share (%), by Compounds 2025 & 2033
- Figure 54: Middle East and Africa Lithium Compounds Market Volume Share (%), by Compounds 2025 & 2033
- Figure 55: Middle East and Africa Lithium Compounds Market Revenue (Billion), by Application 2025 & 2033
- Figure 56: Middle East and Africa Lithium Compounds Market Volume (K Tons), by Application 2025 & 2033
- Figure 57: Middle East and Africa Lithium Compounds Market Revenue Share (%), by Application 2025 & 2033
- Figure 58: Middle East and Africa Lithium Compounds Market Volume Share (%), by Application 2025 & 2033
- Figure 59: Middle East and Africa Lithium Compounds Market Revenue (Billion), by Country 2025 & 2033
- Figure 60: Middle East and Africa Lithium Compounds Market Volume (K Tons), by Country 2025 & 2033
- Figure 61: Middle East and Africa Lithium Compounds Market Revenue Share (%), by Country 2025 & 2033
- Figure 62: Middle East and Africa Lithium Compounds Market Volume Share (%), by Country 2025 & 2033
List of Tables
- Table 1: Global Lithium Compounds Market Revenue Billion Forecast, by Compounds 2020 & 2033
- Table 2: Global Lithium Compounds Market Volume K Tons Forecast, by Compounds 2020 & 2033
- Table 3: Global Lithium Compounds Market Revenue Billion Forecast, by Application 2020 & 2033
- Table 4: Global Lithium Compounds Market Volume K Tons Forecast, by Application 2020 & 2033
- Table 5: Global Lithium Compounds Market Revenue Billion Forecast, by Region 2020 & 2033
- Table 6: Global Lithium Compounds Market Volume K Tons Forecast, by Region 2020 & 2033
- Table 7: Global Lithium Compounds Market Revenue Billion Forecast, by Compounds 2020 & 2033
- Table 8: Global Lithium Compounds Market Volume K Tons Forecast, by Compounds 2020 & 2033
- Table 9: Global Lithium Compounds Market Revenue Billion Forecast, by Application 2020 & 2033
- Table 10: Global Lithium Compounds Market Volume K Tons Forecast, by Application 2020 & 2033
- Table 11: Global Lithium Compounds Market Revenue Billion Forecast, by Country 2020 & 2033
- Table 12: Global Lithium Compounds Market Volume K Tons Forecast, by Country 2020 & 2033
- Table 13: China Lithium Compounds Market Revenue (Billion) Forecast, by Application 2020 & 2033
- Table 14: China Lithium Compounds Market Volume (K Tons) Forecast, by Application 2020 & 2033
- Table 15: India Lithium Compounds Market Revenue (Billion) Forecast, by Application 2020 & 2033
- Table 16: India Lithium Compounds Market Volume (K Tons) Forecast, by Application 2020 & 2033
- Table 17: Japan Lithium Compounds Market Revenue (Billion) Forecast, by Application 2020 & 2033
- Table 18: Japan Lithium Compounds Market Volume (K Tons) Forecast, by Application 2020 & 2033
- Table 19: South Korea Lithium Compounds Market Revenue (Billion) Forecast, by Application 2020 & 2033
- Table 20: South Korea Lithium Compounds Market Volume (K Tons) Forecast, by Application 2020 & 2033
- Table 21: Rest of Asia Pacific Lithium Compounds Market Revenue (Billion) Forecast, by Application 2020 & 2033
- Table 22: Rest of Asia Pacific Lithium Compounds Market Volume (K Tons) Forecast, by Application 2020 & 2033
- Table 23: Global Lithium Compounds Market Revenue Billion Forecast, by Compounds 2020 & 2033
- Table 24: Global Lithium Compounds Market Volume K Tons Forecast, by Compounds 2020 & 2033
- Table 25: Global Lithium Compounds Market Revenue Billion Forecast, by Application 2020 & 2033
- Table 26: Global Lithium Compounds Market Volume K Tons Forecast, by Application 2020 & 2033
- Table 27: Global Lithium Compounds Market Revenue Billion Forecast, by Country 2020 & 2033
- Table 28: Global Lithium Compounds Market Volume K Tons Forecast, by Country 2020 & 2033
- Table 29: United States Lithium Compounds Market Revenue (Billion) Forecast, by Application 2020 & 2033
- Table 30: United States Lithium Compounds Market Volume (K Tons) Forecast, by Application 2020 & 2033
- Table 31: Canada Lithium Compounds Market Revenue (Billion) Forecast, by Application 2020 & 2033
- Table 32: Canada Lithium Compounds Market Volume (K Tons) Forecast, by Application 2020 & 2033
- Table 33: Mexico Lithium Compounds Market Revenue (Billion) Forecast, by Application 2020 & 2033
- Table 34: Mexico Lithium Compounds Market Volume (K Tons) Forecast, by Application 2020 & 2033
- Table 35: Global Lithium Compounds Market Revenue Billion Forecast, by Compounds 2020 & 2033
- Table 36: Global Lithium Compounds Market Volume K Tons Forecast, by Compounds 2020 & 2033
- Table 37: Global Lithium Compounds Market Revenue Billion Forecast, by Application 2020 & 2033
- Table 38: Global Lithium Compounds Market Volume K Tons Forecast, by Application 2020 & 2033
- Table 39: Global Lithium Compounds Market Revenue Billion Forecast, by Country 2020 & 2033
- Table 40: Global Lithium Compounds Market Volume K Tons Forecast, by Country 2020 & 2033
- Table 41: Germany Lithium Compounds Market Revenue (Billion) Forecast, by Application 2020 & 2033
- Table 42: Germany Lithium Compounds Market Volume (K Tons) Forecast, by Application 2020 & 2033
- Table 43: United Kingdom Lithium Compounds Market Revenue (Billion) Forecast, by Application 2020 & 2033
- Table 44: United Kingdom Lithium Compounds Market Volume (K Tons) Forecast, by Application 2020 & 2033
- Table 45: France Lithium Compounds Market Revenue (Billion) Forecast, by Application 2020 & 2033
- Table 46: France Lithium Compounds Market Volume (K Tons) Forecast, by Application 2020 & 2033
- Table 47: Italy Lithium Compounds Market Revenue (Billion) Forecast, by Application 2020 & 2033
- Table 48: Italy Lithium Compounds Market Volume (K Tons) Forecast, by Application 2020 & 2033
- Table 49: Rest of Europe Lithium Compounds Market Revenue (Billion) Forecast, by Application 2020 & 2033
- Table 50: Rest of Europe Lithium Compounds Market Volume (K Tons) Forecast, by Application 2020 & 2033
- Table 51: Global Lithium Compounds Market Revenue Billion Forecast, by Compounds 2020 & 2033
- Table 52: Global Lithium Compounds Market Volume K Tons Forecast, by Compounds 2020 & 2033
- Table 53: Global Lithium Compounds Market Revenue Billion Forecast, by Application 2020 & 2033
- Table 54: Global Lithium Compounds Market Volume K Tons Forecast, by Application 2020 & 2033
- Table 55: Global Lithium Compounds Market Revenue Billion Forecast, by Country 2020 & 2033
- Table 56: Global Lithium Compounds Market Volume K Tons Forecast, by Country 2020 & 2033
- Table 57: Brazil Lithium Compounds Market Revenue (Billion) Forecast, by Application 2020 & 2033
- Table 58: Brazil Lithium Compounds Market Volume (K Tons) Forecast, by Application 2020 & 2033
- Table 59: Argentina Lithium Compounds Market Revenue (Billion) Forecast, by Application 2020 & 2033
- Table 60: Argentina Lithium Compounds Market Volume (K Tons) Forecast, by Application 2020 & 2033
- Table 61: Rest of South America Lithium Compounds Market Revenue (Billion) Forecast, by Application 2020 & 2033
- Table 62: Rest of South America Lithium Compounds Market Volume (K Tons) Forecast, by Application 2020 & 2033
- Table 63: Global Lithium Compounds Market Revenue Billion Forecast, by Compounds 2020 & 2033
- Table 64: Global Lithium Compounds Market Volume K Tons Forecast, by Compounds 2020 & 2033
- Table 65: Global Lithium Compounds Market Revenue Billion Forecast, by Application 2020 & 2033
- Table 66: Global Lithium Compounds Market Volume K Tons Forecast, by Application 2020 & 2033
- Table 67: Global Lithium Compounds Market Revenue Billion Forecast, by Country 2020 & 2033
- Table 68: Global Lithium Compounds Market Volume K Tons Forecast, by Country 2020 & 2033
- Table 69: Saudi Arabia Lithium Compounds Market Revenue (Billion) Forecast, by Application 2020 & 2033
- Table 70: Saudi Arabia Lithium Compounds Market Volume (K Tons) Forecast, by Application 2020 & 2033
- Table 71: South Africa Lithium Compounds Market Revenue (Billion) Forecast, by Application 2020 & 2033
- Table 72: South Africa Lithium Compounds Market Volume (K Tons) Forecast, by Application 2020 & 2033
- Table 73: Rest of Middle East and Africa Lithium Compounds Market Revenue (Billion) Forecast, by Application 2020 & 2033
- Table 74: Rest of Middle East and Africa Lithium Compounds Market Volume (K Tons) Forecast, by Application 2020 & 2033
Frequently Asked Questions
1. What is the projected Compound Annual Growth Rate (CAGR) of the Lithium Compounds Market?
The projected CAGR is approximately 13.4%.
2. Which companies are prominent players in the Lithium Compounds Market?
Key companies in the market include Neometals Ltd, SQM SA, FMC Corporation, Allkem Limited, Shanghai China Lithium Industrial Co Ltd, Sichuan Tianqi Lithium Chemicals Inc, China Lithium Products Technology Co Ltd, Lithium Americas Corp, Albemarle Corporation.
3. What are the main segments of the Lithium Compounds Market?
The market segments include Compounds, Application.
4. Can you provide details about the market size?
The market size is estimated to be USD 7.7 Billion as of 2022.
5. What are some drivers contributing to market growth?
Increasing Demand for Ceramics and Glass Industry; Growing Applications for Batteries.
6. What are the notable trends driving market growth?
Growing Demand for Batteries.
7. Are there any restraints impacting market growth?
Entry of New Substitutes; Other Restraints.
8. Can you provide examples of recent developments in the market?
February 2023: Lithium Americas announced the closing of the initial $320M tranche of the previously announced $650M investment by General Motors (GM), which makes the automaker its largest shareholder and offtake partner. Proceeds from GM's investment will be used to accelerate the development of the Thacker Pass project in Nevada, the largest known lithium resource in the U.S. that is fully permitted to begin construction. Lithium Americas expects to close the second and final tranche following the anticipated separation of its U.S. and Argentine businesses in H2 2023.
9. What pricing options are available for accessing the report?
Pricing options include single-user, multi-user, and enterprise licenses priced at USD 3,950, USD 4,950, and USD 6,950 respectively.
10. Is the market size provided in terms of value or volume?
The market size is provided in terms of value, measured in Billion and volume, measured in K Tons.
11. Are there any specific market keywords associated with the report?
Yes, the market keyword associated with the report is "Lithium Compounds Market," which aids in identifying and referencing the specific market segment covered.
12. How do I determine which pricing option suits my needs best?
The pricing options vary based on user requirements and access needs. Individual users may opt for single-user licenses, while businesses requiring broader access may choose multi-user or enterprise licenses for cost-effective access to the report.
13. Are there any additional resources or data provided in the Lithium Compounds Market report?
While the report offers comprehensive insights, it's advisable to review the specific contents or supplementary materials provided to ascertain if additional resources or data are available.
14. How can I stay updated on further developments or reports in the Lithium Compounds Market?
To stay informed about further developments, trends, and reports in the Lithium Compounds Market, consider subscribing to industry newsletters, following relevant companies and organizations, or regularly checking reputable industry news sources and publications.
Methodology
Step 1 - Identification of Relevant Samples Size from Population Database


Step 2 - Approaches for Defining Global Market Size (Value, Volume* & Price*)

Note*: In applicable scenarios
Step 3 - Data Sources
Primary Research
- Web Analytics
- Survey Reports
- Research Institute
- Latest Research Reports
- Opinion Leaders
Secondary Research
- Annual Reports
- White Paper
- Latest Press Release
- Industry Association
- Paid Database
- Investor Presentations

Step 4 - Data Triangulation
Involves using different sources of information in order to increase the validity of a study
These sources are likely to be stakeholders in a program - participants, other researchers, program staff, other community members, and so on.
Then we put all data in single framework & apply various statistical tools to find out the dynamic on the market.
During the analysis stage, feedback from the stakeholder groups would be compared to determine areas of agreement as well as areas of divergence