

Key Insights
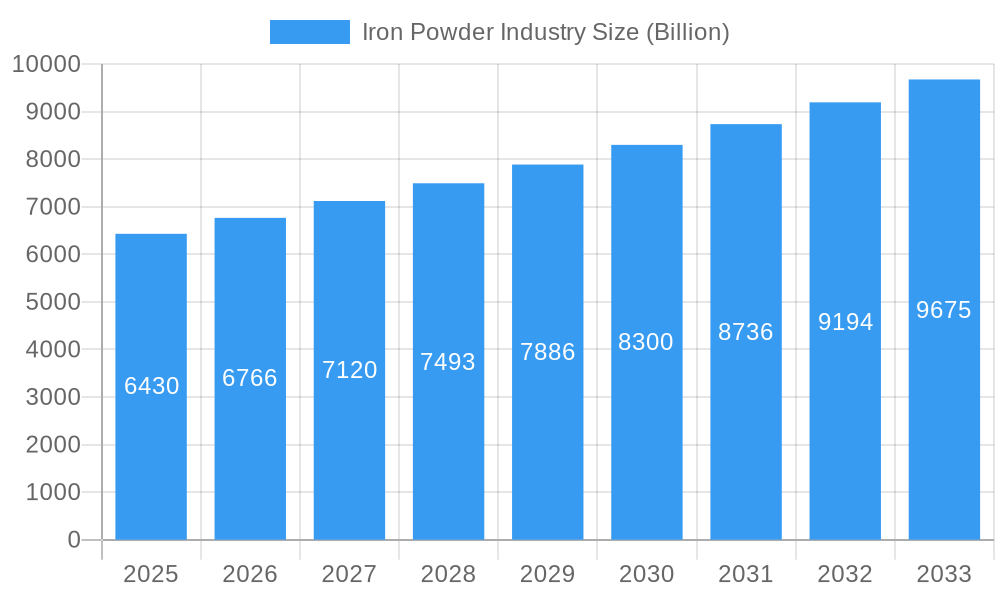
The global iron powder market, valued at $6.43 billion in 2025, is projected to experience robust growth, driven by a Compound Annual Growth Rate (CAGR) of 5.2% from 2025 to 2033. This expansion is fueled primarily by the burgeoning automotive industry's increasing demand for powder metallurgy components, offering benefits like lightweighting, enhanced durability, and complex designs. Furthermore, the chemical industry's utilization of iron powder in various catalysts and pigments is a significant contributor to market growth. The growing adoption of additive manufacturing (3D printing) technologies further boosts demand, as iron powder serves as a crucial feedstock for producing intricate metal parts across diverse sectors. The market segmentation reveals a strong preference for reduced iron powder, owing to its cost-effectiveness and suitable properties for several applications. Geographically, Asia-Pacific, particularly China, India, and Japan, dominates the market due to substantial manufacturing activities and rising infrastructure development. North America and Europe also hold significant market shares, propelled by the automotive and chemical industries in these regions. However, fluctuating raw material prices and environmental concerns regarding powder production and disposal pose challenges to market growth.
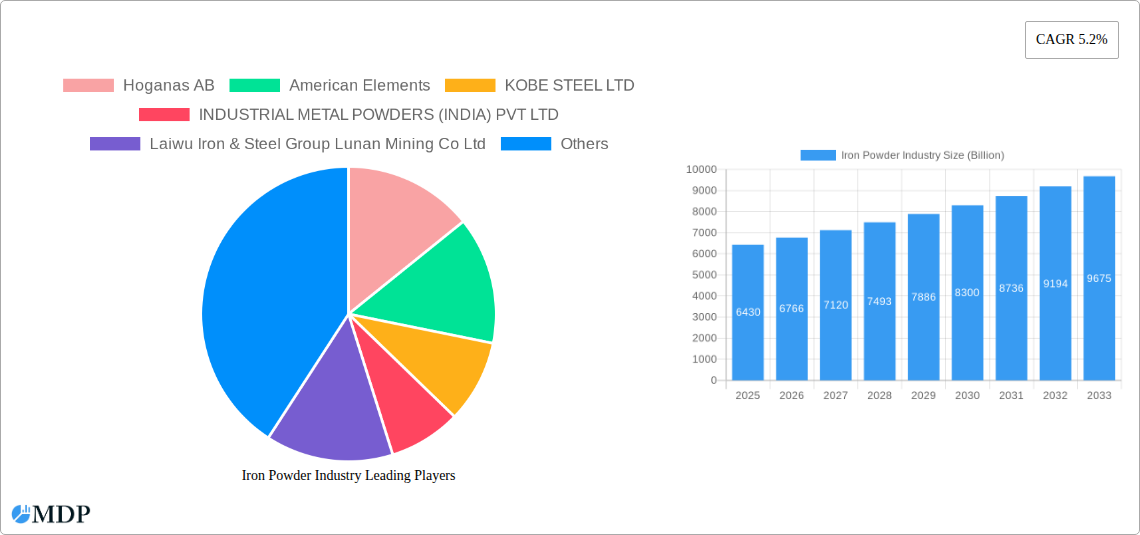
Iron Powder Industry Market Size (In Billion)
Despite these challenges, the market is expected to witness considerable diversification in end-user applications beyond the automotive sector. The expanding food industry's use of iron powder for nutritional fortification presents a promising avenue for market growth. Technological advancements in iron powder production, focusing on improved quality, consistent particle size distribution, and enhanced purity, are expected to attract new applications and drive market expansion in the forecast period. Competition among established players like Hoganas AB, Kobe Steel Ltd., and others is intense, prompting innovation and strategic collaborations to cater to evolving customer demands and emerging market opportunities. The increasing focus on sustainability and the circular economy will influence the development of more environmentally friendly iron powder production methods, shaping the future of this dynamic market.
Iron Powder Industry Company Market Share
Iron Powder Industry Market Report: A Comprehensive Analysis (2019-2033)
This comprehensive report provides an in-depth analysis of the global iron powder industry, projecting a market valuation of $XX Billion by 2033. It examines market dynamics, leading players, key trends, and future opportunities, offering invaluable insights for stakeholders across the value chain. The study period covers 2019-2033, with 2025 serving as the base and estimated year. The forecast period spans from 2025 to 2033, while the historical period encompasses 2019-2024.
Iron Powder Industry Market Dynamics & Concentration
The global iron powder market, currently valued at $XX Billion, is characterized by moderate concentration with several key players holding significant market share. The market is driven by continuous innovation in powder metallurgy techniques, leading to the development of high-performance iron powders tailored to specific applications. Stringent environmental regulations concerning emissions and waste management are shaping industry practices. Product substitutes, such as alternative metal powders and composites, present competitive pressure. End-user trends, particularly in the automotive and chemical sectors, are significantly impacting demand. The rise of electric vehicles and the demand for lightweight components have boosted the market. M&A activity in the sector is moderate; however, a recent uptick in strategic acquisitions and partnerships indicates an evolving competitive landscape.
- Market Share: Hoganas AB, Kobe Steel Ltd, and BASF SE collectively hold approximately xx% of the market share.
- M&A Deal Count: An estimated xx deals were recorded between 2019 and 2024, with a projected increase to xx deals by 2033.
Iron Powder Industry Industry Trends & Analysis
The iron powder market is experiencing a Compound Annual Growth Rate (CAGR) of xx% during the forecast period (2025-2033). This growth is driven by increasing demand from the automotive industry, particularly for electric vehicle components, the ongoing development of advanced materials with superior properties, and technological advancements in powder production. Consumer preference for sustainable and environmentally friendly products is also influencing market dynamics. Technological disruptions, such as the adoption of additive manufacturing (3D printing) and the use of automation in powder production, are driving efficiency and innovation. Competitive dynamics are intensified by the entrance of new players and the ongoing innovation by established companies. Market penetration is increasing across various end-user sectors, indicating expanding market scope.
Leading Markets & Segments in Iron Powder Industry
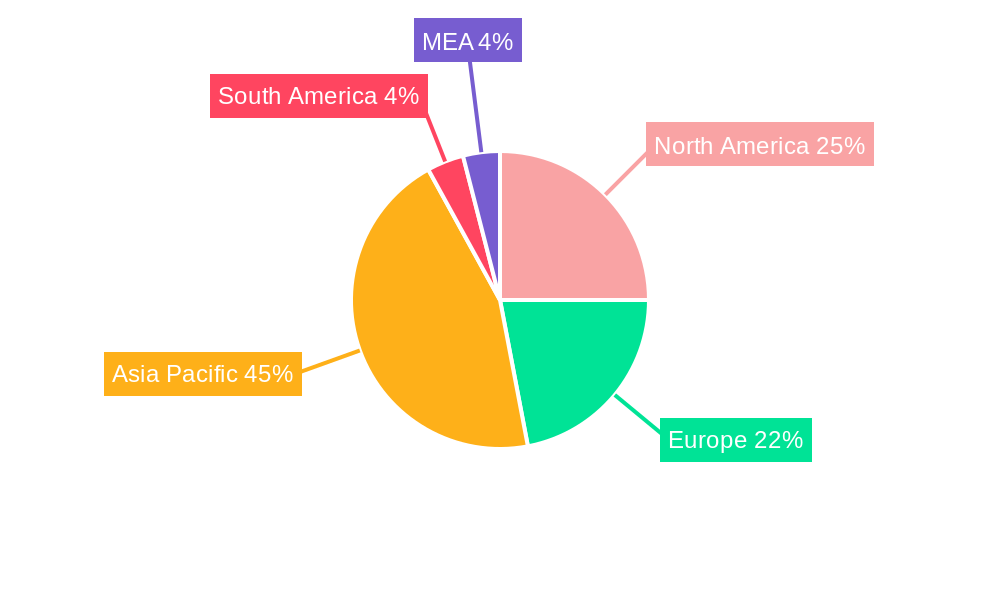
The Asia-Pacific region currently dominates the iron powder market, driven by rapid industrialization and substantial growth in the automotive and manufacturing sectors. Within this region, China represents a significant market share, attributed to its robust manufacturing base and investments in infrastructure.
- Dominant Type: Reduced iron powder holds the largest market share due to its cost-effectiveness and wide range of applications.
- Dominant End-User: The automotive industry is the leading end-user, primarily due to the use of iron powder in the production of sintered components.
- Key Drivers in Asia-Pacific:
- Favorable government policies promoting industrial growth
- Expanding infrastructure projects and investments
- Rising disposable incomes and increasing consumer demand
Iron Powder Industry Product Developments
Recent innovations focus on developing iron powders with enhanced properties, such as higher strength, improved sinterability, and tailored particle size distribution. These advancements are expanding the applications of iron powder in various industries. The integration of nanotechnology is leading to the development of high-performance composites, significantly improving component performance. These advancements are tailored to specific market demands, creating a competitive advantage for the companies implementing them.
Key Drivers of Iron Powder Industry Growth
Several factors fuel the iron powder industry's growth:
- Technological advancements: Improvements in powder production techniques and the development of new powder metallurgy processes are increasing efficiency and lowering production costs.
- Economic growth: Expansion in manufacturing and automotive sectors in developing economies are significantly boosting demand.
- Government regulations: Policies promoting sustainable manufacturing and the use of environmentally friendly materials are driving adoption of iron powders.
Challenges in the Iron Powder Industry Market
The iron powder industry faces several challenges:
- Fluctuating raw material prices: Iron ore prices significantly impact production costs.
- Stringent environmental regulations: Compliance with emission standards and waste management regulations requires investments and adjustments.
- Intense competition: The presence of numerous players, both established and emerging, intensifies competitive pressures.
Emerging Opportunities in Iron Powder Industry
Long-term growth will be fueled by:
- Expansion into new applications: The use of iron powder in emerging sectors like 3D printing and renewable energy holds significant potential.
- Strategic partnerships and collaborations: Joint ventures and partnerships across the value chain will foster innovation and efficiency.
- Market expansion in developing economies: Untapped potential exists in rapidly growing markets of developing economies.
Leading Players in the Iron Powder Industry Sector
- Hoganas AB
- American Elements
- KOBE STEEL LTD
- INDUSTRIAL METAL POWDERS (INDIA) PVT LTD
- Laiwu Iron & Steel Group Lunan Mining Co Ltd
- ATI
- Ashland
- Belmont Metals
- BASF SE
- Rio Tinto Metal Powders
- CNPC POWDER
- JFE Steel Corporation
- Pometon Powder
Key Milestones in Iron Powder Industry Industry
- January 2023: JFE Steel achieved ISO 45001 certification across its Japanese operations, enhancing occupational health and safety standards.
- January 2023: Höganäs launched nickel-free powders, potentially reducing production costs and environmental impact.
Strategic Outlook for Iron Powder Industry Market
The iron powder market is poised for significant growth, driven by technological advancements, increasing demand from various end-use sectors, and strategic investments in research and development. Opportunities exist for companies to capitalize on emerging applications and expand their market reach in developing economies. A focus on sustainability and environmentally friendly production methods will be crucial for long-term success.
Iron Powder Industry Segmentation
-
1. Type
- 1.1. Reduced Iron Powder
- 1.2. Atomized Iron Powder
- 1.3. Electrolytic Iron Powder
-
2. End-User
- 2.1. Automotive
- 2.2. Chemical
- 2.3. General Industrial
- 2.4. Food
- 2.5. Other End-users
Iron Powder Industry Segmentation By Geography
-
1. Asia Pacific
- 1.1. China
- 1.2. India
- 1.3. Japan
- 1.4. South Korea
- 1.5. Rest of Asia Pacific
-
2. North America
- 2.1. United States
- 2.2. Canada
- 2.3. Mexico
-
3. Europe
- 3.1. United Kingdom
- 3.2. France
- 3.3. Germany
- 3.4. Italy
- 3.5. Rest of Europe
-
4. South America
- 4.1. Brazil
- 4.2. Argentina
- 4.3. Rest of South America
-
5. Middle East and Africa
- 5.1. Saudi Arabia
- 5.2. South Africa
- 5.3. Rest of Middle East and Africa
Iron Powder Industry Regional Market Share
Geographic Coverage of Iron Powder Industry
Iron Powder Industry REPORT HIGHLIGHTS
| Aspects | Details |
|---|---|
| Study Period | 2020-2034 |
| Base Year | 2025 |
| Estimated Year | 2026 |
| Forecast Period | 2026-2034 |
| Historical Period | 2020-2025 |
| Growth Rate | CAGR of 5.2% from 2020-2034 |
| Segmentation |
|
Table of Contents
- 1. Introduction
- 1.1. Research Scope
- 1.2. Market Segmentation
- 1.3. Research Objective
- 1.4. Definitions and Assumptions
- 2. Executive Summary
- 2.1. Market Snapshot
- 3. Market Dynamics
- 3.1. Market Drivers
- 3.2. Market Restrains
- 3.3. Market Trends
- 3.4. Market Opportunities
- 4. Market Factor Analysis
- 4.1. Porters Five Forces
- 4.1.1. Bargaining Power of Suppliers
- 4.1.2. Bargaining Power of Buyers
- 4.1.3. Threat of New Entrants
- 4.1.4. Threat of Substitutes
- 4.1.5. Competitive Rivalry
- 4.2. PESTEL analysis
- 4.3. BCG Analysis
- 4.3.1. Stars (High Growth, High Market Share)
- 4.3.2. Cash Cows (Low Growth, High Market Share)
- 4.3.3. Question Mark (High Growth, Low Market Share)
- 4.3.4. Dogs (Low Growth, Low Market Share)
- 4.4. Ansoff Matrix Analysis
- 4.5. Supply Chain Analysis
- 4.6. Regulatory Landscape
- 4.7. Current Market Potential and Opportunity Assessment (TAM–SAM–SOM Framework)
- 4.8. MDP Analyst Note
- 4.1. Porters Five Forces
- 5. Market Analysis, Insights and Forecast 2021-2033
- 5.1. Market Analysis, Insights and Forecast - by Type
- 5.1.1. Reduced Iron Powder
- 5.1.2. Atomized Iron Powder
- 5.1.3. Electrolytic Iron Powder
- 5.2. Market Analysis, Insights and Forecast - by End-User
- 5.2.1. Automotive
- 5.2.2. Chemical
- 5.2.3. General Industrial
- 5.2.4. Food
- 5.2.5. Other End-users
- 5.3. Market Analysis, Insights and Forecast - by Region
- 5.3.1. Asia Pacific
- 5.3.2. North America
- 5.3.3. Europe
- 5.3.4. South America
- 5.3.5. Middle East and Africa
- 5.1. Market Analysis, Insights and Forecast - by Type
- 6. Global Iron Powder Industry Analysis, Insights and Forecast, 2021-2033
- 6.1. Market Analysis, Insights and Forecast - by Type
- 6.1.1. Reduced Iron Powder
- 6.1.2. Atomized Iron Powder
- 6.1.3. Electrolytic Iron Powder
- 6.2. Market Analysis, Insights and Forecast - by End-User
- 6.2.1. Automotive
- 6.2.2. Chemical
- 6.2.3. General Industrial
- 6.2.4. Food
- 6.2.5. Other End-users
- 6.1. Market Analysis, Insights and Forecast - by Type
- 7. Asia Pacific Iron Powder Industry Analysis, Insights and Forecast, 2020-2032
- 7.1. Market Analysis, Insights and Forecast - by Type
- 7.1.1. Reduced Iron Powder
- 7.1.2. Atomized Iron Powder
- 7.1.3. Electrolytic Iron Powder
- 7.2. Market Analysis, Insights and Forecast - by End-User
- 7.2.1. Automotive
- 7.2.2. Chemical
- 7.2.3. General Industrial
- 7.2.4. Food
- 7.2.5. Other End-users
- 7.1. Market Analysis, Insights and Forecast - by Type
- 8. North America Iron Powder Industry Analysis, Insights and Forecast, 2020-2032
- 8.1. Market Analysis, Insights and Forecast - by Type
- 8.1.1. Reduced Iron Powder
- 8.1.2. Atomized Iron Powder
- 8.1.3. Electrolytic Iron Powder
- 8.2. Market Analysis, Insights and Forecast - by End-User
- 8.2.1. Automotive
- 8.2.2. Chemical
- 8.2.3. General Industrial
- 8.2.4. Food
- 8.2.5. Other End-users
- 8.1. Market Analysis, Insights and Forecast - by Type
- 9. Europe Iron Powder Industry Analysis, Insights and Forecast, 2020-2032
- 9.1. Market Analysis, Insights and Forecast - by Type
- 9.1.1. Reduced Iron Powder
- 9.1.2. Atomized Iron Powder
- 9.1.3. Electrolytic Iron Powder
- 9.2. Market Analysis, Insights and Forecast - by End-User
- 9.2.1. Automotive
- 9.2.2. Chemical
- 9.2.3. General Industrial
- 9.2.4. Food
- 9.2.5. Other End-users
- 9.1. Market Analysis, Insights and Forecast - by Type
- 10. South America Iron Powder Industry Analysis, Insights and Forecast, 2020-2032
- 10.1. Market Analysis, Insights and Forecast - by Type
- 10.1.1. Reduced Iron Powder
- 10.1.2. Atomized Iron Powder
- 10.1.3. Electrolytic Iron Powder
- 10.2. Market Analysis, Insights and Forecast - by End-User
- 10.2.1. Automotive
- 10.2.2. Chemical
- 10.2.3. General Industrial
- 10.2.4. Food
- 10.2.5. Other End-users
- 10.1. Market Analysis, Insights and Forecast - by Type
- 11. Middle East and Africa Iron Powder Industry Analysis, Insights and Forecast, 2020-2032
- 11.1. Market Analysis, Insights and Forecast - by Type
- 11.1.1. Reduced Iron Powder
- 11.1.2. Atomized Iron Powder
- 11.1.3. Electrolytic Iron Powder
- 11.2. Market Analysis, Insights and Forecast - by End-User
- 11.2.1. Automotive
- 11.2.2. Chemical
- 11.2.3. General Industrial
- 11.2.4. Food
- 11.2.5. Other End-users
- 11.1. Market Analysis, Insights and Forecast - by Type
- 12. Competitive Analysis
- 12.1. Company Profiles
- 12.1.1 Hoganas AB
- 12.1.1.1. Company Overview
- 12.1.1.2. Products
- 12.1.1.3. Company Financials
- 12.1.1.4. SWOT Analysis
- 12.1.2 American Elements
- 12.1.2.1. Company Overview
- 12.1.2.2. Products
- 12.1.2.3. Company Financials
- 12.1.2.4. SWOT Analysis
- 12.1.3 KOBE STEEL LTD
- 12.1.3.1. Company Overview
- 12.1.3.2. Products
- 12.1.3.3. Company Financials
- 12.1.3.4. SWOT Analysis
- 12.1.4 INDUSTRIAL METAL POWDERS (INDIA) PVT LTD
- 12.1.4.1. Company Overview
- 12.1.4.2. Products
- 12.1.4.3. Company Financials
- 12.1.4.4. SWOT Analysis
- 12.1.5 Laiwu Iron & Steel Group Lunan Mining Co Ltd
- 12.1.5.1. Company Overview
- 12.1.5.2. Products
- 12.1.5.3. Company Financials
- 12.1.5.4. SWOT Analysis
- 12.1.6 ATI
- 12.1.6.1. Company Overview
- 12.1.6.2. Products
- 12.1.6.3. Company Financials
- 12.1.6.4. SWOT Analysis
- 12.1.7 Ashland
- 12.1.7.1. Company Overview
- 12.1.7.2. Products
- 12.1.7.3. Company Financials
- 12.1.7.4. SWOT Analysis
- 12.1.8 Belmont Metals
- 12.1.8.1. Company Overview
- 12.1.8.2. Products
- 12.1.8.3. Company Financials
- 12.1.8.4. SWOT Analysis
- 12.1.9 BASF SE
- 12.1.9.1. Company Overview
- 12.1.9.2. Products
- 12.1.9.3. Company Financials
- 12.1.9.4. SWOT Analysis
- 12.1.10 Rio Tinto Metal Powders
- 12.1.10.1. Company Overview
- 12.1.10.2. Products
- 12.1.10.3. Company Financials
- 12.1.10.4. SWOT Analysis
- 12.1.11 CNPC POWDER
- 12.1.11.1. Company Overview
- 12.1.11.2. Products
- 12.1.11.3. Company Financials
- 12.1.11.4. SWOT Analysis
- 12.1.12 JFE Steel Corporation
- 12.1.12.1. Company Overview
- 12.1.12.2. Products
- 12.1.12.3. Company Financials
- 12.1.12.4. SWOT Analysis
- 12.1.13 Pometon Powder
- 12.1.13.1. Company Overview
- 12.1.13.2. Products
- 12.1.13.3. Company Financials
- 12.1.13.4. SWOT Analysis
- 12.1.1 Hoganas AB
- 12.2. Market Entropy
- 12.2.1 Company's Key Areas Served
- 12.2.2 Recent Developments
- 12.3. Company Market Share Analysis 2025
- 12.3.1 Top 5 Companies Market Share Analysis
- 12.3.2 Top 3 Companies Market Share Analysis
- 12.4. List of Potential Customers
- 13. Research Methodology
List of Figures
- Figure 1: Global Iron Powder Industry Revenue Breakdown (Billion, %) by Region 2025 & 2033
- Figure 2: Global Iron Powder Industry Volume Breakdown (K Tons, %) by Region 2025 & 2033
- Figure 3: Asia Pacific Iron Powder Industry Revenue (Billion), by Type 2025 & 2033
- Figure 4: Asia Pacific Iron Powder Industry Volume (K Tons), by Type 2025 & 2033
- Figure 5: Asia Pacific Iron Powder Industry Revenue Share (%), by Type 2025 & 2033
- Figure 6: Asia Pacific Iron Powder Industry Volume Share (%), by Type 2025 & 2033
- Figure 7: Asia Pacific Iron Powder Industry Revenue (Billion), by End-User 2025 & 2033
- Figure 8: Asia Pacific Iron Powder Industry Volume (K Tons), by End-User 2025 & 2033
- Figure 9: Asia Pacific Iron Powder Industry Revenue Share (%), by End-User 2025 & 2033
- Figure 10: Asia Pacific Iron Powder Industry Volume Share (%), by End-User 2025 & 2033
- Figure 11: Asia Pacific Iron Powder Industry Revenue (Billion), by Country 2025 & 2033
- Figure 12: Asia Pacific Iron Powder Industry Volume (K Tons), by Country 2025 & 2033
- Figure 13: Asia Pacific Iron Powder Industry Revenue Share (%), by Country 2025 & 2033
- Figure 14: Asia Pacific Iron Powder Industry Volume Share (%), by Country 2025 & 2033
- Figure 15: North America Iron Powder Industry Revenue (Billion), by Type 2025 & 2033
- Figure 16: North America Iron Powder Industry Volume (K Tons), by Type 2025 & 2033
- Figure 17: North America Iron Powder Industry Revenue Share (%), by Type 2025 & 2033
- Figure 18: North America Iron Powder Industry Volume Share (%), by Type 2025 & 2033
- Figure 19: North America Iron Powder Industry Revenue (Billion), by End-User 2025 & 2033
- Figure 20: North America Iron Powder Industry Volume (K Tons), by End-User 2025 & 2033
- Figure 21: North America Iron Powder Industry Revenue Share (%), by End-User 2025 & 2033
- Figure 22: North America Iron Powder Industry Volume Share (%), by End-User 2025 & 2033
- Figure 23: North America Iron Powder Industry Revenue (Billion), by Country 2025 & 2033
- Figure 24: North America Iron Powder Industry Volume (K Tons), by Country 2025 & 2033
- Figure 25: North America Iron Powder Industry Revenue Share (%), by Country 2025 & 2033
- Figure 26: North America Iron Powder Industry Volume Share (%), by Country 2025 & 2033
- Figure 27: Europe Iron Powder Industry Revenue (Billion), by Type 2025 & 2033
- Figure 28: Europe Iron Powder Industry Volume (K Tons), by Type 2025 & 2033
- Figure 29: Europe Iron Powder Industry Revenue Share (%), by Type 2025 & 2033
- Figure 30: Europe Iron Powder Industry Volume Share (%), by Type 2025 & 2033
- Figure 31: Europe Iron Powder Industry Revenue (Billion), by End-User 2025 & 2033
- Figure 32: Europe Iron Powder Industry Volume (K Tons), by End-User 2025 & 2033
- Figure 33: Europe Iron Powder Industry Revenue Share (%), by End-User 2025 & 2033
- Figure 34: Europe Iron Powder Industry Volume Share (%), by End-User 2025 & 2033
- Figure 35: Europe Iron Powder Industry Revenue (Billion), by Country 2025 & 2033
- Figure 36: Europe Iron Powder Industry Volume (K Tons), by Country 2025 & 2033
- Figure 37: Europe Iron Powder Industry Revenue Share (%), by Country 2025 & 2033
- Figure 38: Europe Iron Powder Industry Volume Share (%), by Country 2025 & 2033
- Figure 39: South America Iron Powder Industry Revenue (Billion), by Type 2025 & 2033
- Figure 40: South America Iron Powder Industry Volume (K Tons), by Type 2025 & 2033
- Figure 41: South America Iron Powder Industry Revenue Share (%), by Type 2025 & 2033
- Figure 42: South America Iron Powder Industry Volume Share (%), by Type 2025 & 2033
- Figure 43: South America Iron Powder Industry Revenue (Billion), by End-User 2025 & 2033
- Figure 44: South America Iron Powder Industry Volume (K Tons), by End-User 2025 & 2033
- Figure 45: South America Iron Powder Industry Revenue Share (%), by End-User 2025 & 2033
- Figure 46: South America Iron Powder Industry Volume Share (%), by End-User 2025 & 2033
- Figure 47: South America Iron Powder Industry Revenue (Billion), by Country 2025 & 2033
- Figure 48: South America Iron Powder Industry Volume (K Tons), by Country 2025 & 2033
- Figure 49: South America Iron Powder Industry Revenue Share (%), by Country 2025 & 2033
- Figure 50: South America Iron Powder Industry Volume Share (%), by Country 2025 & 2033
- Figure 51: Middle East and Africa Iron Powder Industry Revenue (Billion), by Type 2025 & 2033
- Figure 52: Middle East and Africa Iron Powder Industry Volume (K Tons), by Type 2025 & 2033
- Figure 53: Middle East and Africa Iron Powder Industry Revenue Share (%), by Type 2025 & 2033
- Figure 54: Middle East and Africa Iron Powder Industry Volume Share (%), by Type 2025 & 2033
- Figure 55: Middle East and Africa Iron Powder Industry Revenue (Billion), by End-User 2025 & 2033
- Figure 56: Middle East and Africa Iron Powder Industry Volume (K Tons), by End-User 2025 & 2033
- Figure 57: Middle East and Africa Iron Powder Industry Revenue Share (%), by End-User 2025 & 2033
- Figure 58: Middle East and Africa Iron Powder Industry Volume Share (%), by End-User 2025 & 2033
- Figure 59: Middle East and Africa Iron Powder Industry Revenue (Billion), by Country 2025 & 2033
- Figure 60: Middle East and Africa Iron Powder Industry Volume (K Tons), by Country 2025 & 2033
- Figure 61: Middle East and Africa Iron Powder Industry Revenue Share (%), by Country 2025 & 2033
- Figure 62: Middle East and Africa Iron Powder Industry Volume Share (%), by Country 2025 & 2033
List of Tables
- Table 1: Global Iron Powder Industry Revenue Billion Forecast, by Type 2020 & 2033
- Table 2: Global Iron Powder Industry Volume K Tons Forecast, by Type 2020 & 2033
- Table 3: Global Iron Powder Industry Revenue Billion Forecast, by End-User 2020 & 2033
- Table 4: Global Iron Powder Industry Volume K Tons Forecast, by End-User 2020 & 2033
- Table 5: Global Iron Powder Industry Revenue Billion Forecast, by Region 2020 & 2033
- Table 6: Global Iron Powder Industry Volume K Tons Forecast, by Region 2020 & 2033
- Table 7: Global Iron Powder Industry Revenue Billion Forecast, by Type 2020 & 2033
- Table 8: Global Iron Powder Industry Volume K Tons Forecast, by Type 2020 & 2033
- Table 9: Global Iron Powder Industry Revenue Billion Forecast, by End-User 2020 & 2033
- Table 10: Global Iron Powder Industry Volume K Tons Forecast, by End-User 2020 & 2033
- Table 11: Global Iron Powder Industry Revenue Billion Forecast, by Country 2020 & 2033
- Table 12: Global Iron Powder Industry Volume K Tons Forecast, by Country 2020 & 2033
- Table 13: China Iron Powder Industry Revenue (Billion) Forecast, by Application 2020 & 2033
- Table 14: China Iron Powder Industry Volume (K Tons) Forecast, by Application 2020 & 2033
- Table 15: India Iron Powder Industry Revenue (Billion) Forecast, by Application 2020 & 2033
- Table 16: India Iron Powder Industry Volume (K Tons) Forecast, by Application 2020 & 2033
- Table 17: Japan Iron Powder Industry Revenue (Billion) Forecast, by Application 2020 & 2033
- Table 18: Japan Iron Powder Industry Volume (K Tons) Forecast, by Application 2020 & 2033
- Table 19: South Korea Iron Powder Industry Revenue (Billion) Forecast, by Application 2020 & 2033
- Table 20: South Korea Iron Powder Industry Volume (K Tons) Forecast, by Application 2020 & 2033
- Table 21: Rest of Asia Pacific Iron Powder Industry Revenue (Billion) Forecast, by Application 2020 & 2033
- Table 22: Rest of Asia Pacific Iron Powder Industry Volume (K Tons) Forecast, by Application 2020 & 2033
- Table 23: Global Iron Powder Industry Revenue Billion Forecast, by Type 2020 & 2033
- Table 24: Global Iron Powder Industry Volume K Tons Forecast, by Type 2020 & 2033
- Table 25: Global Iron Powder Industry Revenue Billion Forecast, by End-User 2020 & 2033
- Table 26: Global Iron Powder Industry Volume K Tons Forecast, by End-User 2020 & 2033
- Table 27: Global Iron Powder Industry Revenue Billion Forecast, by Country 2020 & 2033
- Table 28: Global Iron Powder Industry Volume K Tons Forecast, by Country 2020 & 2033
- Table 29: United States Iron Powder Industry Revenue (Billion) Forecast, by Application 2020 & 2033
- Table 30: United States Iron Powder Industry Volume (K Tons) Forecast, by Application 2020 & 2033
- Table 31: Canada Iron Powder Industry Revenue (Billion) Forecast, by Application 2020 & 2033
- Table 32: Canada Iron Powder Industry Volume (K Tons) Forecast, by Application 2020 & 2033
- Table 33: Mexico Iron Powder Industry Revenue (Billion) Forecast, by Application 2020 & 2033
- Table 34: Mexico Iron Powder Industry Volume (K Tons) Forecast, by Application 2020 & 2033
- Table 35: Global Iron Powder Industry Revenue Billion Forecast, by Type 2020 & 2033
- Table 36: Global Iron Powder Industry Volume K Tons Forecast, by Type 2020 & 2033
- Table 37: Global Iron Powder Industry Revenue Billion Forecast, by End-User 2020 & 2033
- Table 38: Global Iron Powder Industry Volume K Tons Forecast, by End-User 2020 & 2033
- Table 39: Global Iron Powder Industry Revenue Billion Forecast, by Country 2020 & 2033
- Table 40: Global Iron Powder Industry Volume K Tons Forecast, by Country 2020 & 2033
- Table 41: United Kingdom Iron Powder Industry Revenue (Billion) Forecast, by Application 2020 & 2033
- Table 42: United Kingdom Iron Powder Industry Volume (K Tons) Forecast, by Application 2020 & 2033
- Table 43: France Iron Powder Industry Revenue (Billion) Forecast, by Application 2020 & 2033
- Table 44: France Iron Powder Industry Volume (K Tons) Forecast, by Application 2020 & 2033
- Table 45: Germany Iron Powder Industry Revenue (Billion) Forecast, by Application 2020 & 2033
- Table 46: Germany Iron Powder Industry Volume (K Tons) Forecast, by Application 2020 & 2033
- Table 47: Italy Iron Powder Industry Revenue (Billion) Forecast, by Application 2020 & 2033
- Table 48: Italy Iron Powder Industry Volume (K Tons) Forecast, by Application 2020 & 2033
- Table 49: Rest of Europe Iron Powder Industry Revenue (Billion) Forecast, by Application 2020 & 2033
- Table 50: Rest of Europe Iron Powder Industry Volume (K Tons) Forecast, by Application 2020 & 2033
- Table 51: Global Iron Powder Industry Revenue Billion Forecast, by Type 2020 & 2033
- Table 52: Global Iron Powder Industry Volume K Tons Forecast, by Type 2020 & 2033
- Table 53: Global Iron Powder Industry Revenue Billion Forecast, by End-User 2020 & 2033
- Table 54: Global Iron Powder Industry Volume K Tons Forecast, by End-User 2020 & 2033
- Table 55: Global Iron Powder Industry Revenue Billion Forecast, by Country 2020 & 2033
- Table 56: Global Iron Powder Industry Volume K Tons Forecast, by Country 2020 & 2033
- Table 57: Brazil Iron Powder Industry Revenue (Billion) Forecast, by Application 2020 & 2033
- Table 58: Brazil Iron Powder Industry Volume (K Tons) Forecast, by Application 2020 & 2033
- Table 59: Argentina Iron Powder Industry Revenue (Billion) Forecast, by Application 2020 & 2033
- Table 60: Argentina Iron Powder Industry Volume (K Tons) Forecast, by Application 2020 & 2033
- Table 61: Rest of South America Iron Powder Industry Revenue (Billion) Forecast, by Application 2020 & 2033
- Table 62: Rest of South America Iron Powder Industry Volume (K Tons) Forecast, by Application 2020 & 2033
- Table 63: Global Iron Powder Industry Revenue Billion Forecast, by Type 2020 & 2033
- Table 64: Global Iron Powder Industry Volume K Tons Forecast, by Type 2020 & 2033
- Table 65: Global Iron Powder Industry Revenue Billion Forecast, by End-User 2020 & 2033
- Table 66: Global Iron Powder Industry Volume K Tons Forecast, by End-User 2020 & 2033
- Table 67: Global Iron Powder Industry Revenue Billion Forecast, by Country 2020 & 2033
- Table 68: Global Iron Powder Industry Volume K Tons Forecast, by Country 2020 & 2033
- Table 69: Saudi Arabia Iron Powder Industry Revenue (Billion) Forecast, by Application 2020 & 2033
- Table 70: Saudi Arabia Iron Powder Industry Volume (K Tons) Forecast, by Application 2020 & 2033
- Table 71: South Africa Iron Powder Industry Revenue (Billion) Forecast, by Application 2020 & 2033
- Table 72: South Africa Iron Powder Industry Volume (K Tons) Forecast, by Application 2020 & 2033
- Table 73: Rest of Middle East and Africa Iron Powder Industry Revenue (Billion) Forecast, by Application 2020 & 2033
- Table 74: Rest of Middle East and Africa Iron Powder Industry Volume (K Tons) Forecast, by Application 2020 & 2033
Frequently Asked Questions
1. What is the projected Compound Annual Growth Rate (CAGR) of the Iron Powder Industry?
The projected CAGR is approximately 5.2%.
2. Which companies are prominent players in the Iron Powder Industry?
Key companies in the market include Hoganas AB, American Elements, KOBE STEEL LTD, INDUSTRIAL METAL POWDERS (INDIA) PVT LTD, Laiwu Iron & Steel Group Lunan Mining Co Ltd, ATI, Ashland, Belmont Metals, BASF SE, Rio Tinto Metal Powders, CNPC POWDER, JFE Steel Corporation, Pometon Powder.
3. What are the main segments of the Iron Powder Industry?
The market segments include Type, End-User.
4. Can you provide details about the market size?
The market size is estimated to be USD 6.43 Billion as of 2022.
5. What are some drivers contributing to market growth?
Increasing Demand for Iron Powders from the Automotive Industry; Other Drivers.
6. What are the notable trends driving market growth?
High Demand from Automotive Segment.
7. Are there any restraints impacting market growth?
High Cost of Production; Other Restraints.
8. Can you provide examples of recent developments in the market?
January 2023: JFE Steel completed the acquisition of the ISO 45001 certification, an international standard for occupational health and safety management systems, for all of its Japan operations.
9. What pricing options are available for accessing the report?
Pricing options include single-user, multi-user, and enterprise licenses priced at USD 4750, USD 5250, and USD 8750 respectively.
10. Is the market size provided in terms of value or volume?
The market size is provided in terms of value, measured in Billion and volume, measured in K Tons.
11. Are there any specific market keywords associated with the report?
Yes, the market keyword associated with the report is "Iron Powder Industry," which aids in identifying and referencing the specific market segment covered.
12. How do I determine which pricing option suits my needs best?
The pricing options vary based on user requirements and access needs. Individual users may opt for single-user licenses, while businesses requiring broader access may choose multi-user or enterprise licenses for cost-effective access to the report.
13. Are there any additional resources or data provided in the Iron Powder Industry report?
While the report offers comprehensive insights, it's advisable to review the specific contents or supplementary materials provided to ascertain if additional resources or data are available.
14. How can I stay updated on further developments or reports in the Iron Powder Industry?
To stay informed about further developments, trends, and reports in the Iron Powder Industry, consider subscribing to industry newsletters, following relevant companies and organizations, or regularly checking reputable industry news sources and publications.
Methodology
Step 1 - Identification of Relevant Samples Size from Population Database


Step 2 - Approaches for Defining Global Market Size (Value, Volume* & Price*)

Note*: In applicable scenarios
Step 3 - Data Sources
Primary Research
- Web Analytics
- Survey Reports
- Research Institute
- Latest Research Reports
- Opinion Leaders
Secondary Research
- Annual Reports
- White Paper
- Latest Press Release
- Industry Association
- Paid Database
- Investor Presentations

Step 4 - Data Triangulation
Involves using different sources of information in order to increase the validity of a study
These sources are likely to be stakeholders in a program - participants, other researchers, program staff, other community members, and so on.
Then we put all data in single framework & apply various statistical tools to find out the dynamic on the market.
During the analysis stage, feedback from the stakeholder groups would be compared to determine areas of agreement as well as areas of divergence