

Key Insights
The industrial water treatment chemicals market is experiencing robust growth, projected to reach a significant market value. The 6.04% CAGR from 2019 to 2024 indicates a consistently expanding market driven by several key factors. Increasing industrialization and urbanization necessitate efficient water management solutions, fueling demand for advanced water treatment chemicals. Stringent environmental regulations worldwide are pushing industries to adopt cleaner production processes, further boosting market growth. The rising awareness about water scarcity and the need for sustainable water usage are also significant drivers. Key market segments include coagulants, flocculants, biocides, scale inhibitors, and corrosion inhibitors, each exhibiting unique growth trajectories influenced by specific industry demands and technological advancements. Major players like BWA Water Additives, Chemifloc, Kemira, and others are actively involved in research and development, introducing innovative products to cater to evolving market needs and enhance their competitiveness. This dynamic market presents lucrative opportunities for businesses committed to providing effective, sustainable, and environmentally friendly water treatment solutions.
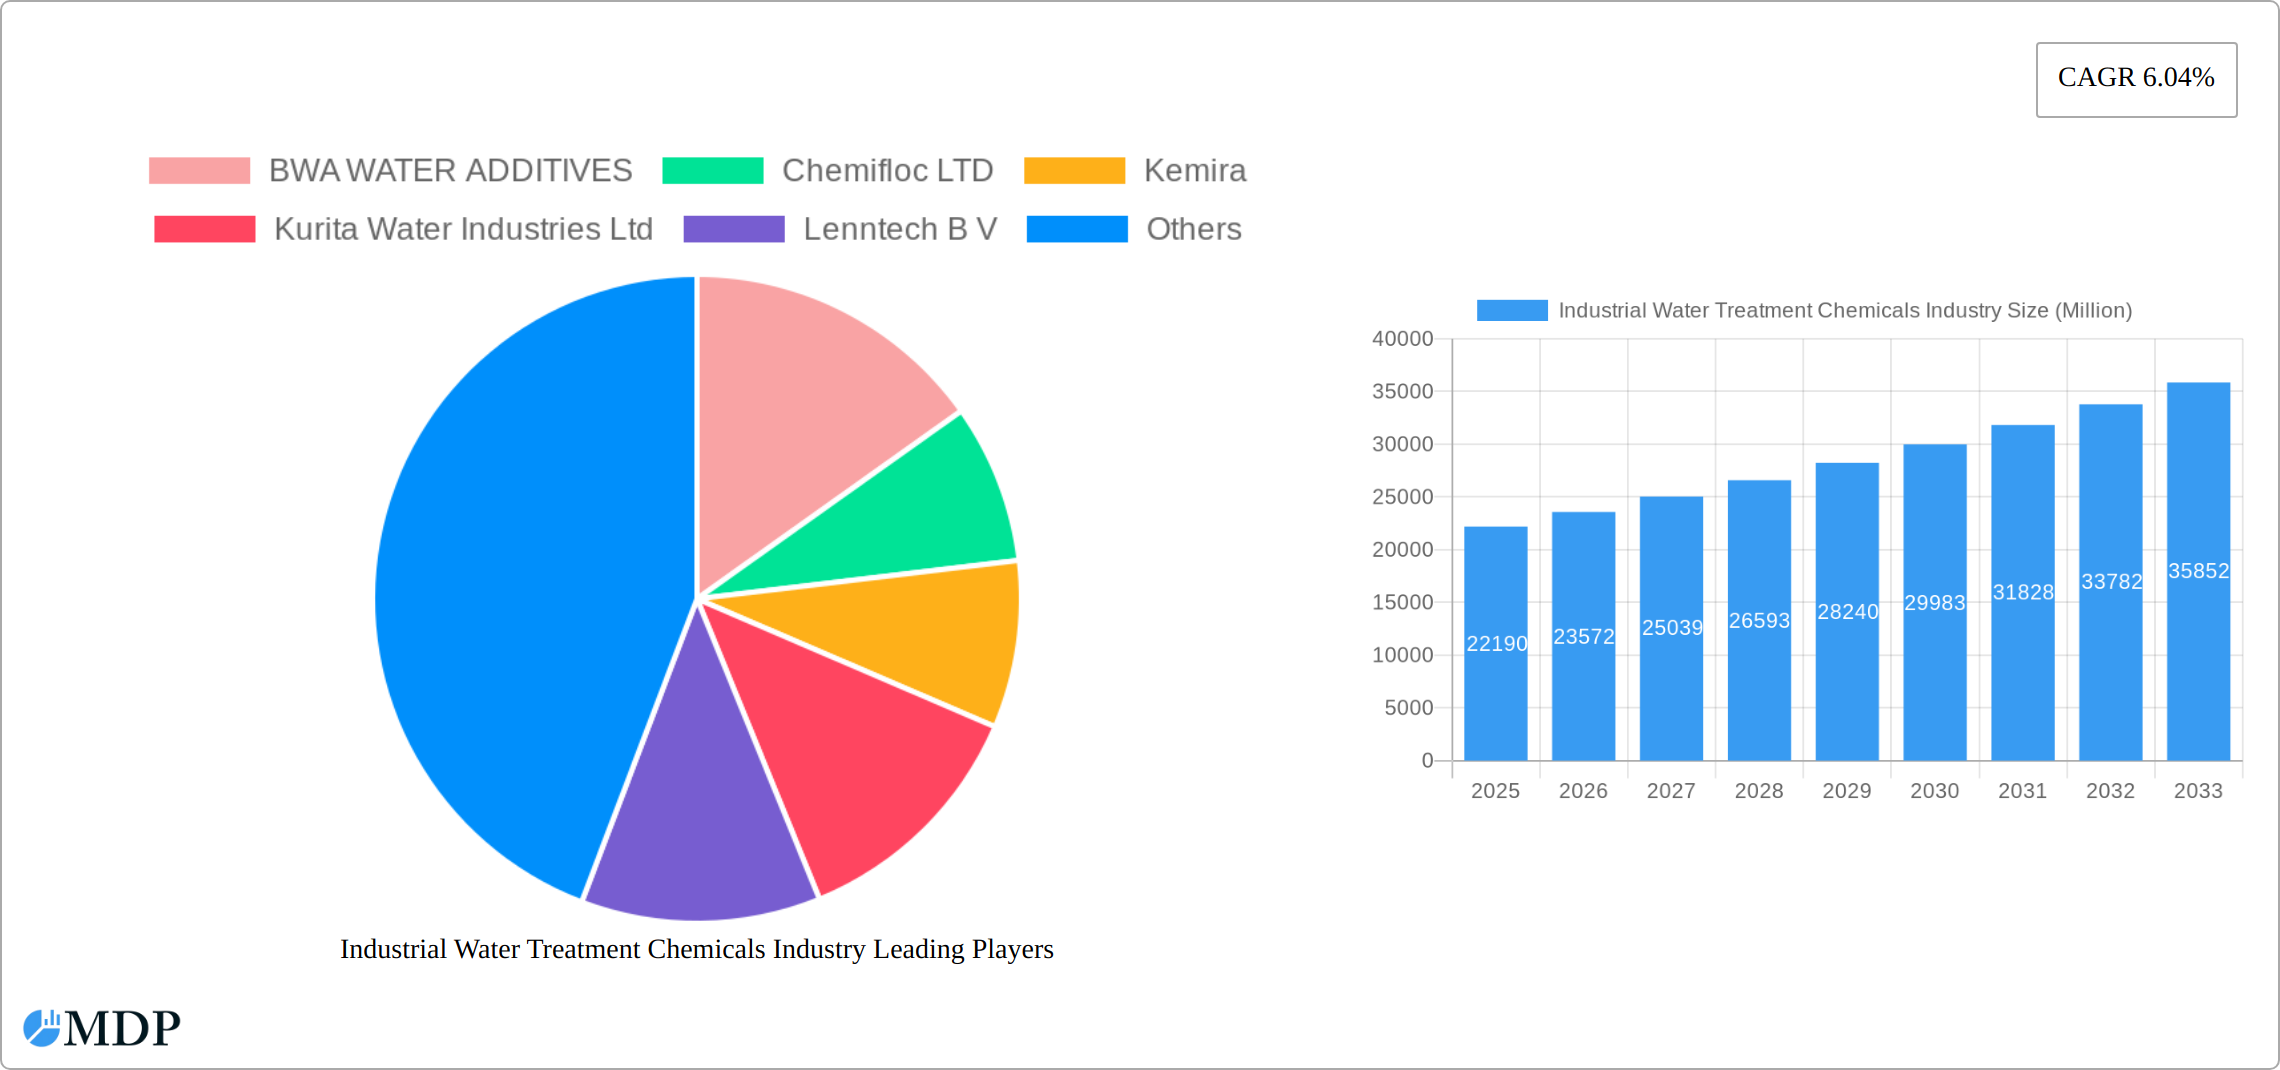
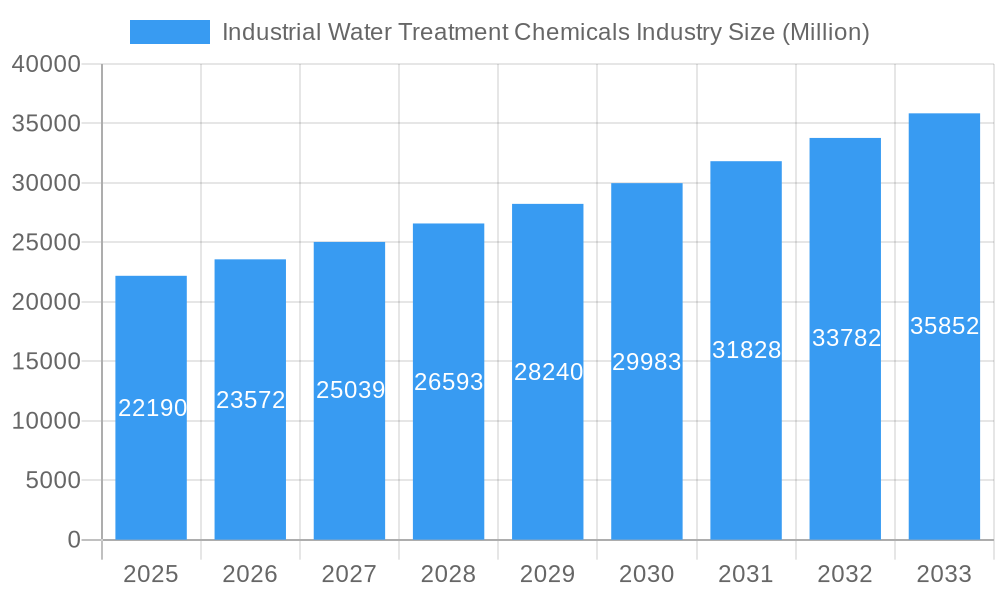
Industrial Water Treatment Chemicals Industry Market Size (In Billion)
The forecast period (2025-2033) anticipates continued growth, propelled by ongoing industrial expansion, particularly in emerging economies. Technological advancements in water treatment technologies, such as membrane filtration and advanced oxidation processes, are contributing to market expansion. The focus on energy efficiency and reduced chemical usage will shape future product development. While challenges such as fluctuating raw material prices and stringent regulatory compliance exist, the overall outlook for the industrial water treatment chemicals market remains positive. Market segmentation by chemical type, application, and region will continue to provide insights into specific growth pockets and aid strategic decision-making. The market’s future success hinges on the ability of companies to innovate, adapt to evolving regulations, and offer sustainable solutions that address the global demand for efficient and environmentally responsible water management.
Industrial Water Treatment Chemicals Industry Company Market Share
Industrial Water Treatment Chemicals Market Report: 2019-2033 Forecast
This comprehensive report provides an in-depth analysis of the Industrial Water Treatment Chemicals market, offering invaluable insights for stakeholders across the value chain. The study period covers 2019-2033, with a base year of 2025 and a forecast period of 2025-2033. The report leverages extensive market research and data analysis to provide actionable intelligence, covering key trends, leading players, and future growth opportunities. The global market is expected to reach xx Million by 2033.
Industrial Water Treatment Chemicals Industry Market Dynamics & Concentration
The Industrial Water Treatment Chemicals market is a dynamic and evolving landscape, marked by a moderate level of concentration with a blend of influential global players and agile specialized firms. Key industry leaders such as Kemira, Kurita Water Industries Ltd., Ecolab, Solenis, SNF, and SUEZ command significant market share due to their extensive product portfolios, global reach, and established customer relationships. However, the market also benefits from the contributions of numerous smaller, highly specialized companies and regional distributors that cater to niche applications and local demands. The degree of market concentration is a complex interplay of factors including the realization of economies of scale in production and distribution, continuous advancements in treatment technologies, and the imperative of adhering to increasingly stringent environmental and safety regulations. A major catalyst for market evolution is the relentless pursuit of innovation, particularly in developing sustainable, cost-effective, and environmentally benign water treatment solutions. This drive fuels substantial investment in research and development. Furthermore, the escalating global challenge of water scarcity, coupled with progressively rigorous environmental legislation, is fundamentally reshaping market dynamics. While product substitutes like advanced membrane filtration technologies present a competitive challenge, the persistent growth in industrialization and urbanization across the globe continues to be a robust driver for the demand for sophisticated and efficient water treatment solutions.
- Strategic Mergers & Acquisitions: The past five years have been characterized by significant consolidation activity, with approximately [Insert Specific Number] M&A deals recorded. These transactions are primarily driven by companies seeking to broaden their market presence, enhance their product offerings, and gain access to new technologies and geographical regions.
- Market Share Landscape (2024): The top 5 industry players collectively held an estimated [Insert Specific Percentage]% of the global market share in 2024, underscoring their dominant influence.
- Notable Acquisitions & Their Impact: Key transactions, such as Solenis's acquisition of Diversey for USD 4.6 billion in March 2023 and Shrieve Chemical Company's acquisition of Chem One in January 2023, exemplify the ongoing consolidation trend and the strategic imperative for market leaders to strengthen their competitive positions.
Industrial Water Treatment Chemicals Industry Industry Trends & Analysis
The Industrial Water Treatment Chemicals market is on a trajectory of robust and sustained growth, propelled by a confluence of powerful global trends. The market is projected to expand at a Compound Annual Growth Rate (CAGR) of [Insert Specific Percentage]% during the forecast period (2025-2033). This impressive growth is primarily attributed to the relentless pace of industrialization worldwide, the implementation of increasingly stringent environmental regulations governing water quality and discharge, and a heightened global awareness regarding the critical importance of water conservation. Technological innovation is a significant enabler, with advancements in areas such as nanotechnology, advanced oxidation processes (AOPs), and digitalization leading to the development of more efficient, sustainable, and intelligent water treatment solutions. Shifting consumer and industrial preferences towards eco-friendly products and processes are also contributing to market expansion. The competitive landscape is intensifying, with both established multinational corporations and agile new entrants driving product innovation and influencing pricing strategies. Emerging economies are poised for substantial market penetration, fueled by escalating industrial activity and proactive government investments in upgrading water and wastewater infrastructure. This report provides an in-depth analysis of these critical trends, their direct and indirect impacts on market dynamics, and offers specific quantitative metrics on market penetration across diverse geographical regions and industry segments.
Leading Markets & Segments in Industrial Water Treatment Chemicals Industry
The Asia-Pacific region currently stands as the dominant force in the global Industrial Water Treatment Chemicals market. This leadership is primarily driven by the region's rapid and sustained industrialization, accelerating urbanization, and significant ongoing investments in developing and upgrading water and wastewater infrastructure. These factors collectively create an immense and growing demand for effective water treatment solutions.
Key Drivers for Asia-Pacific's Dominance:
- Unprecedented Industrial Growth: The surge in manufacturing output and the expansion of diverse industrial sectors across Asia-Pacific create a substantial and continuous demand for water treatment chemicals to manage process water and effluent.
- Strengthening Environmental Governance: Governments throughout the region are progressively enacting and enforcing stricter regulations concerning water pollution and discharge standards, directly necessitating the adoption of advanced water treatment technologies and chemicals.
- Proactive Government Initiatives: Significant public and private sector investments in building and modernizing water infrastructure, including the construction of wastewater treatment plants and water recycling facilities, are a major catalyst for market growth.
Country-Specific Market Performance: Within the dynamic Asia-Pacific landscape, China and India emerge as the leading national markets. In 2024, China's market value was estimated at [Insert Specific Value] Million, closely followed by India at [Insert Specific Value] Million. A granular analysis of market segments reveals that the industrial sector, particularly the power generation and general manufacturing sub-segments, holds the largest market share. This is attributable to their high water consumption rates and the stringent regulatory requirements for treated wastewater discharge.
Industrial Water Treatment Chemicals Industry Product Developments
Recent innovations in Industrial Water Treatment Chemicals focus on enhanced performance, reduced environmental impact, and cost-effectiveness. This includes the development of environmentally friendly coagulants, flocculants, and biocides. Advances in nanotechnology are resulting in more efficient and targeted treatment solutions. Companies are also focusing on developing customized solutions to meet the specific needs of various industrial applications, boosting market penetration and strengthening their competitive position. These innovations are aligning with global sustainability initiatives and stricter environmental standards.
Key Drivers of Industrial Water Treatment Chemicals Industry Growth
Several key factors are driving the growth of the Industrial Water Treatment Chemicals market. These include:
- Increasing Industrialization: The expansion of various industries, particularly manufacturing, power generation, and food processing, significantly increases demand for water treatment solutions.
- Stringent Environmental Regulations: Governments worldwide are implementing stricter regulations to curb water pollution, boosting adoption of advanced treatment technologies.
- Water Scarcity: Growing water scarcity in many regions is driving demand for efficient water treatment and reuse solutions.
- Technological Advancements: Innovations in water treatment technologies are enhancing efficiency, reducing costs, and minimizing environmental impact.
Challenges in the Industrial Water Treatment Chemicals Industry Market
The Industrial Water Treatment Chemicals market faces several challenges:
- Fluctuating Raw Material Prices: Price volatility of raw materials, such as polymers and chemicals, impacts profitability and can lead to price increases for end-users.
- Stringent Regulatory Compliance: Meeting stringent environmental regulations and safety standards across various regions can be costly and complex.
- Intense Competition: The presence of numerous established players and new entrants creates a highly competitive environment, impacting pricing and margins.
- Supply Chain Disruptions: Global events can lead to supply chain disruptions affecting the availability and cost of raw materials. This impact is estimated to be xx% in 2024.
Emerging Opportunities in Industrial Water Treatment Chemicals Industry
Several factors present significant opportunities for long-term growth:
- Sustainable Solutions: Increasing demand for environmentally friendly water treatment chemicals is creating opportunities for companies to develop and market sustainable products.
- Technological Advancements: Continuous innovations in areas such as membrane technology, advanced oxidation processes, and nanotechnology are opening up new avenues for market expansion.
- Strategic Partnerships: Collaborations among chemical manufacturers, technology providers, and water treatment service companies can lead to innovative solutions and accelerated market penetration.
- Market Expansion in Emerging Economies: Untapped markets in developing nations present substantial growth potential, particularly in regions with rapid industrialization.
Leading Players in the Industrial Water Treatment Chemicals Industry Sector
- BWA WATER ADDITIVES
- Chemifloc LTD
- Kemira
- Kurita Water Industries Ltd
- Lenntech B V
- Lonza
- DuPont de Nemours Inc
- Ecolab
- SNF
- Solenis
- SUEZ
Key Milestones in Industrial Water Treatment Chemicals Industry Industry
- March 2023: Solenis acquired Diversey for USD 4.6 billion, significantly expanding its market share and product portfolio in industrial water treatment.
- January 2023: Shrieve Chemical Company acquired Chem One, broadening its product range and distribution network in the North American market for water treatment chemicals.
Strategic Outlook for Industrial Water Treatment Chemicals Market
The Industrial Water Treatment Chemicals market is poised for significant growth in the coming years, driven by a confluence of factors including increasing industrialization, stringent environmental regulations, and technological advancements. Companies that focus on developing sustainable and innovative water treatment solutions, strategically expand into emerging markets, and build strong partnerships will be well-positioned to capitalize on the numerous opportunities presented. The long-term potential of this market is considerable, particularly given the growing global awareness of water scarcity and the imperative for sustainable water management practices.
Industrial Water Treatment Chemicals Industry Segmentation
-
1. Product Type
- 1.1. Antifoams
- 1.2. Oxygen Scavengers
- 1.3. Corrosion Inhibitors
- 1.4. Biocides and Disinfactants
- 1.5. Oxidants
- 1.6. pH Conditioners
- 1.7. Sludge Conditioners
- 1.8. Scale inhibitors
- 1.9. Other Product Types
-
2. End-user Industry
- 2.1. Oil and Gas
- 2.2. Power
- 2.3. Paper
- 2.4. Metal and mining
- 2.5. Chemical
- 2.6. Other End-user Industries
Industrial Water Treatment Chemicals Industry Segmentation By Geography
-
1. North America
- 1.1. United States
- 1.2. Mexico
- 1.3. Canada
-
2. Europe
- 2.1. Germany
- 2.2. United Kingdom
- 2.3. France
- 2.4. Italy
- 2.5. Rest of Europe
-
3. Asia Pacific
- 3.1. China
- 3.2. India
- 3.3. Japan
- 3.4. South Korea
- 3.5. Rest of Asia Pacific
-
4. South America
- 4.1. Brazil
- 4.2. Argentina
- 4.3. Rest of South America
-
5. Middle East and Africa
- 5.1. Saudi Arabia
- 5.2. South Africa
- 5.3. United Arab Emirates
- 5.4. Rest of Middle East and Africa
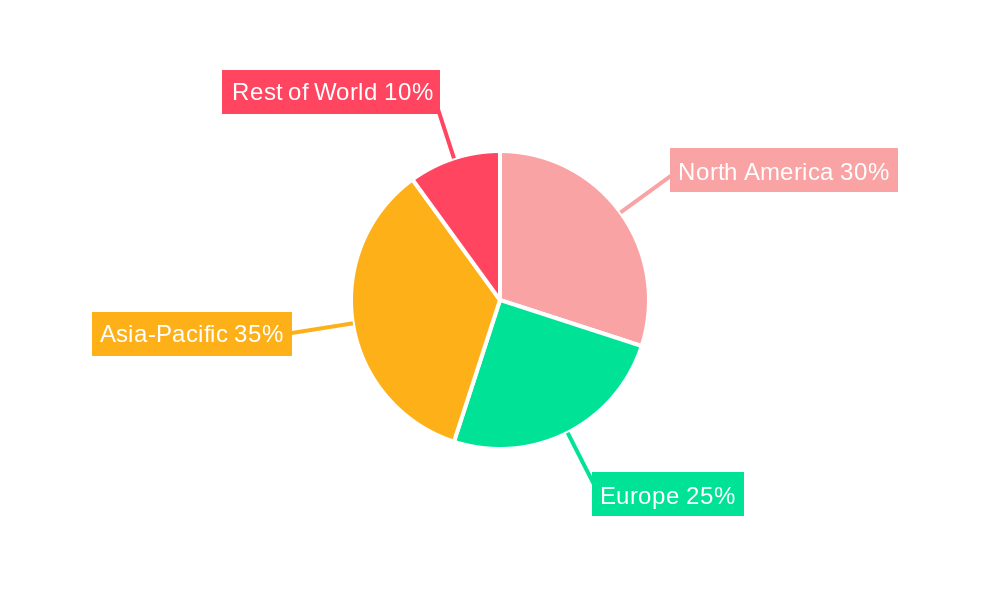
Industrial Water Treatment Chemicals Industry Regional Market Share
Geographic Coverage of Industrial Water Treatment Chemicals Industry
Industrial Water Treatment Chemicals Industry REPORT HIGHLIGHTS
| Aspects | Details |
|---|---|
| Study Period | 2020-2034 |
| Base Year | 2025 |
| Estimated Year | 2026 |
| Forecast Period | 2026-2034 |
| Historical Period | 2020-2025 |
| Growth Rate | CAGR of 6.04% from 2020-2034 |
| Segmentation |
|
Table of Contents
- 1. Introduction
- 1.1. Research Scope
- 1.2. Market Segmentation
- 1.3. Research Objective
- 1.4. Definitions and Assumptions
- 2. Executive Summary
- 2.1. Market Snapshot
- 3. Market Dynamics
- 3.1. Market Drivers
- 3.2. Market Restrains
- 3.3. Market Trends
- 3.4. Market Opportunities
- 4. Market Factor Analysis
- 4.1. Porters Five Forces
- 4.1.1. Bargaining Power of Suppliers
- 4.1.2. Bargaining Power of Buyers
- 4.1.3. Threat of New Entrants
- 4.1.4. Threat of Substitutes
- 4.1.5. Competitive Rivalry
- 4.2. PESTEL analysis
- 4.3. BCG Analysis
- 4.3.1. Stars (High Growth, High Market Share)
- 4.3.2. Cash Cows (Low Growth, High Market Share)
- 4.3.3. Question Mark (High Growth, Low Market Share)
- 4.3.4. Dogs (Low Growth, Low Market Share)
- 4.4. Ansoff Matrix Analysis
- 4.5. Supply Chain Analysis
- 4.6. Regulatory Landscape
- 4.7. Current Market Potential and Opportunity Assessment (TAM–SAM–SOM Framework)
- 4.8. MDP Analyst Note
- 4.1. Porters Five Forces
- 5. Market Analysis, Insights and Forecast 2021-2033
- 5.1. Market Analysis, Insights and Forecast - by Product Type
- 5.1.1. Antifoams
- 5.1.2. Oxygen Scavengers
- 5.1.3. Corrosion Inhibitors
- 5.1.4. Biocides and Disinfactants
- 5.1.5. Oxidants
- 5.1.6. pH Conditioners
- 5.1.7. Sludge Conditioners
- 5.1.8. Scale inhibitors
- 5.1.9. Other Product Types
- 5.2. Market Analysis, Insights and Forecast - by End-user Industry
- 5.2.1. Oil and Gas
- 5.2.2. Power
- 5.2.3. Paper
- 5.2.4. Metal and mining
- 5.2.5. Chemical
- 5.2.6. Other End-user Industries
- 5.3. Market Analysis, Insights and Forecast - by Region
- 5.3.1. North America
- 5.3.2. Europe
- 5.3.3. Asia Pacific
- 5.3.4. South America
- 5.3.5. Middle East and Africa
- 5.1. Market Analysis, Insights and Forecast - by Product Type
- 6. Global Industrial Water Treatment Chemicals Industry Analysis, Insights and Forecast, 2021-2033
- 6.1. Market Analysis, Insights and Forecast - by Product Type
- 6.1.1. Antifoams
- 6.1.2. Oxygen Scavengers
- 6.1.3. Corrosion Inhibitors
- 6.1.4. Biocides and Disinfactants
- 6.1.5. Oxidants
- 6.1.6. pH Conditioners
- 6.1.7. Sludge Conditioners
- 6.1.8. Scale inhibitors
- 6.1.9. Other Product Types
- 6.2. Market Analysis, Insights and Forecast - by End-user Industry
- 6.2.1. Oil and Gas
- 6.2.2. Power
- 6.2.3. Paper
- 6.2.4. Metal and mining
- 6.2.5. Chemical
- 6.2.6. Other End-user Industries
- 6.1. Market Analysis, Insights and Forecast - by Product Type
- 7. North America Industrial Water Treatment Chemicals Industry Analysis, Insights and Forecast, 2020-2032
- 7.1. Market Analysis, Insights and Forecast - by Product Type
- 7.1.1. Antifoams
- 7.1.2. Oxygen Scavengers
- 7.1.3. Corrosion Inhibitors
- 7.1.4. Biocides and Disinfactants
- 7.1.5. Oxidants
- 7.1.6. pH Conditioners
- 7.1.7. Sludge Conditioners
- 7.1.8. Scale inhibitors
- 7.1.9. Other Product Types
- 7.2. Market Analysis, Insights and Forecast - by End-user Industry
- 7.2.1. Oil and Gas
- 7.2.2. Power
- 7.2.3. Paper
- 7.2.4. Metal and mining
- 7.2.5. Chemical
- 7.2.6. Other End-user Industries
- 7.1. Market Analysis, Insights and Forecast - by Product Type
- 8. Europe Industrial Water Treatment Chemicals Industry Analysis, Insights and Forecast, 2020-2032
- 8.1. Market Analysis, Insights and Forecast - by Product Type
- 8.1.1. Antifoams
- 8.1.2. Oxygen Scavengers
- 8.1.3. Corrosion Inhibitors
- 8.1.4. Biocides and Disinfactants
- 8.1.5. Oxidants
- 8.1.6. pH Conditioners
- 8.1.7. Sludge Conditioners
- 8.1.8. Scale inhibitors
- 8.1.9. Other Product Types
- 8.2. Market Analysis, Insights and Forecast - by End-user Industry
- 8.2.1. Oil and Gas
- 8.2.2. Power
- 8.2.3. Paper
- 8.2.4. Metal and mining
- 8.2.5. Chemical
- 8.2.6. Other End-user Industries
- 8.1. Market Analysis, Insights and Forecast - by Product Type
- 9. Asia Pacific Industrial Water Treatment Chemicals Industry Analysis, Insights and Forecast, 2020-2032
- 9.1. Market Analysis, Insights and Forecast - by Product Type
- 9.1.1. Antifoams
- 9.1.2. Oxygen Scavengers
- 9.1.3. Corrosion Inhibitors
- 9.1.4. Biocides and Disinfactants
- 9.1.5. Oxidants
- 9.1.6. pH Conditioners
- 9.1.7. Sludge Conditioners
- 9.1.8. Scale inhibitors
- 9.1.9. Other Product Types
- 9.2. Market Analysis, Insights and Forecast - by End-user Industry
- 9.2.1. Oil and Gas
- 9.2.2. Power
- 9.2.3. Paper
- 9.2.4. Metal and mining
- 9.2.5. Chemical
- 9.2.6. Other End-user Industries
- 9.1. Market Analysis, Insights and Forecast - by Product Type
- 10. South America Industrial Water Treatment Chemicals Industry Analysis, Insights and Forecast, 2020-2032
- 10.1. Market Analysis, Insights and Forecast - by Product Type
- 10.1.1. Antifoams
- 10.1.2. Oxygen Scavengers
- 10.1.3. Corrosion Inhibitors
- 10.1.4. Biocides and Disinfactants
- 10.1.5. Oxidants
- 10.1.6. pH Conditioners
- 10.1.7. Sludge Conditioners
- 10.1.8. Scale inhibitors
- 10.1.9. Other Product Types
- 10.2. Market Analysis, Insights and Forecast - by End-user Industry
- 10.2.1. Oil and Gas
- 10.2.2. Power
- 10.2.3. Paper
- 10.2.4. Metal and mining
- 10.2.5. Chemical
- 10.2.6. Other End-user Industries
- 10.1. Market Analysis, Insights and Forecast - by Product Type
- 11. Middle East and Africa Industrial Water Treatment Chemicals Industry Analysis, Insights and Forecast, 2020-2032
- 11.1. Market Analysis, Insights and Forecast - by Product Type
- 11.1.1. Antifoams
- 11.1.2. Oxygen Scavengers
- 11.1.3. Corrosion Inhibitors
- 11.1.4. Biocides and Disinfactants
- 11.1.5. Oxidants
- 11.1.6. pH Conditioners
- 11.1.7. Sludge Conditioners
- 11.1.8. Scale inhibitors
- 11.1.9. Other Product Types
- 11.2. Market Analysis, Insights and Forecast - by End-user Industry
- 11.2.1. Oil and Gas
- 11.2.2. Power
- 11.2.3. Paper
- 11.2.4. Metal and mining
- 11.2.5. Chemical
- 11.2.6. Other End-user Industries
- 11.1. Market Analysis, Insights and Forecast - by Product Type
- 12. Competitive Analysis
- 12.1. Company Profiles
- 12.1.1 BWA WATER ADDITIVES
- 12.1.1.1. Company Overview
- 12.1.1.2. Products
- 12.1.1.3. Company Financials
- 12.1.1.4. SWOT Analysis
- 12.1.2 Chemifloc LTD
- 12.1.2.1. Company Overview
- 12.1.2.2. Products
- 12.1.2.3. Company Financials
- 12.1.2.4. SWOT Analysis
- 12.1.3 Kemira
- 12.1.3.1. Company Overview
- 12.1.3.2. Products
- 12.1.3.3. Company Financials
- 12.1.3.4. SWOT Analysis
- 12.1.4 Kurita Water Industries Ltd
- 12.1.4.1. Company Overview
- 12.1.4.2. Products
- 12.1.4.3. Company Financials
- 12.1.4.4. SWOT Analysis
- 12.1.5 Lenntech B V
- 12.1.5.1. Company Overview
- 12.1.5.2. Products
- 12.1.5.3. Company Financials
- 12.1.5.4. SWOT Analysis
- 12.1.6 Lonza
- 12.1.6.1. Company Overview
- 12.1.6.2. Products
- 12.1.6.3. Company Financials
- 12.1.6.4. SWOT Analysis
- 12.1.7 DuPont de Nemours Inc
- 12.1.7.1. Company Overview
- 12.1.7.2. Products
- 12.1.7.3. Company Financials
- 12.1.7.4. SWOT Analysis
- 12.1.8 Ecolab
- 12.1.8.1. Company Overview
- 12.1.8.2. Products
- 12.1.8.3. Company Financials
- 12.1.8.4. SWOT Analysis
- 12.1.9 SNF
- 12.1.9.1. Company Overview
- 12.1.9.2. Products
- 12.1.9.3. Company Financials
- 12.1.9.4. SWOT Analysis
- 12.1.10 Solenis
- 12.1.10.1. Company Overview
- 12.1.10.2. Products
- 12.1.10.3. Company Financials
- 12.1.10.4. SWOT Analysis
- 12.1.11 SUEZ*List Not Exhaustive
- 12.1.11.1. Company Overview
- 12.1.11.2. Products
- 12.1.11.3. Company Financials
- 12.1.11.4. SWOT Analysis
- 12.1.1 BWA WATER ADDITIVES
- 12.2. Market Entropy
- 12.2.1 Company's Key Areas Served
- 12.2.2 Recent Developments
- 12.3. Company Market Share Analysis 2025
- 12.3.1 Top 5 Companies Market Share Analysis
- 12.3.2 Top 3 Companies Market Share Analysis
- 12.4. List of Potential Customers
- 13. Research Methodology
List of Figures
- Figure 1: Global Industrial Water Treatment Chemicals Industry Revenue Breakdown (Million, %) by Region 2025 & 2033
- Figure 2: Global Industrial Water Treatment Chemicals Industry Volume Breakdown (Billion, %) by Region 2025 & 2033
- Figure 3: North America Industrial Water Treatment Chemicals Industry Revenue (Million), by Product Type 2025 & 2033
- Figure 4: North America Industrial Water Treatment Chemicals Industry Volume (Billion), by Product Type 2025 & 2033
- Figure 5: North America Industrial Water Treatment Chemicals Industry Revenue Share (%), by Product Type 2025 & 2033
- Figure 6: North America Industrial Water Treatment Chemicals Industry Volume Share (%), by Product Type 2025 & 2033
- Figure 7: North America Industrial Water Treatment Chemicals Industry Revenue (Million), by End-user Industry 2025 & 2033
- Figure 8: North America Industrial Water Treatment Chemicals Industry Volume (Billion), by End-user Industry 2025 & 2033
- Figure 9: North America Industrial Water Treatment Chemicals Industry Revenue Share (%), by End-user Industry 2025 & 2033
- Figure 10: North America Industrial Water Treatment Chemicals Industry Volume Share (%), by End-user Industry 2025 & 2033
- Figure 11: North America Industrial Water Treatment Chemicals Industry Revenue (Million), by Country 2025 & 2033
- Figure 12: North America Industrial Water Treatment Chemicals Industry Volume (Billion), by Country 2025 & 2033
- Figure 13: North America Industrial Water Treatment Chemicals Industry Revenue Share (%), by Country 2025 & 2033
- Figure 14: North America Industrial Water Treatment Chemicals Industry Volume Share (%), by Country 2025 & 2033
- Figure 15: Europe Industrial Water Treatment Chemicals Industry Revenue (Million), by Product Type 2025 & 2033
- Figure 16: Europe Industrial Water Treatment Chemicals Industry Volume (Billion), by Product Type 2025 & 2033
- Figure 17: Europe Industrial Water Treatment Chemicals Industry Revenue Share (%), by Product Type 2025 & 2033
- Figure 18: Europe Industrial Water Treatment Chemicals Industry Volume Share (%), by Product Type 2025 & 2033
- Figure 19: Europe Industrial Water Treatment Chemicals Industry Revenue (Million), by End-user Industry 2025 & 2033
- Figure 20: Europe Industrial Water Treatment Chemicals Industry Volume (Billion), by End-user Industry 2025 & 2033
- Figure 21: Europe Industrial Water Treatment Chemicals Industry Revenue Share (%), by End-user Industry 2025 & 2033
- Figure 22: Europe Industrial Water Treatment Chemicals Industry Volume Share (%), by End-user Industry 2025 & 2033
- Figure 23: Europe Industrial Water Treatment Chemicals Industry Revenue (Million), by Country 2025 & 2033
- Figure 24: Europe Industrial Water Treatment Chemicals Industry Volume (Billion), by Country 2025 & 2033
- Figure 25: Europe Industrial Water Treatment Chemicals Industry Revenue Share (%), by Country 2025 & 2033
- Figure 26: Europe Industrial Water Treatment Chemicals Industry Volume Share (%), by Country 2025 & 2033
- Figure 27: Asia Pacific Industrial Water Treatment Chemicals Industry Revenue (Million), by Product Type 2025 & 2033
- Figure 28: Asia Pacific Industrial Water Treatment Chemicals Industry Volume (Billion), by Product Type 2025 & 2033
- Figure 29: Asia Pacific Industrial Water Treatment Chemicals Industry Revenue Share (%), by Product Type 2025 & 2033
- Figure 30: Asia Pacific Industrial Water Treatment Chemicals Industry Volume Share (%), by Product Type 2025 & 2033
- Figure 31: Asia Pacific Industrial Water Treatment Chemicals Industry Revenue (Million), by End-user Industry 2025 & 2033
- Figure 32: Asia Pacific Industrial Water Treatment Chemicals Industry Volume (Billion), by End-user Industry 2025 & 2033
- Figure 33: Asia Pacific Industrial Water Treatment Chemicals Industry Revenue Share (%), by End-user Industry 2025 & 2033
- Figure 34: Asia Pacific Industrial Water Treatment Chemicals Industry Volume Share (%), by End-user Industry 2025 & 2033
- Figure 35: Asia Pacific Industrial Water Treatment Chemicals Industry Revenue (Million), by Country 2025 & 2033
- Figure 36: Asia Pacific Industrial Water Treatment Chemicals Industry Volume (Billion), by Country 2025 & 2033
- Figure 37: Asia Pacific Industrial Water Treatment Chemicals Industry Revenue Share (%), by Country 2025 & 2033
- Figure 38: Asia Pacific Industrial Water Treatment Chemicals Industry Volume Share (%), by Country 2025 & 2033
- Figure 39: South America Industrial Water Treatment Chemicals Industry Revenue (Million), by Product Type 2025 & 2033
- Figure 40: South America Industrial Water Treatment Chemicals Industry Volume (Billion), by Product Type 2025 & 2033
- Figure 41: South America Industrial Water Treatment Chemicals Industry Revenue Share (%), by Product Type 2025 & 2033
- Figure 42: South America Industrial Water Treatment Chemicals Industry Volume Share (%), by Product Type 2025 & 2033
- Figure 43: South America Industrial Water Treatment Chemicals Industry Revenue (Million), by End-user Industry 2025 & 2033
- Figure 44: South America Industrial Water Treatment Chemicals Industry Volume (Billion), by End-user Industry 2025 & 2033
- Figure 45: South America Industrial Water Treatment Chemicals Industry Revenue Share (%), by End-user Industry 2025 & 2033
- Figure 46: South America Industrial Water Treatment Chemicals Industry Volume Share (%), by End-user Industry 2025 & 2033
- Figure 47: South America Industrial Water Treatment Chemicals Industry Revenue (Million), by Country 2025 & 2033
- Figure 48: South America Industrial Water Treatment Chemicals Industry Volume (Billion), by Country 2025 & 2033
- Figure 49: South America Industrial Water Treatment Chemicals Industry Revenue Share (%), by Country 2025 & 2033
- Figure 50: South America Industrial Water Treatment Chemicals Industry Volume Share (%), by Country 2025 & 2033
- Figure 51: Middle East and Africa Industrial Water Treatment Chemicals Industry Revenue (Million), by Product Type 2025 & 2033
- Figure 52: Middle East and Africa Industrial Water Treatment Chemicals Industry Volume (Billion), by Product Type 2025 & 2033
- Figure 53: Middle East and Africa Industrial Water Treatment Chemicals Industry Revenue Share (%), by Product Type 2025 & 2033
- Figure 54: Middle East and Africa Industrial Water Treatment Chemicals Industry Volume Share (%), by Product Type 2025 & 2033
- Figure 55: Middle East and Africa Industrial Water Treatment Chemicals Industry Revenue (Million), by End-user Industry 2025 & 2033
- Figure 56: Middle East and Africa Industrial Water Treatment Chemicals Industry Volume (Billion), by End-user Industry 2025 & 2033
- Figure 57: Middle East and Africa Industrial Water Treatment Chemicals Industry Revenue Share (%), by End-user Industry 2025 & 2033
- Figure 58: Middle East and Africa Industrial Water Treatment Chemicals Industry Volume Share (%), by End-user Industry 2025 & 2033
- Figure 59: Middle East and Africa Industrial Water Treatment Chemicals Industry Revenue (Million), by Country 2025 & 2033
- Figure 60: Middle East and Africa Industrial Water Treatment Chemicals Industry Volume (Billion), by Country 2025 & 2033
- Figure 61: Middle East and Africa Industrial Water Treatment Chemicals Industry Revenue Share (%), by Country 2025 & 2033
- Figure 62: Middle East and Africa Industrial Water Treatment Chemicals Industry Volume Share (%), by Country 2025 & 2033
List of Tables
- Table 1: Global Industrial Water Treatment Chemicals Industry Revenue Million Forecast, by Product Type 2020 & 2033
- Table 2: Global Industrial Water Treatment Chemicals Industry Volume Billion Forecast, by Product Type 2020 & 2033
- Table 3: Global Industrial Water Treatment Chemicals Industry Revenue Million Forecast, by End-user Industry 2020 & 2033
- Table 4: Global Industrial Water Treatment Chemicals Industry Volume Billion Forecast, by End-user Industry 2020 & 2033
- Table 5: Global Industrial Water Treatment Chemicals Industry Revenue Million Forecast, by Region 2020 & 2033
- Table 6: Global Industrial Water Treatment Chemicals Industry Volume Billion Forecast, by Region 2020 & 2033
- Table 7: Global Industrial Water Treatment Chemicals Industry Revenue Million Forecast, by Product Type 2020 & 2033
- Table 8: Global Industrial Water Treatment Chemicals Industry Volume Billion Forecast, by Product Type 2020 & 2033
- Table 9: Global Industrial Water Treatment Chemicals Industry Revenue Million Forecast, by End-user Industry 2020 & 2033
- Table 10: Global Industrial Water Treatment Chemicals Industry Volume Billion Forecast, by End-user Industry 2020 & 2033
- Table 11: Global Industrial Water Treatment Chemicals Industry Revenue Million Forecast, by Country 2020 & 2033
- Table 12: Global Industrial Water Treatment Chemicals Industry Volume Billion Forecast, by Country 2020 & 2033
- Table 13: United States Industrial Water Treatment Chemicals Industry Revenue (Million) Forecast, by Application 2020 & 2033
- Table 14: United States Industrial Water Treatment Chemicals Industry Volume (Billion) Forecast, by Application 2020 & 2033
- Table 15: Mexico Industrial Water Treatment Chemicals Industry Revenue (Million) Forecast, by Application 2020 & 2033
- Table 16: Mexico Industrial Water Treatment Chemicals Industry Volume (Billion) Forecast, by Application 2020 & 2033
- Table 17: Canada Industrial Water Treatment Chemicals Industry Revenue (Million) Forecast, by Application 2020 & 2033
- Table 18: Canada Industrial Water Treatment Chemicals Industry Volume (Billion) Forecast, by Application 2020 & 2033
- Table 19: Global Industrial Water Treatment Chemicals Industry Revenue Million Forecast, by Product Type 2020 & 2033
- Table 20: Global Industrial Water Treatment Chemicals Industry Volume Billion Forecast, by Product Type 2020 & 2033
- Table 21: Global Industrial Water Treatment Chemicals Industry Revenue Million Forecast, by End-user Industry 2020 & 2033
- Table 22: Global Industrial Water Treatment Chemicals Industry Volume Billion Forecast, by End-user Industry 2020 & 2033
- Table 23: Global Industrial Water Treatment Chemicals Industry Revenue Million Forecast, by Country 2020 & 2033
- Table 24: Global Industrial Water Treatment Chemicals Industry Volume Billion Forecast, by Country 2020 & 2033
- Table 25: Germany Industrial Water Treatment Chemicals Industry Revenue (Million) Forecast, by Application 2020 & 2033
- Table 26: Germany Industrial Water Treatment Chemicals Industry Volume (Billion) Forecast, by Application 2020 & 2033
- Table 27: United Kingdom Industrial Water Treatment Chemicals Industry Revenue (Million) Forecast, by Application 2020 & 2033
- Table 28: United Kingdom Industrial Water Treatment Chemicals Industry Volume (Billion) Forecast, by Application 2020 & 2033
- Table 29: France Industrial Water Treatment Chemicals Industry Revenue (Million) Forecast, by Application 2020 & 2033
- Table 30: France Industrial Water Treatment Chemicals Industry Volume (Billion) Forecast, by Application 2020 & 2033
- Table 31: Italy Industrial Water Treatment Chemicals Industry Revenue (Million) Forecast, by Application 2020 & 2033
- Table 32: Italy Industrial Water Treatment Chemicals Industry Volume (Billion) Forecast, by Application 2020 & 2033
- Table 33: Rest of Europe Industrial Water Treatment Chemicals Industry Revenue (Million) Forecast, by Application 2020 & 2033
- Table 34: Rest of Europe Industrial Water Treatment Chemicals Industry Volume (Billion) Forecast, by Application 2020 & 2033
- Table 35: Global Industrial Water Treatment Chemicals Industry Revenue Million Forecast, by Product Type 2020 & 2033
- Table 36: Global Industrial Water Treatment Chemicals Industry Volume Billion Forecast, by Product Type 2020 & 2033
- Table 37: Global Industrial Water Treatment Chemicals Industry Revenue Million Forecast, by End-user Industry 2020 & 2033
- Table 38: Global Industrial Water Treatment Chemicals Industry Volume Billion Forecast, by End-user Industry 2020 & 2033
- Table 39: Global Industrial Water Treatment Chemicals Industry Revenue Million Forecast, by Country 2020 & 2033
- Table 40: Global Industrial Water Treatment Chemicals Industry Volume Billion Forecast, by Country 2020 & 2033
- Table 41: China Industrial Water Treatment Chemicals Industry Revenue (Million) Forecast, by Application 2020 & 2033
- Table 42: China Industrial Water Treatment Chemicals Industry Volume (Billion) Forecast, by Application 2020 & 2033
- Table 43: India Industrial Water Treatment Chemicals Industry Revenue (Million) Forecast, by Application 2020 & 2033
- Table 44: India Industrial Water Treatment Chemicals Industry Volume (Billion) Forecast, by Application 2020 & 2033
- Table 45: Japan Industrial Water Treatment Chemicals Industry Revenue (Million) Forecast, by Application 2020 & 2033
- Table 46: Japan Industrial Water Treatment Chemicals Industry Volume (Billion) Forecast, by Application 2020 & 2033
- Table 47: South Korea Industrial Water Treatment Chemicals Industry Revenue (Million) Forecast, by Application 2020 & 2033
- Table 48: South Korea Industrial Water Treatment Chemicals Industry Volume (Billion) Forecast, by Application 2020 & 2033
- Table 49: Rest of Asia Pacific Industrial Water Treatment Chemicals Industry Revenue (Million) Forecast, by Application 2020 & 2033
- Table 50: Rest of Asia Pacific Industrial Water Treatment Chemicals Industry Volume (Billion) Forecast, by Application 2020 & 2033
- Table 51: Global Industrial Water Treatment Chemicals Industry Revenue Million Forecast, by Product Type 2020 & 2033
- Table 52: Global Industrial Water Treatment Chemicals Industry Volume Billion Forecast, by Product Type 2020 & 2033
- Table 53: Global Industrial Water Treatment Chemicals Industry Revenue Million Forecast, by End-user Industry 2020 & 2033
- Table 54: Global Industrial Water Treatment Chemicals Industry Volume Billion Forecast, by End-user Industry 2020 & 2033
- Table 55: Global Industrial Water Treatment Chemicals Industry Revenue Million Forecast, by Country 2020 & 2033
- Table 56: Global Industrial Water Treatment Chemicals Industry Volume Billion Forecast, by Country 2020 & 2033
- Table 57: Brazil Industrial Water Treatment Chemicals Industry Revenue (Million) Forecast, by Application 2020 & 2033
- Table 58: Brazil Industrial Water Treatment Chemicals Industry Volume (Billion) Forecast, by Application 2020 & 2033
- Table 59: Argentina Industrial Water Treatment Chemicals Industry Revenue (Million) Forecast, by Application 2020 & 2033
- Table 60: Argentina Industrial Water Treatment Chemicals Industry Volume (Billion) Forecast, by Application 2020 & 2033
- Table 61: Rest of South America Industrial Water Treatment Chemicals Industry Revenue (Million) Forecast, by Application 2020 & 2033
- Table 62: Rest of South America Industrial Water Treatment Chemicals Industry Volume (Billion) Forecast, by Application 2020 & 2033
- Table 63: Global Industrial Water Treatment Chemicals Industry Revenue Million Forecast, by Product Type 2020 & 2033
- Table 64: Global Industrial Water Treatment Chemicals Industry Volume Billion Forecast, by Product Type 2020 & 2033
- Table 65: Global Industrial Water Treatment Chemicals Industry Revenue Million Forecast, by End-user Industry 2020 & 2033
- Table 66: Global Industrial Water Treatment Chemicals Industry Volume Billion Forecast, by End-user Industry 2020 & 2033
- Table 67: Global Industrial Water Treatment Chemicals Industry Revenue Million Forecast, by Country 2020 & 2033
- Table 68: Global Industrial Water Treatment Chemicals Industry Volume Billion Forecast, by Country 2020 & 2033
- Table 69: Saudi Arabia Industrial Water Treatment Chemicals Industry Revenue (Million) Forecast, by Application 2020 & 2033
- Table 70: Saudi Arabia Industrial Water Treatment Chemicals Industry Volume (Billion) Forecast, by Application 2020 & 2033
- Table 71: South Africa Industrial Water Treatment Chemicals Industry Revenue (Million) Forecast, by Application 2020 & 2033
- Table 72: South Africa Industrial Water Treatment Chemicals Industry Volume (Billion) Forecast, by Application 2020 & 2033
- Table 73: United Arab Emirates Industrial Water Treatment Chemicals Industry Revenue (Million) Forecast, by Application 2020 & 2033
- Table 74: United Arab Emirates Industrial Water Treatment Chemicals Industry Volume (Billion) Forecast, by Application 2020 & 2033
- Table 75: Rest of Middle East and Africa Industrial Water Treatment Chemicals Industry Revenue (Million) Forecast, by Application 2020 & 2033
- Table 76: Rest of Middle East and Africa Industrial Water Treatment Chemicals Industry Volume (Billion) Forecast, by Application 2020 & 2033
Frequently Asked Questions
1. What is the projected Compound Annual Growth Rate (CAGR) of the Industrial Water Treatment Chemicals Industry?
The projected CAGR is approximately 6.04%.
2. Which companies are prominent players in the Industrial Water Treatment Chemicals Industry?
Key companies in the market include BWA WATER ADDITIVES, Chemifloc LTD, Kemira, Kurita Water Industries Ltd, Lenntech B V, Lonza, DuPont de Nemours Inc, Ecolab, SNF, Solenis, SUEZ*List Not Exhaustive.
3. What are the main segments of the Industrial Water Treatment Chemicals Industry?
The market segments include Product Type, End-user Industry.
4. Can you provide details about the market size?
The market size is estimated to be USD 22.19 Million as of 2022.
5. What are some drivers contributing to market growth?
Increasing Production of Shale Gas in the United States; Growing Production Activities in Chemical and Paper Industry; Other Drivers.
6. What are the notable trends driving market growth?
Power Industry to Dominate the Market.
7. Are there any restraints impacting market growth?
Increasing Production of Shale Gas in the United States; Growing Production Activities in Chemical and Paper Industry; Other Drivers.
8. Can you provide examples of recent developments in the market?
March 2023: Solenis, providing water treatment solutions for municipal and industrial water treatment, announced that it agreed to acquire Diversey, a cleaning solutions company primarily for industrial water treatment, for USD 4.6 billion.
9. What pricing options are available for accessing the report?
Pricing options include single-user, multi-user, and enterprise licenses priced at USD 4750, USD 5250, and USD 8750 respectively.
10. Is the market size provided in terms of value or volume?
The market size is provided in terms of value, measured in Million and volume, measured in Billion.
11. Are there any specific market keywords associated with the report?
Yes, the market keyword associated with the report is "Industrial Water Treatment Chemicals Industry," which aids in identifying and referencing the specific market segment covered.
12. How do I determine which pricing option suits my needs best?
The pricing options vary based on user requirements and access needs. Individual users may opt for single-user licenses, while businesses requiring broader access may choose multi-user or enterprise licenses for cost-effective access to the report.
13. Are there any additional resources or data provided in the Industrial Water Treatment Chemicals Industry report?
While the report offers comprehensive insights, it's advisable to review the specific contents or supplementary materials provided to ascertain if additional resources or data are available.
14. How can I stay updated on further developments or reports in the Industrial Water Treatment Chemicals Industry?
To stay informed about further developments, trends, and reports in the Industrial Water Treatment Chemicals Industry, consider subscribing to industry newsletters, following relevant companies and organizations, or regularly checking reputable industry news sources and publications.
Methodology
Step 1 - Identification of Relevant Samples Size from Population Database


Step 2 - Approaches for Defining Global Market Size (Value, Volume* & Price*)

Note*: In applicable scenarios
Step 3 - Data Sources
Primary Research
- Web Analytics
- Survey Reports
- Research Institute
- Latest Research Reports
- Opinion Leaders
Secondary Research
- Annual Reports
- White Paper
- Latest Press Release
- Industry Association
- Paid Database
- Investor Presentations

Step 4 - Data Triangulation
Involves using different sources of information in order to increase the validity of a study
These sources are likely to be stakeholders in a program - participants, other researchers, program staff, other community members, and so on.
Then we put all data in single framework & apply various statistical tools to find out the dynamic on the market.
During the analysis stage, feedback from the stakeholder groups would be compared to determine areas of agreement as well as areas of divergence