

Key Insights
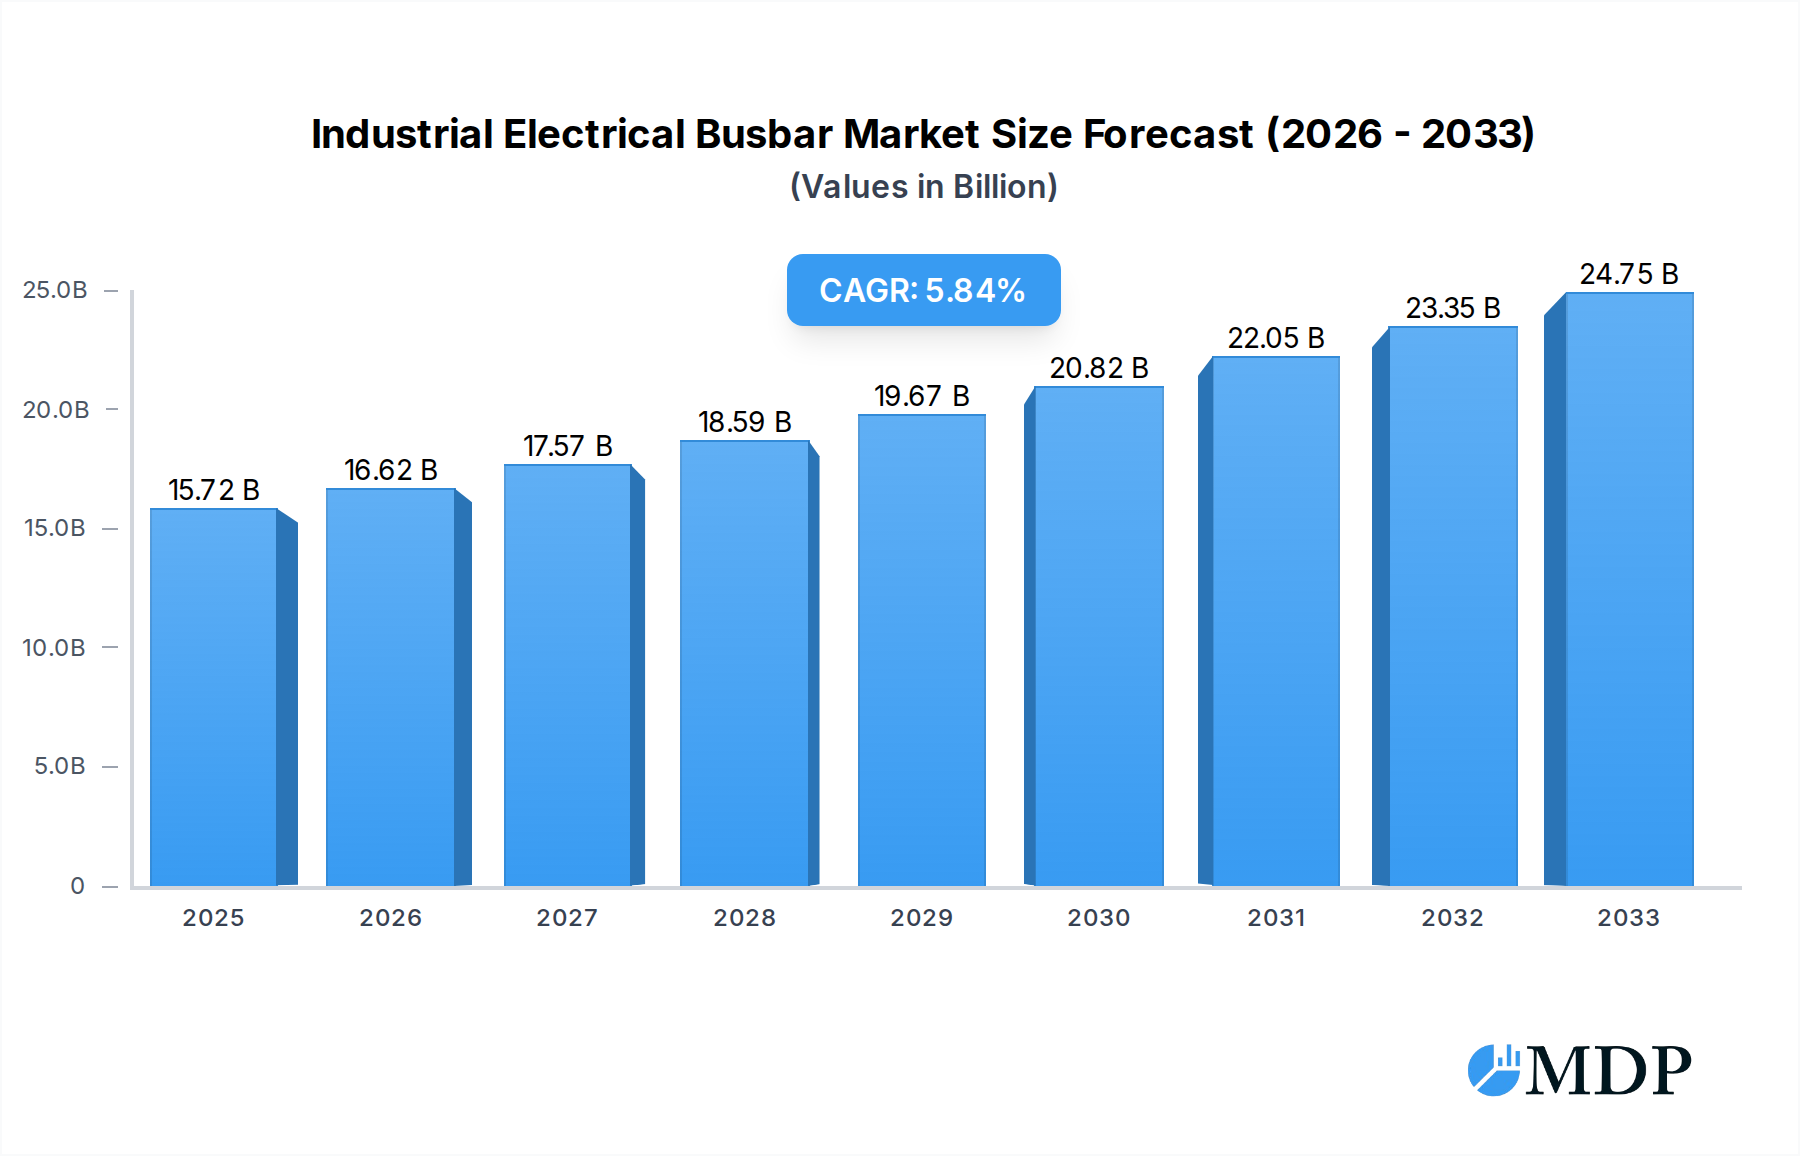
The global Industrial Electrical Busbar market is poised for significant expansion, projected to reach an estimated $15.72 billion in 2025. This robust growth is driven by the escalating demand for efficient and reliable power distribution solutions across various critical sectors. The 5.8% CAGR anticipated over the forecast period underscores the market's dynamic nature and its vital role in modern industrial infrastructure. Key applications such as Rail, Photovoltaic (PV) systems, Wind Power installations, and Industrial Frequency Converters are spearheading this surge. The electrification of transportation, the increasing adoption of renewable energy sources to meet sustainability goals, and the continuous need for optimized power management in heavy industries are all contributing factors. Furthermore, advancements in busbar technology, including higher voltage ratings (1000-1500V and 3600-4200V) and improved material science, are enabling greater power handling capacity and enhanced safety, further fueling market adoption.

Industrial Electrical Busbar Market Size (In Billion)
The market's trajectory is also influenced by evolving trends such as the integration of smart grid technologies and the growing emphasis on modular and pre-fabricated busbar systems for faster installation and reduced downtime. While the market exhibits strong growth potential, certain restraints, such as the fluctuating raw material costs for copper and aluminum, and the stringent regulatory landscape concerning electrical safety and emissions, necessitate careful consideration by market participants. However, the significant investments in infrastructure development worldwide, particularly in emerging economies within Asia Pacific and Europe, alongside ongoing technological innovations aimed at improving energy efficiency and reducing carbon footprints, are expected to outweigh these challenges. Leading companies are actively investing in research and development to offer advanced solutions that cater to these evolving demands, solidifying the industrial electrical busbar market's indispensable position in powering the future.
Industrial Electrical Busbar Company Market Share
Unlocking the Potential of Industrial Electrical Busbar: A Comprehensive Market Analysis (2019–2033)
This in-depth report provides a definitive analysis of the global industrial electrical busbar market, encompassing a comprehensive study period from 2019 to 2033. With a base year of 2025 and an estimated year also in 2025, the forecast period from 2025 to 2033 offers critical insights into future market trajectories. Historical data from 2019 to 2024 has been meticulously analyzed to establish foundational market understanding. This report is an indispensable resource for industry stakeholders seeking to understand market dynamics, identify growth opportunities, and navigate the evolving landscape of industrial electrical busbar solutions. We cover key applications such as Rail, PV, Wind Power, and Industrial Frequency Converter, along with voltage types including 380~1000V, 1000~1500V, and 3600~4200V.
Industrial Electrical Busbar Market Dynamics & Concentration
The industrial electrical busbar market exhibits a moderate to high concentration, driven by the significant capital investments required for manufacturing and the stringent quality standards demanded by end-use industries. Innovation drivers are primarily focused on enhanced thermal management, increased current carrying capacity, and improved safety features. Regulatory frameworks, such as those governing electrical safety and environmental impact, play a crucial role in shaping product development and market entry. Product substitutes, including high-performance cables and advanced wiring systems, pose a constant competitive threat, necessitating continuous innovation in busbar technology. End-user trends lean towards miniaturization, modularity, and integration with smart grid technologies. Mergers and Acquisition (M&A) activities are strategic in nature, aimed at consolidating market share, acquiring new technologies, and expanding geographical reach. For instance, M&A deal counts have seen a xx% increase over the historical period, with key players acquiring smaller, specialized busbar manufacturers. Market share is distributed amongst a few dominant players, with the top five companies holding approximately 60% of the global market.
Industrial Electrical Busbar Industry Trends & Analysis
The industrial electrical busbar industry is poised for robust growth, fueled by several interconnected trends. A primary growth driver is the escalating global demand for electricity, propelled by industrial expansion, urbanization, and the increasing adoption of electric vehicles. The transition towards renewable energy sources, particularly solar photovoltaic (PV) and wind power, necessitates significant investment in robust electrical infrastructure, directly benefiting the busbar market. Technological disruptions are revolutionizing busbar design, with advancements in materials science leading to lighter, more conductive, and heat-resistant busbars. The integration of smart technologies, such as sensor-embedded busbars for real-time monitoring of temperature and current, is becoming increasingly prevalent. Consumer preferences are shifting towards sustainable and energy-efficient solutions, pushing manufacturers to develop eco-friendly busbar options. Competitive dynamics are intensifying, with established players investing heavily in R&D to maintain their market leadership while new entrants focus on niche applications and innovative product offerings. The market penetration of advanced busbar systems is estimated to reach xx% by 2025, a testament to their growing adoption. The Compound Annual Growth Rate (CAGR) for the industrial electrical busbar market is projected to be xx% during the forecast period. This sustained growth is underpinned by ongoing infrastructure development projects and the continuous evolution of industrial processes. Furthermore, the increasing complexity of electrical systems in sectors like renewable energy and advanced manufacturing demands high-performance, reliable busbar solutions that can handle higher power densities and ensure operational efficiency.
Leading Markets & Segments in Industrial Electrical Busbar
The Rail application segment is a dominant force within the industrial electrical busbar market. This dominance is driven by massive government investments in high-speed rail networks and urban metro systems across major economies. For example, infrastructure development in Asia-Pacific, particularly China and India, continues to be a significant catalyst. The inherent need for high-voltage, high-current capacity and extreme reliability in railway electrification systems makes busbars an indispensable component. Key drivers include:
- Government Initiatives: Aggressive infrastructure spending and focus on sustainable transportation.
- Technological Advancements: Development of lightweight, compact, and high-performance busbars for constrained railway environments.
- Safety Regulations: Stringent safety standards in railway operations demand robust and fail-safe electrical connections.
The 3600~4200V voltage type segment also holds significant sway. This high-voltage category is crucial for heavy industrial applications, large-scale renewable energy installations, and the growing industrial frequency converter market. The increasing demand for efficient power distribution in these sectors directly correlates with the demand for high-voltage busbars. Key drivers include:
- Industrial Expansion: Growth in manufacturing sectors requiring high-power distribution.
- Renewable Energy Integration: Large-scale wind farms and solar power plants utilize high-voltage transmission and distribution, necessitating robust busbar solutions.
- Efficiency Demands: Higher voltage levels reduce transmission losses, making these busbars economically advantageous for large-scale operations.
Within regions, Asia-Pacific continues to be the leading market, owing to its rapid industrialization, burgeoning manufacturing sector, and substantial investments in renewable energy projects and infrastructure development.
Industrial Electrical Busbar Product Developments
Product innovations in the industrial electrical busbar market are largely driven by the pursuit of enhanced electrical and thermal performance, increased safety, and greater design flexibility. Manufacturers are developing advanced composite materials and innovative conductor designs to improve current carrying capacity and reduce weight. Integrated sensor technology for real-time monitoring of temperature, current, and voltage is a key trend, enabling predictive maintenance and improved operational efficiency. The focus on modularity and plug-and-play solutions is also gaining traction, simplifying installation and maintenance for end-users across various applications, from rail electrification to large-scale PV installations.
Key Drivers of Industrial Electrical Busbar Growth
The industrial electrical busbar market's growth is propelled by several compelling factors. Technological advancements in materials science and electrical engineering are leading to more efficient, reliable, and compact busbar solutions. The global expansion of renewable energy infrastructure, particularly solar and wind power, necessitates substantial investment in high-capacity electrical distribution systems where busbars are critical. Increasing industrialization and urbanization worldwide are driving demand for robust power infrastructure. Furthermore, supportive government policies and investments in energy grids and transportation networks are creating a favorable environment for market expansion.
Challenges in the Industrial Electrical Busbar Market
Despite the positive growth trajectory, the industrial electrical busbar market faces several challenges. Stringent regulatory compliance for safety and environmental standards can increase product development costs and time-to-market. Volatility in raw material prices, particularly for copper and aluminum, can impact manufacturing costs and profit margins. Intense competition from established players and emerging low-cost manufacturers poses a continuous threat to pricing power. Supply chain disruptions, as experienced in recent years, can also hinder production and delivery timelines, requiring robust logistical planning.
Emerging Opportunities in Industrial Electrical Busbar
Emerging opportunities in the industrial electrical busbar market are abundant, driven by innovation and evolving industry needs. The rapid growth of energy storage systems and the expansion of electric vehicle charging infrastructure present significant new application areas. Advancements in smart grid technologies are creating demand for intelligent busbar systems with integrated monitoring and control capabilities. Strategic partnerships between busbar manufacturers and technology providers can accelerate the development and adoption of these advanced solutions. Furthermore, expanding into emerging economies with developing infrastructure offers substantial untapped market potential.
Leading Players in the Industrial Electrical Busbar Sector
- Rogers Corporation
- Interplex
- ABB
- nVent
- Schneider Electric
- Sumitube
- Aptiv
- Leoni
- Connor
- Hitachi Metals
- Suncall
- West Deane New Power Electric
Key Milestones in Industrial Electrical Busbar Industry
- 2019: Increased adoption of composite materials for enhanced thermal management.
- 2020: Growing demand for busbars in large-scale offshore wind farm projects.
- 2021: Introduction of smart busbar solutions with integrated IoT capabilities.
- 2022: Significant investment in R&D for high-voltage DC busbars to support grid modernization.
- 2023: Expansion of busbar manufacturing facilities in emerging markets to meet localized demand.
- 2024: Increased focus on sustainable manufacturing processes and recycled materials.
Strategic Outlook for Industrial Electrical Busbar Market
The strategic outlook for the industrial electrical busbar market is overwhelmingly positive, driven by accelerating global electrification trends and continuous technological innovation. Key growth accelerators include the ongoing expansion of renewable energy capacities, the electrification of transportation, and the increasing adoption of advanced manufacturing technologies. Strategic opportunities lie in developing ultra-high-performance busbars for emerging applications, such as hydrogen fuel cells and advanced data centers, and in leveraging digital technologies for enhanced product intelligence and customer service. Companies that prioritize innovation, sustainability, and strategic partnerships will be best positioned to capitalize on the significant future market potential.
Industrial Electrical Busbar Segmentation
-
1. Application
- 1.1. Rail
- 1.2. PV
- 1.3. Wind Power
- 1.4. Industrial Frequency Converter
-
2. Types
- 2.1. 380~1000V
- 2.2. 1000~1500V
- 2.3. 3600~4200V
Industrial Electrical Busbar Segmentation By Geography
-
1. North America
- 1.1. United States
- 1.2. Canada
- 1.3. Mexico
-
2. South America
- 2.1. Brazil
- 2.2. Argentina
- 2.3. Rest of South America
-
3. Europe
- 3.1. United Kingdom
- 3.2. Germany
- 3.3. France
- 3.4. Italy
- 3.5. Spain
- 3.6. Russia
- 3.7. Benelux
- 3.8. Nordics
- 3.9. Rest of Europe
-
4. Middle East & Africa
- 4.1. Turkey
- 4.2. Israel
- 4.3. GCC
- 4.4. North Africa
- 4.5. South Africa
- 4.6. Rest of Middle East & Africa
-
5. Asia Pacific
- 5.1. China
- 5.2. India
- 5.3. Japan
- 5.4. South Korea
- 5.5. ASEAN
- 5.6. Oceania
- 5.7. Rest of Asia Pacific
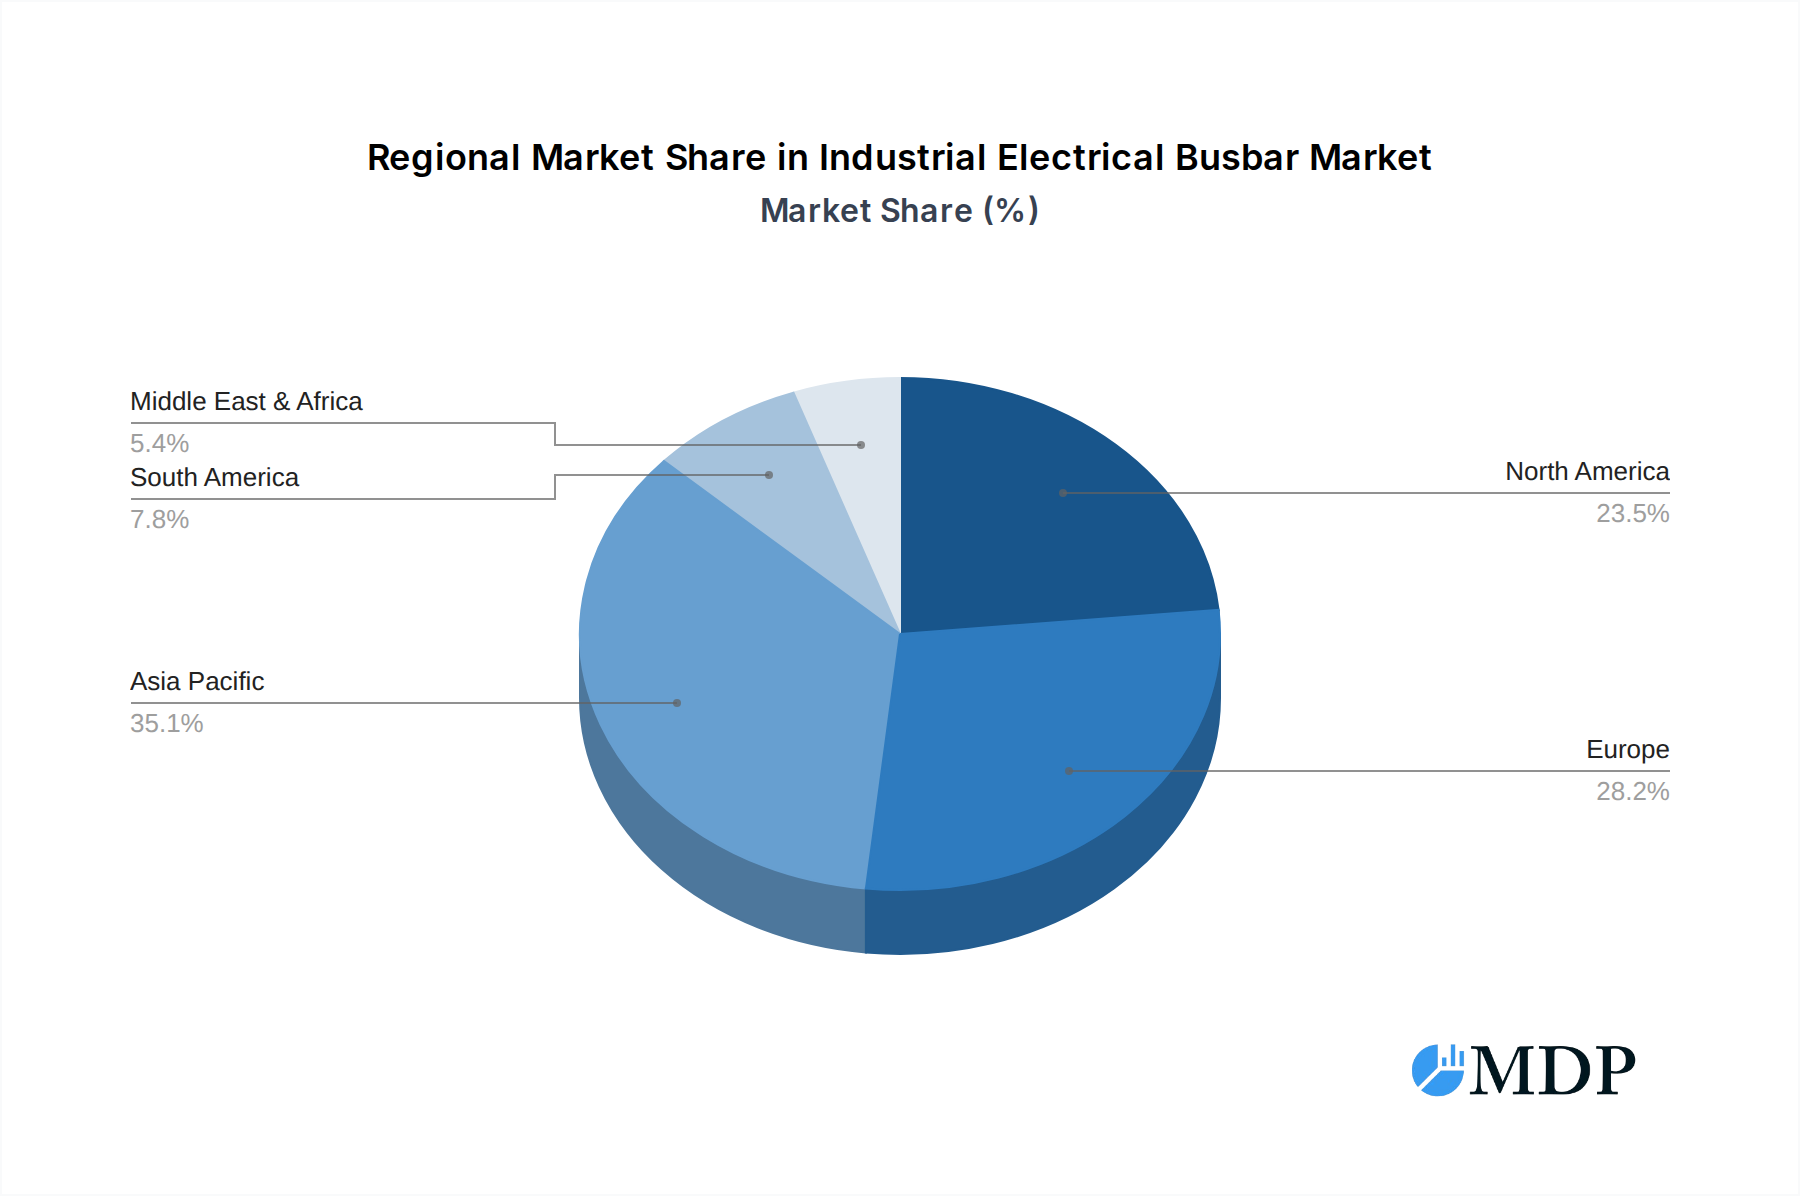
Industrial Electrical Busbar Regional Market Share
Geographic Coverage of Industrial Electrical Busbar
Industrial Electrical Busbar REPORT HIGHLIGHTS
| Aspects | Details |
|---|---|
| Study Period | 2020-2034 |
| Base Year | 2025 |
| Estimated Year | 2026 |
| Forecast Period | 2026-2034 |
| Historical Period | 2020-2025 |
| Growth Rate | CAGR of 5.8% from 2020-2034 |
| Segmentation |
|
Table of Contents
- 1. Introduction
- 1.1. Research Scope
- 1.2. Market Segmentation
- 1.3. Research Methodology
- 1.4. Definitions and Assumptions
- 2. Executive Summary
- 2.1. Introduction
- 3. Market Dynamics
- 3.1. Introduction
- 3.2. Market Drivers
- 3.3. Market Restrains
- 3.4. Market Trends
- 4. Market Factor Analysis
- 4.1. Porters Five Forces
- 4.2. Supply/Value Chain
- 4.3. PESTEL analysis
- 4.4. Market Entropy
- 4.5. Patent/Trademark Analysis
- 5. Global Industrial Electrical Busbar Analysis, Insights and Forecast, 2020-2032
- 5.1. Market Analysis, Insights and Forecast - by Application
- 5.1.1. Rail
- 5.1.2. PV
- 5.1.3. Wind Power
- 5.1.4. Industrial Frequency Converter
- 5.2. Market Analysis, Insights and Forecast - by Types
- 5.2.1. 380~1000V
- 5.2.2. 1000~1500V
- 5.2.3. 3600~4200V
- 5.3. Market Analysis, Insights and Forecast - by Region
- 5.3.1. North America
- 5.3.2. South America
- 5.3.3. Europe
- 5.3.4. Middle East & Africa
- 5.3.5. Asia Pacific
- 5.1. Market Analysis, Insights and Forecast - by Application
- 6. North America Industrial Electrical Busbar Analysis, Insights and Forecast, 2020-2032
- 6.1. Market Analysis, Insights and Forecast - by Application
- 6.1.1. Rail
- 6.1.2. PV
- 6.1.3. Wind Power
- 6.1.4. Industrial Frequency Converter
- 6.2. Market Analysis, Insights and Forecast - by Types
- 6.2.1. 380~1000V
- 6.2.2. 1000~1500V
- 6.2.3. 3600~4200V
- 6.1. Market Analysis, Insights and Forecast - by Application
- 7. South America Industrial Electrical Busbar Analysis, Insights and Forecast, 2020-2032
- 7.1. Market Analysis, Insights and Forecast - by Application
- 7.1.1. Rail
- 7.1.2. PV
- 7.1.3. Wind Power
- 7.1.4. Industrial Frequency Converter
- 7.2. Market Analysis, Insights and Forecast - by Types
- 7.2.1. 380~1000V
- 7.2.2. 1000~1500V
- 7.2.3. 3600~4200V
- 7.1. Market Analysis, Insights and Forecast - by Application
- 8. Europe Industrial Electrical Busbar Analysis, Insights and Forecast, 2020-2032
- 8.1. Market Analysis, Insights and Forecast - by Application
- 8.1.1. Rail
- 8.1.2. PV
- 8.1.3. Wind Power
- 8.1.4. Industrial Frequency Converter
- 8.2. Market Analysis, Insights and Forecast - by Types
- 8.2.1. 380~1000V
- 8.2.2. 1000~1500V
- 8.2.3. 3600~4200V
- 8.1. Market Analysis, Insights and Forecast - by Application
- 9. Middle East & Africa Industrial Electrical Busbar Analysis, Insights and Forecast, 2020-2032
- 9.1. Market Analysis, Insights and Forecast - by Application
- 9.1.1. Rail
- 9.1.2. PV
- 9.1.3. Wind Power
- 9.1.4. Industrial Frequency Converter
- 9.2. Market Analysis, Insights and Forecast - by Types
- 9.2.1. 380~1000V
- 9.2.2. 1000~1500V
- 9.2.3. 3600~4200V
- 9.1. Market Analysis, Insights and Forecast - by Application
- 10. Asia Pacific Industrial Electrical Busbar Analysis, Insights and Forecast, 2020-2032
- 10.1. Market Analysis, Insights and Forecast - by Application
- 10.1.1. Rail
- 10.1.2. PV
- 10.1.3. Wind Power
- 10.1.4. Industrial Frequency Converter
- 10.2. Market Analysis, Insights and Forecast - by Types
- 10.2.1. 380~1000V
- 10.2.2. 1000~1500V
- 10.2.3. 3600~4200V
- 10.1. Market Analysis, Insights and Forecast - by Application
- 11. Competitive Analysis
- 11.1. Global Market Share Analysis 2025
- 11.2. Company Profiles
- 11.2.1 Rogers Corporation
- 11.2.1.1. Overview
- 11.2.1.2. Products
- 11.2.1.3. SWOT Analysis
- 11.2.1.4. Recent Developments
- 11.2.1.5. Financials (Based on Availability)
- 11.2.2 Interplex
- 11.2.2.1. Overview
- 11.2.2.2. Products
- 11.2.2.3. SWOT Analysis
- 11.2.2.4. Recent Developments
- 11.2.2.5. Financials (Based on Availability)
- 11.2.3 ABB
- 11.2.3.1. Overview
- 11.2.3.2. Products
- 11.2.3.3. SWOT Analysis
- 11.2.3.4. Recent Developments
- 11.2.3.5. Financials (Based on Availability)
- 11.2.4 nVent
- 11.2.4.1. Overview
- 11.2.4.2. Products
- 11.2.4.3. SWOT Analysis
- 11.2.4.4. Recent Developments
- 11.2.4.5. Financials (Based on Availability)
- 11.2.5 Schneider Electric
- 11.2.5.1. Overview
- 11.2.5.2. Products
- 11.2.5.3. SWOT Analysis
- 11.2.5.4. Recent Developments
- 11.2.5.5. Financials (Based on Availability)
- 11.2.6 Sumitube
- 11.2.6.1. Overview
- 11.2.6.2. Products
- 11.2.6.3. SWOT Analysis
- 11.2.6.4. Recent Developments
- 11.2.6.5. Financials (Based on Availability)
- 11.2.7 Aptiv
- 11.2.7.1. Overview
- 11.2.7.2. Products
- 11.2.7.3. SWOT Analysis
- 11.2.7.4. Recent Developments
- 11.2.7.5. Financials (Based on Availability)
- 11.2.8 Leoni
- 11.2.8.1. Overview
- 11.2.8.2. Products
- 11.2.8.3. SWOT Analysis
- 11.2.8.4. Recent Developments
- 11.2.8.5. Financials (Based on Availability)
- 11.2.9 Connor
- 11.2.9.1. Overview
- 11.2.9.2. Products
- 11.2.9.3. SWOT Analysis
- 11.2.9.4. Recent Developments
- 11.2.9.5. Financials (Based on Availability)
- 11.2.10 Hitachi Metals
- 11.2.10.1. Overview
- 11.2.10.2. Products
- 11.2.10.3. SWOT Analysis
- 11.2.10.4. Recent Developments
- 11.2.10.5. Financials (Based on Availability)
- 11.2.11 Suncall
- 11.2.11.1. Overview
- 11.2.11.2. Products
- 11.2.11.3. SWOT Analysis
- 11.2.11.4. Recent Developments
- 11.2.11.5. Financials (Based on Availability)
- 11.2.12 West Deane New Power Electric
- 11.2.12.1. Overview
- 11.2.12.2. Products
- 11.2.12.3. SWOT Analysis
- 11.2.12.4. Recent Developments
- 11.2.12.5. Financials (Based on Availability)
- 11.2.1 Rogers Corporation
List of Figures
- Figure 1: Global Industrial Electrical Busbar Revenue Breakdown (undefined, %) by Region 2025 & 2033
- Figure 2: North America Industrial Electrical Busbar Revenue (undefined), by Application 2025 & 2033
- Figure 3: North America Industrial Electrical Busbar Revenue Share (%), by Application 2025 & 2033
- Figure 4: North America Industrial Electrical Busbar Revenue (undefined), by Types 2025 & 2033
- Figure 5: North America Industrial Electrical Busbar Revenue Share (%), by Types 2025 & 2033
- Figure 6: North America Industrial Electrical Busbar Revenue (undefined), by Country 2025 & 2033
- Figure 7: North America Industrial Electrical Busbar Revenue Share (%), by Country 2025 & 2033
- Figure 8: South America Industrial Electrical Busbar Revenue (undefined), by Application 2025 & 2033
- Figure 9: South America Industrial Electrical Busbar Revenue Share (%), by Application 2025 & 2033
- Figure 10: South America Industrial Electrical Busbar Revenue (undefined), by Types 2025 & 2033
- Figure 11: South America Industrial Electrical Busbar Revenue Share (%), by Types 2025 & 2033
- Figure 12: South America Industrial Electrical Busbar Revenue (undefined), by Country 2025 & 2033
- Figure 13: South America Industrial Electrical Busbar Revenue Share (%), by Country 2025 & 2033
- Figure 14: Europe Industrial Electrical Busbar Revenue (undefined), by Application 2025 & 2033
- Figure 15: Europe Industrial Electrical Busbar Revenue Share (%), by Application 2025 & 2033
- Figure 16: Europe Industrial Electrical Busbar Revenue (undefined), by Types 2025 & 2033
- Figure 17: Europe Industrial Electrical Busbar Revenue Share (%), by Types 2025 & 2033
- Figure 18: Europe Industrial Electrical Busbar Revenue (undefined), by Country 2025 & 2033
- Figure 19: Europe Industrial Electrical Busbar Revenue Share (%), by Country 2025 & 2033
- Figure 20: Middle East & Africa Industrial Electrical Busbar Revenue (undefined), by Application 2025 & 2033
- Figure 21: Middle East & Africa Industrial Electrical Busbar Revenue Share (%), by Application 2025 & 2033
- Figure 22: Middle East & Africa Industrial Electrical Busbar Revenue (undefined), by Types 2025 & 2033
- Figure 23: Middle East & Africa Industrial Electrical Busbar Revenue Share (%), by Types 2025 & 2033
- Figure 24: Middle East & Africa Industrial Electrical Busbar Revenue (undefined), by Country 2025 & 2033
- Figure 25: Middle East & Africa Industrial Electrical Busbar Revenue Share (%), by Country 2025 & 2033
- Figure 26: Asia Pacific Industrial Electrical Busbar Revenue (undefined), by Application 2025 & 2033
- Figure 27: Asia Pacific Industrial Electrical Busbar Revenue Share (%), by Application 2025 & 2033
- Figure 28: Asia Pacific Industrial Electrical Busbar Revenue (undefined), by Types 2025 & 2033
- Figure 29: Asia Pacific Industrial Electrical Busbar Revenue Share (%), by Types 2025 & 2033
- Figure 30: Asia Pacific Industrial Electrical Busbar Revenue (undefined), by Country 2025 & 2033
- Figure 31: Asia Pacific Industrial Electrical Busbar Revenue Share (%), by Country 2025 & 2033
List of Tables
- Table 1: Global Industrial Electrical Busbar Revenue undefined Forecast, by Application 2020 & 2033
- Table 2: Global Industrial Electrical Busbar Revenue undefined Forecast, by Types 2020 & 2033
- Table 3: Global Industrial Electrical Busbar Revenue undefined Forecast, by Region 2020 & 2033
- Table 4: Global Industrial Electrical Busbar Revenue undefined Forecast, by Application 2020 & 2033
- Table 5: Global Industrial Electrical Busbar Revenue undefined Forecast, by Types 2020 & 2033
- Table 6: Global Industrial Electrical Busbar Revenue undefined Forecast, by Country 2020 & 2033
- Table 7: United States Industrial Electrical Busbar Revenue (undefined) Forecast, by Application 2020 & 2033
- Table 8: Canada Industrial Electrical Busbar Revenue (undefined) Forecast, by Application 2020 & 2033
- Table 9: Mexico Industrial Electrical Busbar Revenue (undefined) Forecast, by Application 2020 & 2033
- Table 10: Global Industrial Electrical Busbar Revenue undefined Forecast, by Application 2020 & 2033
- Table 11: Global Industrial Electrical Busbar Revenue undefined Forecast, by Types 2020 & 2033
- Table 12: Global Industrial Electrical Busbar Revenue undefined Forecast, by Country 2020 & 2033
- Table 13: Brazil Industrial Electrical Busbar Revenue (undefined) Forecast, by Application 2020 & 2033
- Table 14: Argentina Industrial Electrical Busbar Revenue (undefined) Forecast, by Application 2020 & 2033
- Table 15: Rest of South America Industrial Electrical Busbar Revenue (undefined) Forecast, by Application 2020 & 2033
- Table 16: Global Industrial Electrical Busbar Revenue undefined Forecast, by Application 2020 & 2033
- Table 17: Global Industrial Electrical Busbar Revenue undefined Forecast, by Types 2020 & 2033
- Table 18: Global Industrial Electrical Busbar Revenue undefined Forecast, by Country 2020 & 2033
- Table 19: United Kingdom Industrial Electrical Busbar Revenue (undefined) Forecast, by Application 2020 & 2033
- Table 20: Germany Industrial Electrical Busbar Revenue (undefined) Forecast, by Application 2020 & 2033
- Table 21: France Industrial Electrical Busbar Revenue (undefined) Forecast, by Application 2020 & 2033
- Table 22: Italy Industrial Electrical Busbar Revenue (undefined) Forecast, by Application 2020 & 2033
- Table 23: Spain Industrial Electrical Busbar Revenue (undefined) Forecast, by Application 2020 & 2033
- Table 24: Russia Industrial Electrical Busbar Revenue (undefined) Forecast, by Application 2020 & 2033
- Table 25: Benelux Industrial Electrical Busbar Revenue (undefined) Forecast, by Application 2020 & 2033
- Table 26: Nordics Industrial Electrical Busbar Revenue (undefined) Forecast, by Application 2020 & 2033
- Table 27: Rest of Europe Industrial Electrical Busbar Revenue (undefined) Forecast, by Application 2020 & 2033
- Table 28: Global Industrial Electrical Busbar Revenue undefined Forecast, by Application 2020 & 2033
- Table 29: Global Industrial Electrical Busbar Revenue undefined Forecast, by Types 2020 & 2033
- Table 30: Global Industrial Electrical Busbar Revenue undefined Forecast, by Country 2020 & 2033
- Table 31: Turkey Industrial Electrical Busbar Revenue (undefined) Forecast, by Application 2020 & 2033
- Table 32: Israel Industrial Electrical Busbar Revenue (undefined) Forecast, by Application 2020 & 2033
- Table 33: GCC Industrial Electrical Busbar Revenue (undefined) Forecast, by Application 2020 & 2033
- Table 34: North Africa Industrial Electrical Busbar Revenue (undefined) Forecast, by Application 2020 & 2033
- Table 35: South Africa Industrial Electrical Busbar Revenue (undefined) Forecast, by Application 2020 & 2033
- Table 36: Rest of Middle East & Africa Industrial Electrical Busbar Revenue (undefined) Forecast, by Application 2020 & 2033
- Table 37: Global Industrial Electrical Busbar Revenue undefined Forecast, by Application 2020 & 2033
- Table 38: Global Industrial Electrical Busbar Revenue undefined Forecast, by Types 2020 & 2033
- Table 39: Global Industrial Electrical Busbar Revenue undefined Forecast, by Country 2020 & 2033
- Table 40: China Industrial Electrical Busbar Revenue (undefined) Forecast, by Application 2020 & 2033
- Table 41: India Industrial Electrical Busbar Revenue (undefined) Forecast, by Application 2020 & 2033
- Table 42: Japan Industrial Electrical Busbar Revenue (undefined) Forecast, by Application 2020 & 2033
- Table 43: South Korea Industrial Electrical Busbar Revenue (undefined) Forecast, by Application 2020 & 2033
- Table 44: ASEAN Industrial Electrical Busbar Revenue (undefined) Forecast, by Application 2020 & 2033
- Table 45: Oceania Industrial Electrical Busbar Revenue (undefined) Forecast, by Application 2020 & 2033
- Table 46: Rest of Asia Pacific Industrial Electrical Busbar Revenue (undefined) Forecast, by Application 2020 & 2033
Frequently Asked Questions
1. What is the projected Compound Annual Growth Rate (CAGR) of the Industrial Electrical Busbar?
The projected CAGR is approximately 5.8%.
2. Which companies are prominent players in the Industrial Electrical Busbar?
Key companies in the market include Rogers Corporation, Interplex, ABB, nVent, Schneider Electric, Sumitube, Aptiv, Leoni, Connor, Hitachi Metals, Suncall, West Deane New Power Electric.
3. What are the main segments of the Industrial Electrical Busbar?
The market segments include Application, Types.
4. Can you provide details about the market size?
The market size is estimated to be USD XXX N/A as of 2022.
5. What are some drivers contributing to market growth?
N/A
6. What are the notable trends driving market growth?
N/A
7. Are there any restraints impacting market growth?
N/A
8. Can you provide examples of recent developments in the market?
N/A
9. What pricing options are available for accessing the report?
Pricing options include single-user, multi-user, and enterprise licenses priced at USD 2900.00, USD 4350.00, and USD 5800.00 respectively.
10. Is the market size provided in terms of value or volume?
The market size is provided in terms of value, measured in N/A.
11. Are there any specific market keywords associated with the report?
Yes, the market keyword associated with the report is "Industrial Electrical Busbar," which aids in identifying and referencing the specific market segment covered.
12. How do I determine which pricing option suits my needs best?
The pricing options vary based on user requirements and access needs. Individual users may opt for single-user licenses, while businesses requiring broader access may choose multi-user or enterprise licenses for cost-effective access to the report.
13. Are there any additional resources or data provided in the Industrial Electrical Busbar report?
While the report offers comprehensive insights, it's advisable to review the specific contents or supplementary materials provided to ascertain if additional resources or data are available.
14. How can I stay updated on further developments or reports in the Industrial Electrical Busbar?
To stay informed about further developments, trends, and reports in the Industrial Electrical Busbar, consider subscribing to industry newsletters, following relevant companies and organizations, or regularly checking reputable industry news sources and publications.
Methodology
Step 1 - Identification of Relevant Samples Size from Population Database


Step 2 - Approaches for Defining Global Market Size (Value, Volume* & Price*)

Note*: In applicable scenarios
Step 3 - Data Sources
Primary Research
- Web Analytics
- Survey Reports
- Research Institute
- Latest Research Reports
- Opinion Leaders
Secondary Research
- Annual Reports
- White Paper
- Latest Press Release
- Industry Association
- Paid Database
- Investor Presentations

Step 4 - Data Triangulation
Involves using different sources of information in order to increase the validity of a study
These sources are likely to be stakeholders in a program - participants, other researchers, program staff, other community members, and so on.
Then we put all data in single framework & apply various statistical tools to find out the dynamic on the market.
During the analysis stage, feedback from the stakeholder groups would be compared to determine areas of agreement as well as areas of divergence