

Key Insights
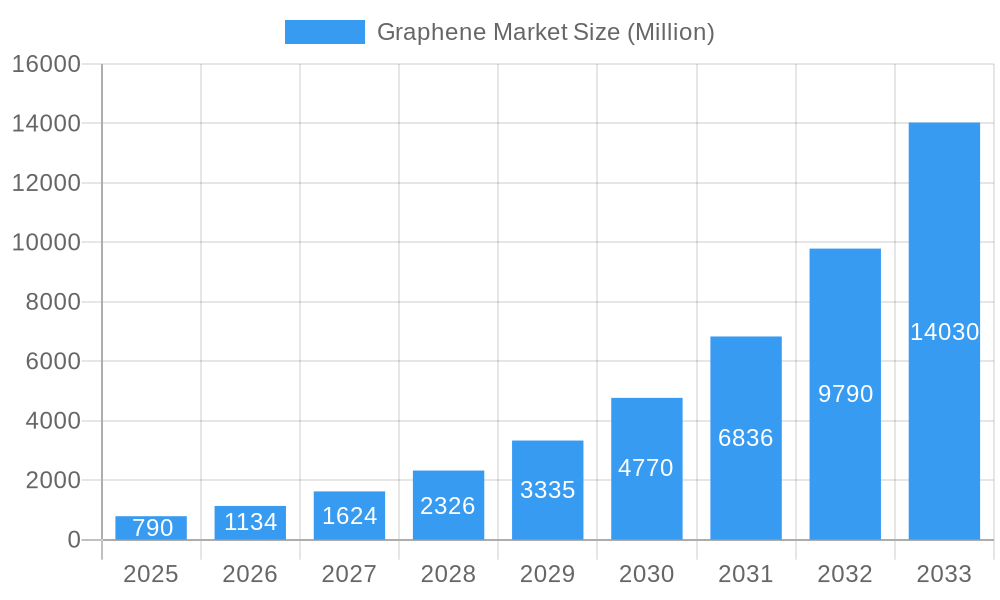
The graphene market, valued at $0.79 billion in 2025, is experiencing robust growth, projected to expand at a Compound Annual Growth Rate (CAGR) of 43.64% from 2025 to 2033. This exceptional growth is driven by the material's unique properties – exceptional strength, conductivity, and flexibility – making it ideal for diverse applications across various sectors. The electronics and telecommunication industry currently dominates the market, leveraging graphene's superior conductivity in advanced electronics and high-speed communication technologies. However, burgeoning demand from the biomedical and healthcare sectors, particularly in biosensors and drug delivery systems, is significantly contributing to market expansion. Furthermore, the increasing adoption of graphene in energy storage solutions (batteries, supercapacitors) and aerospace and defense applications (lightweight, high-strength composites) fuels this rapid growth. The market is segmented by product type (graphene sheets & films, nanoribbons, nanoplatelets, graphene oxide, and others) and end-user industry, offering diverse opportunities for market players. While challenges remain, such as high production costs and scalability issues for some graphene types, continuous research and development efforts are addressing these limitations, paving the way for broader commercialization.
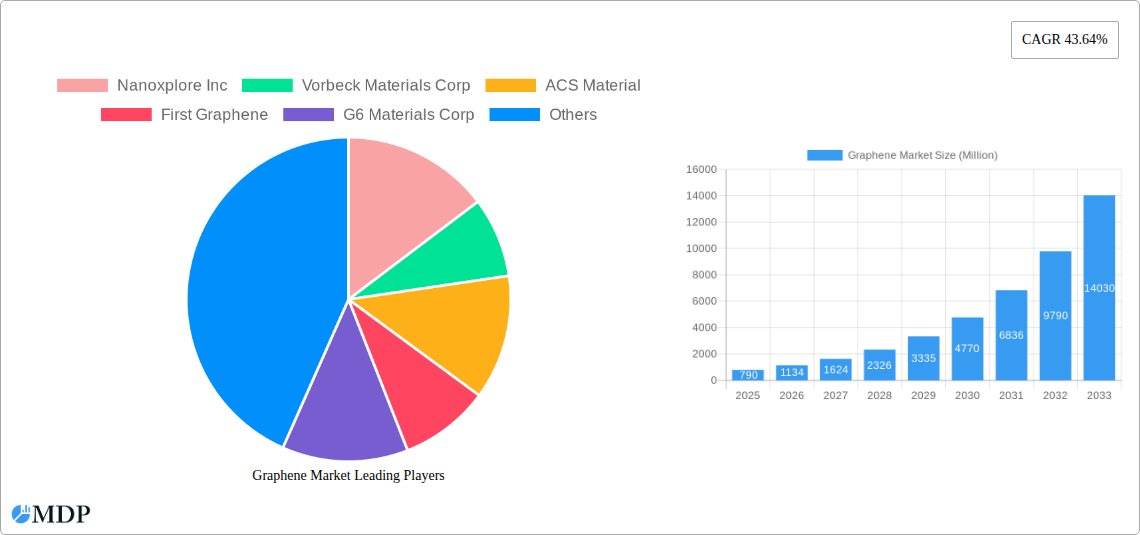
Graphene Market Market Size (In Million)
The competitive landscape is characterized by a mix of established players and emerging companies, including Nanoxplore Inc, Vorbeck Materials Corp, and others, driving innovation and market penetration. Geographical distribution reveals strong growth across the Asia-Pacific region, especially in China and India, driven by significant investments in research and manufacturing. North America and Europe also maintain substantial market shares, representing mature markets with established industries actively adopting graphene technologies. The forecast period anticipates continued market dominance by the aforementioned sectors, with emerging applications in other areas likely to contribute to substantial overall market expansion and diversification in the coming years. This signifies a positive outlook for the graphene market, promising substantial returns on investment and further technological breakthroughs.
Graphene Market Company Market Share
Graphene Market Report: 2019-2033 - Unlocking the Potential of a Revolutionary Material
This comprehensive report provides a detailed analysis of the global graphene market, offering invaluable insights for industry stakeholders, investors, and researchers. Covering the period 2019-2033, with a focus on 2025, this report meticulously examines market dynamics, leading players, and future growth prospects. Benefit from detailed segmentation, comprehensive data, and actionable intelligence to navigate this rapidly evolving market. The global graphene market is projected to reach xx Million by 2033, exhibiting a CAGR of xx% during the forecast period (2025-2033).
Graphene Market Market Dynamics & Concentration
The graphene market is characterized by a moderately fragmented landscape with several key players vying for market share. While a few large companies hold significant positions, numerous smaller firms contribute to innovation and specialized applications. Market concentration is expected to evolve as larger players consolidate through mergers and acquisitions (M&A). The historical period (2019-2024) witnessed xx M&A deals, primarily focused on expanding product portfolios and geographical reach. This trend is projected to continue in the forecast period (2025-2033).
- Market Concentration: The Herfindahl-Hirschman Index (HHI) for the graphene market in 2024 was estimated at xx, indicating a moderately concentrated market. This is expected to slightly increase to xx by 2033.
- Innovation Drivers: Ongoing research and development efforts focused on enhancing graphene's properties and exploring new applications are driving market growth. The development of scalable and cost-effective production methods is a key focus.
- Regulatory Frameworks: Government regulations and initiatives promoting the adoption of advanced materials, including graphene, are creating favorable conditions for market expansion. However, varying regulations across different regions can present challenges.
- Product Substitutes: While graphene offers unique properties, competing materials such as carbon nanotubes and other advanced materials pose some level of substitution threat. However, graphene's superior properties often outweigh these alternatives.
- End-User Trends: Growing demand from electronics, energy storage, and biomedical sectors is fueling market growth. The increasing adoption of smart devices and electric vehicles is further driving the demand for high-performance materials.
- M&A Activities: The acquisition of Applied Graphene Materials by Universal Matter in March 2023 highlights the ongoing consolidation within the industry. Such activities are expected to continue, leading to a more consolidated market structure in the coming years.
Graphene Market Industry Trends & Analysis
The graphene market is witnessing robust growth driven by several key factors. Technological advancements are continuously improving graphene's production methods, making it more cost-effective and accessible. The increasing demand for lightweight, high-strength, and electrically conductive materials across various industries further fuels market expansion. Consumer preferences for sustainable and high-performance products also contribute to the growth. However, challenges remain in terms of scaling up production, addressing consistency issues, and ensuring the widespread adoption of graphene across diverse applications. The market penetration rate for graphene in various end-use sectors is gradually increasing, with electronics and energy storage showing the highest adoption rates. The overall market is expected to witness significant growth, with a projected CAGR of xx% during the forecast period (2025-2033). This growth is significantly influenced by technological advancements leading to improvements in conductivity, strength, and production efficiency.
Leading Markets & Segments in Graphene Market
The Asia-Pacific region is currently the dominant market for graphene, driven by robust economic growth, increasing industrialization, and significant investments in research and development. Within product types, Graphene sheets and films currently hold the largest market share due to their wide range of applications. The electronics and telecommunication sector is the leading end-user industry, followed by the energy and biomedical sectors.
- Key Drivers in Asia-Pacific:
- Strong government support for advanced materials research and development.
- Growing electronics manufacturing base.
- Expanding renewable energy sector.
- Dominance Analysis: China and South Korea are leading contributors within Asia-Pacific, benefiting from established manufacturing capabilities and strong technological expertise. The European and North American markets are also experiencing significant growth, driven by increasing adoption in high-value applications.
- Product Type Segmentation: Graphene sheets and films dominate due to their versatility. Nanoplatelets are gaining traction in the energy sector. Graphene oxide is extensively used in biomedical applications.
- End-user Industry Segmentation: The electronics and telecommunication industry's reliance on advanced materials drives high graphene demand. The energy and biomedical sectors are rapidly adopting graphene for enhanced performance and functionality.
Graphene Market Product Developments
Recent years have witnessed significant advancements in graphene production techniques, focusing on improving quality, consistency, and cost-effectiveness. New applications are constantly emerging, expanding graphene's market reach. The development of composite materials incorporating graphene enhances the mechanical, electrical, and thermal properties of various products, leading to competitive advantages for manufacturers. Advances in CVD (Chemical Vapor Deposition) and other synthesis techniques are critical in delivering high-quality graphene at scale.
Key Drivers of Graphene Market Growth
Several factors are propelling the graphene market's growth. Technological advancements in production and processing have reduced costs and improved quality. The increasing demand for lightweight, high-strength materials in various industries is a major driver. Government support and investments in research and development further stimulate market expansion. For example, the EU's Horizon Europe program actively funds graphene-related projects. Moreover, the growing adoption of graphene in energy storage and electronics is significantly impacting market growth.
Challenges in the Graphene Market Market
Despite its potential, the graphene market faces several challenges. Inconsistent quality and scalability of production can hinder widespread adoption. The high initial cost of production, especially for high-quality graphene, poses a barrier for some applications. Also, competition from other advanced materials and potential regulatory hurdles in certain regions can impact market growth. These challenges, if not appropriately addressed, could limit the market’s overall expansion. Estimates suggest that inconsistency in graphene production currently accounts for approximately xx% of production losses.
Emerging Opportunities in Graphene Market
The graphene market presents substantial long-term growth opportunities. Technological breakthroughs in production techniques, particularly in large-scale production of high-quality graphene, are expected to significantly drive cost reductions. Strategic partnerships between material manufacturers and end-users will facilitate the integration of graphene in diverse applications. Further exploration and development of new applications in sectors such as water purification and flexible electronics will continue to open new avenues for market expansion.
Leading Players in the Graphene Market Sector
- Nanoxplore Inc
- Vorbeck Materials Corp
- ACS Material
- First Graphene
- G6 Materials Corp
- Changzhou Two-Dimensional Carbon Technology Co Ltd
- Morsh (Ningbo Moxi Technology Co Ltd)
- The Sixth Element (Changzhou) Materials Technology Co Ltd
- Perpetuus Advanced Materials PLC
- Xiamen Knano Graphene Technology Corporation Limited
- Neograf
- Universal Matter
- Grafoid Inc
- Graphene Production
- Global Graphene Group
- Graphenano Group
- Thomas Swan & Co Ltd
- Haydale Graphene Industries PLC
- Graphenea
- Elcora Advanced Materials Corp
- Versarien PLC
- Graphene Manufacturing Group Ltd
Key Milestones in Graphene Market Industry
- March 2023: Universal Matter acquires Applied Graphene Materials, strengthening its market position.
- February 2023: Global Graphene Group's Honeycomb Battery Company partners with Nubia Brand International Corp. to develop graphene-based battery materials.
Strategic Outlook for Graphene Market Market
The graphene market holds immense potential for future growth. Continuous advancements in production technologies and the discovery of new applications will drive market expansion. Strategic alliances between graphene producers and end-users will facilitate wider adoption across various sectors. The market's future trajectory hinges on overcoming production challenges, maintaining quality consistency, and exploring novel applications. Focus on sustainability and cost reduction will further strengthen its market position.
Graphene Market Segmentation
-
1. Product Type
- 1.1. Graphene Sheets and Films
- 1.2. Nanoribbons
- 1.3. Nanoplatelets
- 1.4. Graphene Oxide
- 1.5. Other Product Types
-
2. End-user Industry
- 2.1. Electronics and Telecommunication
- 2.2. Bio-medical and Healthcare
- 2.3. Energy
- 2.4. Aerospace and Defense
- 2.5. Other End-user Industries
Graphene Market Segmentation By Geography
-
1. Asia Pacific
- 1.1. China
- 1.2. India
- 1.3. Japan
- 1.4. South Korea
- 1.5. Malaysia
- 1.6. Thailand
- 1.7. Indonesia
- 1.8. Vietnam
- 1.9. Rest of Asia Pacific
-
2. North America
- 2.1. United States
- 2.2. Canada
- 2.3. Mexico
-
3. Europe
- 3.1. Germany
- 3.2. United Kingdom
- 3.3. France
- 3.4. Italy
- 3.5. Spain
- 3.6. NORDIC Countries
- 3.7. Turkey
- 3.8. Russia
- 3.9. Rest of Europe
-
4. South America
- 4.1. Brazil
- 4.2. Argentina
- 4.3. Colombia
- 4.4. Rest of South America
-
5. Middle East and Africa
- 5.1. Saudi Arabia
- 5.2. Qatar
- 5.3. United Arab Emirates
- 5.4. Nigeria
- 5.5. Egypt
- 5.6. South Africa
- 5.7. Rest of Middle East and Africa
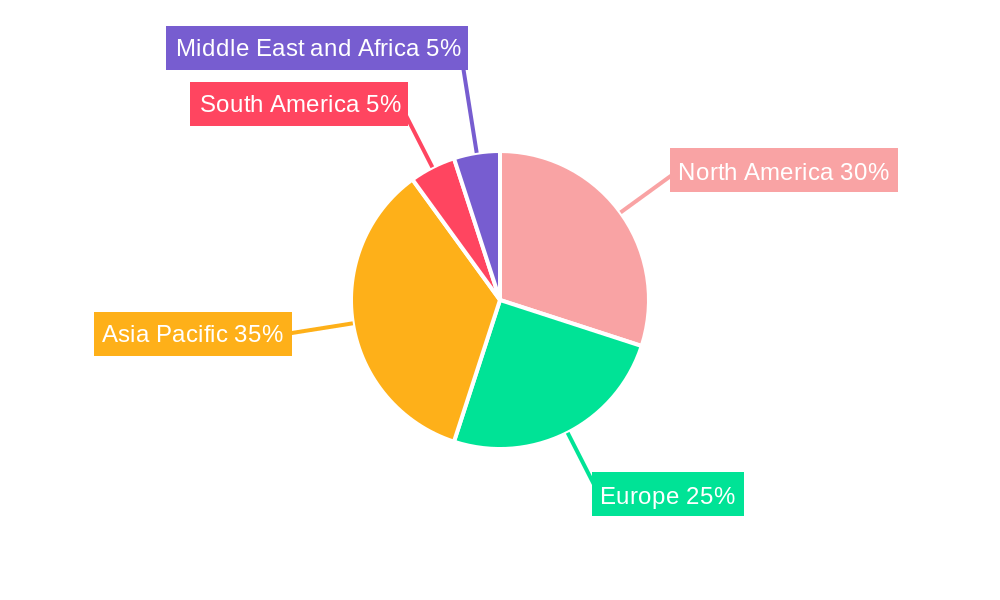
Graphene Market Regional Market Share
Geographic Coverage of Graphene Market
Graphene Market REPORT HIGHLIGHTS
| Aspects | Details |
|---|---|
| Study Period | 2020-2034 |
| Base Year | 2025 |
| Estimated Year | 2026 |
| Forecast Period | 2026-2034 |
| Historical Period | 2020-2025 |
| Growth Rate | CAGR of 43.64% from 2020-2034 |
| Segmentation |
|
Table of Contents
- 1. Introduction
- 1.1. Research Scope
- 1.2. Market Segmentation
- 1.3. Research Objective
- 1.4. Definitions and Assumptions
- 2. Executive Summary
- 2.1. Market Snapshot
- 3. Market Dynamics
- 3.1. Market Drivers
- 3.2. Market Restrains
- 3.3. Market Trends
- 3.4. Market Opportunities
- 4. Market Factor Analysis
- 4.1. Porters Five Forces
- 4.1.1. Bargaining Power of Suppliers
- 4.1.2. Bargaining Power of Buyers
- 4.1.3. Threat of New Entrants
- 4.1.4. Threat of Substitutes
- 4.1.5. Competitive Rivalry
- 4.2. PESTEL analysis
- 4.3. BCG Analysis
- 4.3.1. Stars (High Growth, High Market Share)
- 4.3.2. Cash Cows (Low Growth, High Market Share)
- 4.3.3. Question Mark (High Growth, Low Market Share)
- 4.3.4. Dogs (Low Growth, Low Market Share)
- 4.4. Ansoff Matrix Analysis
- 4.5. Supply Chain Analysis
- 4.6. Regulatory Landscape
- 4.7. Current Market Potential and Opportunity Assessment (TAM–SAM–SOM Framework)
- 4.8. MDP Analyst Note
- 4.1. Porters Five Forces
- 5. Market Analysis, Insights and Forecast 2021-2033
- 5.1. Market Analysis, Insights and Forecast - by Product Type
- 5.1.1. Graphene Sheets and Films
- 5.1.2. Nanoribbons
- 5.1.3. Nanoplatelets
- 5.1.4. Graphene Oxide
- 5.1.5. Other Product Types
- 5.2. Market Analysis, Insights and Forecast - by End-user Industry
- 5.2.1. Electronics and Telecommunication
- 5.2.2. Bio-medical and Healthcare
- 5.2.3. Energy
- 5.2.4. Aerospace and Defense
- 5.2.5. Other End-user Industries
- 5.3. Market Analysis, Insights and Forecast - by Region
- 5.3.1. Asia Pacific
- 5.3.2. North America
- 5.3.3. Europe
- 5.3.4. South America
- 5.3.5. Middle East and Africa
- 5.1. Market Analysis, Insights and Forecast - by Product Type
- 6. Global Graphene Market Analysis, Insights and Forecast, 2021-2033
- 6.1. Market Analysis, Insights and Forecast - by Product Type
- 6.1.1. Graphene Sheets and Films
- 6.1.2. Nanoribbons
- 6.1.3. Nanoplatelets
- 6.1.4. Graphene Oxide
- 6.1.5. Other Product Types
- 6.2. Market Analysis, Insights and Forecast - by End-user Industry
- 6.2.1. Electronics and Telecommunication
- 6.2.2. Bio-medical and Healthcare
- 6.2.3. Energy
- 6.2.4. Aerospace and Defense
- 6.2.5. Other End-user Industries
- 6.1. Market Analysis, Insights and Forecast - by Product Type
- 7. Asia Pacific Graphene Market Analysis, Insights and Forecast, 2020-2032
- 7.1. Market Analysis, Insights and Forecast - by Product Type
- 7.1.1. Graphene Sheets and Films
- 7.1.2. Nanoribbons
- 7.1.3. Nanoplatelets
- 7.1.4. Graphene Oxide
- 7.1.5. Other Product Types
- 7.2. Market Analysis, Insights and Forecast - by End-user Industry
- 7.2.1. Electronics and Telecommunication
- 7.2.2. Bio-medical and Healthcare
- 7.2.3. Energy
- 7.2.4. Aerospace and Defense
- 7.2.5. Other End-user Industries
- 7.1. Market Analysis, Insights and Forecast - by Product Type
- 8. North America Graphene Market Analysis, Insights and Forecast, 2020-2032
- 8.1. Market Analysis, Insights and Forecast - by Product Type
- 8.1.1. Graphene Sheets and Films
- 8.1.2. Nanoribbons
- 8.1.3. Nanoplatelets
- 8.1.4. Graphene Oxide
- 8.1.5. Other Product Types
- 8.2. Market Analysis, Insights and Forecast - by End-user Industry
- 8.2.1. Electronics and Telecommunication
- 8.2.2. Bio-medical and Healthcare
- 8.2.3. Energy
- 8.2.4. Aerospace and Defense
- 8.2.5. Other End-user Industries
- 8.1. Market Analysis, Insights and Forecast - by Product Type
- 9. Europe Graphene Market Analysis, Insights and Forecast, 2020-2032
- 9.1. Market Analysis, Insights and Forecast - by Product Type
- 9.1.1. Graphene Sheets and Films
- 9.1.2. Nanoribbons
- 9.1.3. Nanoplatelets
- 9.1.4. Graphene Oxide
- 9.1.5. Other Product Types
- 9.2. Market Analysis, Insights and Forecast - by End-user Industry
- 9.2.1. Electronics and Telecommunication
- 9.2.2. Bio-medical and Healthcare
- 9.2.3. Energy
- 9.2.4. Aerospace and Defense
- 9.2.5. Other End-user Industries
- 9.1. Market Analysis, Insights and Forecast - by Product Type
- 10. South America Graphene Market Analysis, Insights and Forecast, 2020-2032
- 10.1. Market Analysis, Insights and Forecast - by Product Type
- 10.1.1. Graphene Sheets and Films
- 10.1.2. Nanoribbons
- 10.1.3. Nanoplatelets
- 10.1.4. Graphene Oxide
- 10.1.5. Other Product Types
- 10.2. Market Analysis, Insights and Forecast - by End-user Industry
- 10.2.1. Electronics and Telecommunication
- 10.2.2. Bio-medical and Healthcare
- 10.2.3. Energy
- 10.2.4. Aerospace and Defense
- 10.2.5. Other End-user Industries
- 10.1. Market Analysis, Insights and Forecast - by Product Type
- 11. Middle East and Africa Graphene Market Analysis, Insights and Forecast, 2020-2032
- 11.1. Market Analysis, Insights and Forecast - by Product Type
- 11.1.1. Graphene Sheets and Films
- 11.1.2. Nanoribbons
- 11.1.3. Nanoplatelets
- 11.1.4. Graphene Oxide
- 11.1.5. Other Product Types
- 11.2. Market Analysis, Insights and Forecast - by End-user Industry
- 11.2.1. Electronics and Telecommunication
- 11.2.2. Bio-medical and Healthcare
- 11.2.3. Energy
- 11.2.4. Aerospace and Defense
- 11.2.5. Other End-user Industries
- 11.1. Market Analysis, Insights and Forecast - by Product Type
- 12. Competitive Analysis
- 12.1. Company Profiles
- 12.1.1 Nanoxplore Inc
- 12.1.1.1. Company Overview
- 12.1.1.2. Products
- 12.1.1.3. Company Financials
- 12.1.1.4. SWOT Analysis
- 12.1.2 Vorbeck Materials Corp
- 12.1.2.1. Company Overview
- 12.1.2.2. Products
- 12.1.2.3. Company Financials
- 12.1.2.4. SWOT Analysis
- 12.1.3 ACS Material
- 12.1.3.1. Company Overview
- 12.1.3.2. Products
- 12.1.3.3. Company Financials
- 12.1.3.4. SWOT Analysis
- 12.1.4 First Graphene
- 12.1.4.1. Company Overview
- 12.1.4.2. Products
- 12.1.4.3. Company Financials
- 12.1.4.4. SWOT Analysis
- 12.1.5 G6 Materials Corp
- 12.1.5.1. Company Overview
- 12.1.5.2. Products
- 12.1.5.3. Company Financials
- 12.1.5.4. SWOT Analysis
- 12.1.6 Changzhou Two-Dimensional Carbon Technology Co Ltd
- 12.1.6.1. Company Overview
- 12.1.6.2. Products
- 12.1.6.3. Company Financials
- 12.1.6.4. SWOT Analysis
- 12.1.7 Morsh (Ningbo Moxi Technology Co Ltd)
- 12.1.7.1. Company Overview
- 12.1.7.2. Products
- 12.1.7.3. Company Financials
- 12.1.7.4. SWOT Analysis
- 12.1.8 The Sixth Element (Changzhou) Materials Technology Co Ltd
- 12.1.8.1. Company Overview
- 12.1.8.2. Products
- 12.1.8.3. Company Financials
- 12.1.8.4. SWOT Analysis
- 12.1.9 Perpetuus Advanced Materials PLC
- 12.1.9.1. Company Overview
- 12.1.9.2. Products
- 12.1.9.3. Company Financials
- 12.1.9.4. SWOT Analysis
- 12.1.10 Xiamen Knano Graphene Technology Corporation Limited*List Not Exhaustive
- 12.1.10.1. Company Overview
- 12.1.10.2. Products
- 12.1.10.3. Company Financials
- 12.1.10.4. SWOT Analysis
- 12.1.11 Neograf
- 12.1.11.1. Company Overview
- 12.1.11.2. Products
- 12.1.11.3. Company Financials
- 12.1.11.4. SWOT Analysis
- 12.1.12 Universal Matter
- 12.1.12.1. Company Overview
- 12.1.12.2. Products
- 12.1.12.3. Company Financials
- 12.1.12.4. SWOT Analysis
- 12.1.13 Grafoid Inc
- 12.1.13.1. Company Overview
- 12.1.13.2. Products
- 12.1.13.3. Company Financials
- 12.1.13.4. SWOT Analysis
- 12.1.14 Graphene Production
- 12.1.14.1. Company Overview
- 12.1.14.2. Products
- 12.1.14.3. Company Financials
- 12.1.14.4. SWOT Analysis
- 12.1.15 Global Graphene Group
- 12.1.15.1. Company Overview
- 12.1.15.2. Products
- 12.1.15.3. Company Financials
- 12.1.15.4. SWOT Analysis
- 12.1.16 Graphenano Group
- 12.1.16.1. Company Overview
- 12.1.16.2. Products
- 12.1.16.3. Company Financials
- 12.1.16.4. SWOT Analysis
- 12.1.17 Thomas Swan & Co Ltd
- 12.1.17.1. Company Overview
- 12.1.17.2. Products
- 12.1.17.3. Company Financials
- 12.1.17.4. SWOT Analysis
- 12.1.18 Haydale Graphene Industries PLC
- 12.1.18.1. Company Overview
- 12.1.18.2. Products
- 12.1.18.3. Company Financials
- 12.1.18.4. SWOT Analysis
- 12.1.19 Graphenea
- 12.1.19.1. Company Overview
- 12.1.19.2. Products
- 12.1.19.3. Company Financials
- 12.1.19.4. SWOT Analysis
- 12.1.20 Elcora Advanced Materials Corp
- 12.1.20.1. Company Overview
- 12.1.20.2. Products
- 12.1.20.3. Company Financials
- 12.1.20.4. SWOT Analysis
- 12.1.21 Versarien PLC
- 12.1.21.1. Company Overview
- 12.1.21.2. Products
- 12.1.21.3. Company Financials
- 12.1.21.4. SWOT Analysis
- 12.1.22 Graphene Manufacturing Group Ltd
- 12.1.22.1. Company Overview
- 12.1.22.2. Products
- 12.1.22.3. Company Financials
- 12.1.22.4. SWOT Analysis
- 12.1.1 Nanoxplore Inc
- 12.2. Market Entropy
- 12.2.1 Company's Key Areas Served
- 12.2.2 Recent Developments
- 12.3. Company Market Share Analysis 2025
- 12.3.1 Top 5 Companies Market Share Analysis
- 12.3.2 Top 3 Companies Market Share Analysis
- 12.4. List of Potential Customers
- 13. Research Methodology
List of Figures
- Figure 1: Global Graphene Market Revenue Breakdown (Million, %) by Region 2025 & 2033
- Figure 2: Asia Pacific Graphene Market Revenue (Million), by Product Type 2025 & 2033
- Figure 3: Asia Pacific Graphene Market Revenue Share (%), by Product Type 2025 & 2033
- Figure 4: Asia Pacific Graphene Market Revenue (Million), by End-user Industry 2025 & 2033
- Figure 5: Asia Pacific Graphene Market Revenue Share (%), by End-user Industry 2025 & 2033
- Figure 6: Asia Pacific Graphene Market Revenue (Million), by Country 2025 & 2033
- Figure 7: Asia Pacific Graphene Market Revenue Share (%), by Country 2025 & 2033
- Figure 8: North America Graphene Market Revenue (Million), by Product Type 2025 & 2033
- Figure 9: North America Graphene Market Revenue Share (%), by Product Type 2025 & 2033
- Figure 10: North America Graphene Market Revenue (Million), by End-user Industry 2025 & 2033
- Figure 11: North America Graphene Market Revenue Share (%), by End-user Industry 2025 & 2033
- Figure 12: North America Graphene Market Revenue (Million), by Country 2025 & 2033
- Figure 13: North America Graphene Market Revenue Share (%), by Country 2025 & 2033
- Figure 14: Europe Graphene Market Revenue (Million), by Product Type 2025 & 2033
- Figure 15: Europe Graphene Market Revenue Share (%), by Product Type 2025 & 2033
- Figure 16: Europe Graphene Market Revenue (Million), by End-user Industry 2025 & 2033
- Figure 17: Europe Graphene Market Revenue Share (%), by End-user Industry 2025 & 2033
- Figure 18: Europe Graphene Market Revenue (Million), by Country 2025 & 2033
- Figure 19: Europe Graphene Market Revenue Share (%), by Country 2025 & 2033
- Figure 20: South America Graphene Market Revenue (Million), by Product Type 2025 & 2033
- Figure 21: South America Graphene Market Revenue Share (%), by Product Type 2025 & 2033
- Figure 22: South America Graphene Market Revenue (Million), by End-user Industry 2025 & 2033
- Figure 23: South America Graphene Market Revenue Share (%), by End-user Industry 2025 & 2033
- Figure 24: South America Graphene Market Revenue (Million), by Country 2025 & 2033
- Figure 25: South America Graphene Market Revenue Share (%), by Country 2025 & 2033
- Figure 26: Middle East and Africa Graphene Market Revenue (Million), by Product Type 2025 & 2033
- Figure 27: Middle East and Africa Graphene Market Revenue Share (%), by Product Type 2025 & 2033
- Figure 28: Middle East and Africa Graphene Market Revenue (Million), by End-user Industry 2025 & 2033
- Figure 29: Middle East and Africa Graphene Market Revenue Share (%), by End-user Industry 2025 & 2033
- Figure 30: Middle East and Africa Graphene Market Revenue (Million), by Country 2025 & 2033
- Figure 31: Middle East and Africa Graphene Market Revenue Share (%), by Country 2025 & 2033
List of Tables
- Table 1: Global Graphene Market Revenue Million Forecast, by Product Type 2020 & 2033
- Table 2: Global Graphene Market Revenue Million Forecast, by End-user Industry 2020 & 2033
- Table 3: Global Graphene Market Revenue Million Forecast, by Region 2020 & 2033
- Table 4: Global Graphene Market Revenue Million Forecast, by Product Type 2020 & 2033
- Table 5: Global Graphene Market Revenue Million Forecast, by End-user Industry 2020 & 2033
- Table 6: Global Graphene Market Revenue Million Forecast, by Country 2020 & 2033
- Table 7: China Graphene Market Revenue (Million) Forecast, by Application 2020 & 2033
- Table 8: India Graphene Market Revenue (Million) Forecast, by Application 2020 & 2033
- Table 9: Japan Graphene Market Revenue (Million) Forecast, by Application 2020 & 2033
- Table 10: South Korea Graphene Market Revenue (Million) Forecast, by Application 2020 & 2033
- Table 11: Malaysia Graphene Market Revenue (Million) Forecast, by Application 2020 & 2033
- Table 12: Thailand Graphene Market Revenue (Million) Forecast, by Application 2020 & 2033
- Table 13: Indonesia Graphene Market Revenue (Million) Forecast, by Application 2020 & 2033
- Table 14: Vietnam Graphene Market Revenue (Million) Forecast, by Application 2020 & 2033
- Table 15: Rest of Asia Pacific Graphene Market Revenue (Million) Forecast, by Application 2020 & 2033
- Table 16: Global Graphene Market Revenue Million Forecast, by Product Type 2020 & 2033
- Table 17: Global Graphene Market Revenue Million Forecast, by End-user Industry 2020 & 2033
- Table 18: Global Graphene Market Revenue Million Forecast, by Country 2020 & 2033
- Table 19: United States Graphene Market Revenue (Million) Forecast, by Application 2020 & 2033
- Table 20: Canada Graphene Market Revenue (Million) Forecast, by Application 2020 & 2033
- Table 21: Mexico Graphene Market Revenue (Million) Forecast, by Application 2020 & 2033
- Table 22: Global Graphene Market Revenue Million Forecast, by Product Type 2020 & 2033
- Table 23: Global Graphene Market Revenue Million Forecast, by End-user Industry 2020 & 2033
- Table 24: Global Graphene Market Revenue Million Forecast, by Country 2020 & 2033
- Table 25: Germany Graphene Market Revenue (Million) Forecast, by Application 2020 & 2033
- Table 26: United Kingdom Graphene Market Revenue (Million) Forecast, by Application 2020 & 2033
- Table 27: France Graphene Market Revenue (Million) Forecast, by Application 2020 & 2033
- Table 28: Italy Graphene Market Revenue (Million) Forecast, by Application 2020 & 2033
- Table 29: Spain Graphene Market Revenue (Million) Forecast, by Application 2020 & 2033
- Table 30: NORDIC Countries Graphene Market Revenue (Million) Forecast, by Application 2020 & 2033
- Table 31: Turkey Graphene Market Revenue (Million) Forecast, by Application 2020 & 2033
- Table 32: Russia Graphene Market Revenue (Million) Forecast, by Application 2020 & 2033
- Table 33: Rest of Europe Graphene Market Revenue (Million) Forecast, by Application 2020 & 2033
- Table 34: Global Graphene Market Revenue Million Forecast, by Product Type 2020 & 2033
- Table 35: Global Graphene Market Revenue Million Forecast, by End-user Industry 2020 & 2033
- Table 36: Global Graphene Market Revenue Million Forecast, by Country 2020 & 2033
- Table 37: Brazil Graphene Market Revenue (Million) Forecast, by Application 2020 & 2033
- Table 38: Argentina Graphene Market Revenue (Million) Forecast, by Application 2020 & 2033
- Table 39: Colombia Graphene Market Revenue (Million) Forecast, by Application 2020 & 2033
- Table 40: Rest of South America Graphene Market Revenue (Million) Forecast, by Application 2020 & 2033
- Table 41: Global Graphene Market Revenue Million Forecast, by Product Type 2020 & 2033
- Table 42: Global Graphene Market Revenue Million Forecast, by End-user Industry 2020 & 2033
- Table 43: Global Graphene Market Revenue Million Forecast, by Country 2020 & 2033
- Table 44: Saudi Arabia Graphene Market Revenue (Million) Forecast, by Application 2020 & 2033
- Table 45: Qatar Graphene Market Revenue (Million) Forecast, by Application 2020 & 2033
- Table 46: United Arab Emirates Graphene Market Revenue (Million) Forecast, by Application 2020 & 2033
- Table 47: Nigeria Graphene Market Revenue (Million) Forecast, by Application 2020 & 2033
- Table 48: Egypt Graphene Market Revenue (Million) Forecast, by Application 2020 & 2033
- Table 49: South Africa Graphene Market Revenue (Million) Forecast, by Application 2020 & 2033
- Table 50: Rest of Middle East and Africa Graphene Market Revenue (Million) Forecast, by Application 2020 & 2033
Frequently Asked Questions
1. What is the projected Compound Annual Growth Rate (CAGR) of the Graphene Market?
The projected CAGR is approximately 43.64%.
2. Which companies are prominent players in the Graphene Market?
Key companies in the market include Nanoxplore Inc, Vorbeck Materials Corp, ACS Material, First Graphene, G6 Materials Corp, Changzhou Two-Dimensional Carbon Technology Co Ltd, Morsh (Ningbo Moxi Technology Co Ltd), The Sixth Element (Changzhou) Materials Technology Co Ltd, Perpetuus Advanced Materials PLC, Xiamen Knano Graphene Technology Corporation Limited*List Not Exhaustive, Neograf, Universal Matter, Grafoid Inc, Graphene Production, Global Graphene Group, Graphenano Group, Thomas Swan & Co Ltd, Haydale Graphene Industries PLC, Graphenea, Elcora Advanced Materials Corp, Versarien PLC, Graphene Manufacturing Group Ltd.
3. What are the main segments of the Graphene Market?
The market segments include Product Type, End-user Industry.
4. Can you provide details about the market size?
The market size is estimated to be USD 0.79 Million as of 2022.
5. What are some drivers contributing to market growth?
Graphene Aiding the Aerospace Industry; Rising Demand for Printed Electronics.
6. What are the notable trends driving market growth?
Electronics and Telecommunication Segment to Dominate the Market.
7. Are there any restraints impacting market growth?
Higher Costs of Technology.
8. Can you provide examples of recent developments in the market?
In March 2023, Universal Matter UK Limited, a wholly-owned subsidiary of Universal Matter Inc., announced the acquisition of Applied Graphene Materials UK Limited and Applied Graphene Materials LLC, the principal operating subsidiaries of Applied Graphene Materials PLC. Through the acquisition, the company has strengthened its market presence.
9. What pricing options are available for accessing the report?
Pricing options include single-user, multi-user, and enterprise licenses priced at USD 4750, USD 5250, and USD 8750 respectively.
10. Is the market size provided in terms of value or volume?
The market size is provided in terms of value, measured in Million.
11. Are there any specific market keywords associated with the report?
Yes, the market keyword associated with the report is "Graphene Market," which aids in identifying and referencing the specific market segment covered.
12. How do I determine which pricing option suits my needs best?
The pricing options vary based on user requirements and access needs. Individual users may opt for single-user licenses, while businesses requiring broader access may choose multi-user or enterprise licenses for cost-effective access to the report.
13. Are there any additional resources or data provided in the Graphene Market report?
While the report offers comprehensive insights, it's advisable to review the specific contents or supplementary materials provided to ascertain if additional resources or data are available.
14. How can I stay updated on further developments or reports in the Graphene Market?
To stay informed about further developments, trends, and reports in the Graphene Market, consider subscribing to industry newsletters, following relevant companies and organizations, or regularly checking reputable industry news sources and publications.
Methodology
Step 1 - Identification of Relevant Samples Size from Population Database


Step 2 - Approaches for Defining Global Market Size (Value, Volume* & Price*)

Note*: In applicable scenarios
Step 3 - Data Sources
Primary Research
- Web Analytics
- Survey Reports
- Research Institute
- Latest Research Reports
- Opinion Leaders
Secondary Research
- Annual Reports
- White Paper
- Latest Press Release
- Industry Association
- Paid Database
- Investor Presentations

Step 4 - Data Triangulation
Involves using different sources of information in order to increase the validity of a study
These sources are likely to be stakeholders in a program - participants, other researchers, program staff, other community members, and so on.
Then we put all data in single framework & apply various statistical tools to find out the dynamic on the market.
During the analysis stage, feedback from the stakeholder groups would be compared to determine areas of agreement as well as areas of divergence