

Key Insights
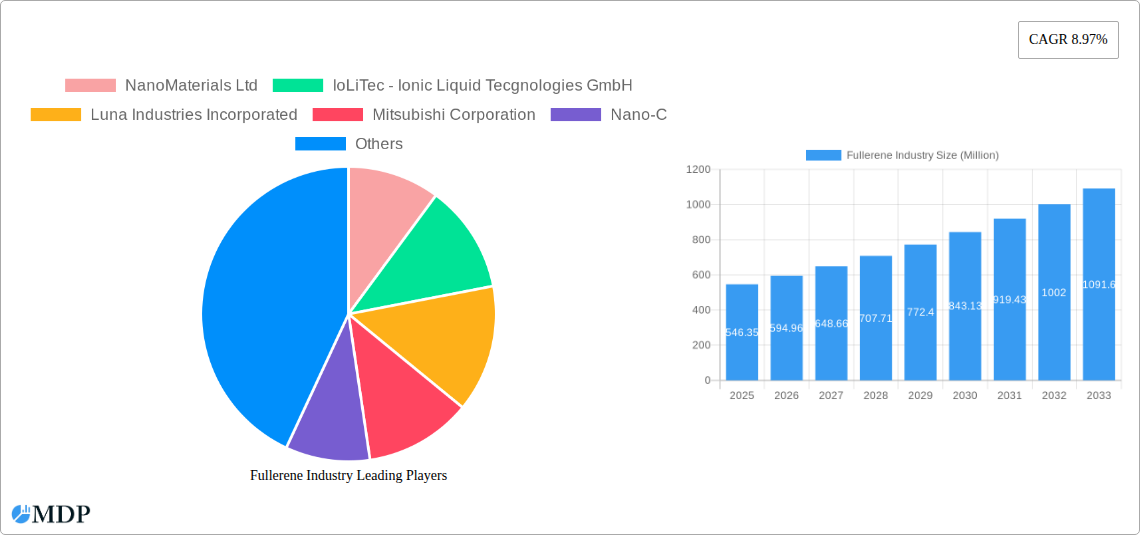
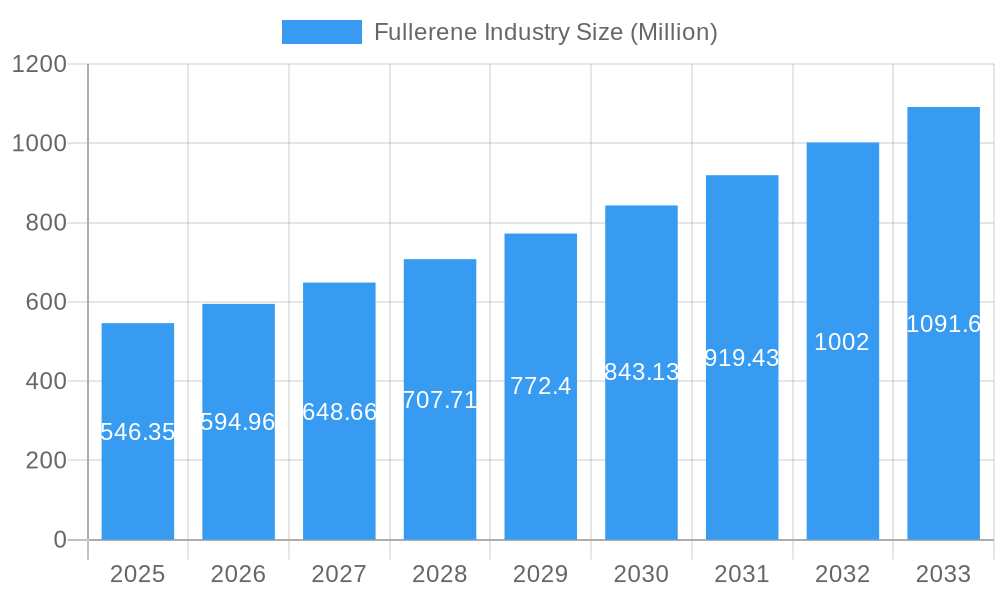
The fullerene industry, valued at $546.35 million in 2025, is projected to experience robust growth, exhibiting a compound annual growth rate (CAGR) of 8.97% from 2025 to 2033. This expansion is driven by increasing applications in diverse sectors, including electronics, medicine, and materials science. The rising demand for high-performance materials with unique electrical and mechanical properties is a key catalyst. Advancements in nanotechnology and the development of novel fullerene-based composites are further fueling market growth. While data on specific segment breakdowns is unavailable, it's reasonable to assume significant contributions from segments like fullerene-based lubricants, drug delivery systems, and conductive inks. Competitive dynamics are shaped by a mix of established players like Mitsubishi Corporation and emerging companies specializing in fullerene synthesis and application development, such as NanoMaterials Ltd and IoLiTec. The industry faces challenges related to the high cost of production and potential scalability issues for certain applications. However, ongoing research and development efforts aimed at optimizing production processes and broadening applications promise to mitigate these challenges and sustain the market's upward trajectory.
Fullerene Industry Market Size (In Million)
Continued technological innovation and the exploration of new applications are expected to be pivotal in shaping the fullerene market's future. The expanding use of fullerenes in energy storage, particularly in advanced batteries and solar cells, presents substantial opportunities. Furthermore, the growing interest in sustainable and eco-friendly materials will likely drive demand for fullerene-based products with superior properties compared to traditional alternatives. The geographical distribution of market share is expected to be influenced by factors like technological advancements, regulatory landscape, and the presence of key industry players across different regions. North America and Europe are likely to remain significant markets, but the Asia-Pacific region, particularly China, could witness substantial growth owing to its expanding manufacturing sector and investments in nanotechnology.
Fullerene Industry Company Market Share
Fullerene Industry Market Report: 2019-2033
This comprehensive report provides a detailed analysis of the Fullerene industry, offering invaluable insights for stakeholders seeking to navigate this dynamic market. From market dynamics and concentration to leading players and future opportunities, this report covers all crucial aspects of the Fullerene industry, providing a clear picture of the current landscape and future projections. The study period spans from 2019 to 2033, with 2025 serving as both the base and estimated year. The forecast period is 2025-2033, and the historical period is 2019-2024. This report is essential for investors, industry professionals, and researchers seeking a complete understanding of this rapidly evolving market.
High-Traffic Keywords: Fullerene market, Fullerene industry, Fullerene applications, Fullerene market size, Fullerene market growth, Fullerene forecast, Fullerene trends, Fullerene industry analysis, Fullerene manufacturers, Fullerene research, nanomaterials, carbon nanomaterials.
Fullerene Industry Market Dynamics & Concentration
The Fullerene industry exhibits a moderately concentrated market structure, with several key players holding significant market share. While precise market share figures for each company require further research, we estimate that the top five companies hold approximately xx% of the global market in 2025. Market concentration is influenced by factors including economies of scale in production, intellectual property rights, and the complexity of Fullerene synthesis.
Key Market Dynamics:
- Innovation Drivers: Ongoing research into new Fullerene derivatives and applications, especially in electronics, medicine, and materials science, are major drivers of market growth.
- Regulatory Frameworks: Government regulations concerning nanomaterial safety and environmental impact influence industry practices and adoption rates.
- Product Substitutes: Competition from alternative materials with similar properties, such as graphene and carbon nanotubes, presents a challenge to Fullerene market expansion.
- End-User Trends: The increasing demand for high-performance materials in diverse sectors, such as energy storage, electronics, and biomedical applications, fuels market growth.
- M&A Activities: The number of mergers and acquisitions (M&A) deals in the Fullerene industry has been xx in the past five years, indicating industry consolidation and strategic expansion efforts.
Fullerene Industry Industry Trends & Analysis
The Fullerene market is projected to experience significant growth during the forecast period (2025-2033), with a Compound Annual Growth Rate (CAGR) of xx%. This growth is driven by several key factors: rising demand for advanced materials in various applications, continuous technological advancements in Fullerene synthesis and functionalization, and increasing investments in research and development. Market penetration is steadily increasing, particularly in the electronics and biomedical sectors.
The industry is witnessing significant technological disruptions, with novel synthesis methods enhancing production efficiency and cost-effectiveness. Consumer preference is shifting towards environmentally friendly and sustainable materials, driving demand for eco-friendly Fullerene production methods. The competitive dynamics are characterized by both intense competition among established players and the emergence of new entrants with innovative technologies.
Leading Markets & Segments in Fullerene Industry
While precise data requires further analysis, preliminary findings suggest that the [Region/Country - e.g., North America or China] is currently the leading market for Fullerenes, accounting for approximately xx% of the global market share in 2025.
Key Drivers of Dominance:
- Economic Policies: Supportive government policies promoting technological advancement and nanotechnology research.
- Infrastructure: Well-developed infrastructure supporting research and manufacturing.
- High Demand: Strong demand from key end-use industries such as electronics and biomedical sectors.
Fullerene Industry Product Developments
Recent years have witnessed significant advancements in Fullerene product development, focusing on improving solubility, functionalization techniques, and expanding applications. Innovations include the development of water-soluble Fullerenes for biomedical applications and functionalized Fullerenes with enhanced properties for electronics and materials science. These advancements are enhancing the competitive advantages of Fullerene products, driving market growth and enabling access to new applications.
Key Drivers of Fullerene Industry Growth
The Fullerene industry's growth is driven by several key factors: advancements in synthesis techniques leading to lower production costs and higher purity, increasing demand for high-performance materials in various industries (electronics, energy storage, biomedical), and government support for nanotechnology research and development. The rising adoption of Fullerenes in consumer electronics and medical devices also contributes significantly to market expansion.
Challenges in the Fullerene Industry Market
The Fullerene industry faces challenges such as the high production cost compared to some alternative materials, potential health and environmental concerns associated with nanomaterials, and the need for rigorous quality control and safety standards. Supply chain disruptions can also impact market stability. Competition from substitute materials represents a significant obstacle to market expansion.
Emerging Opportunities in Fullerene Industry
Emerging opportunities for Fullerene market expansion include the development of novel applications in areas such as targeted drug delivery, advanced sensors, and next-generation energy storage devices. Strategic partnerships between industry players and research institutions can drive innovation and accelerate market growth. Exploration of new markets and applications will be key to unlocking the long-term potential of this industry.
Leading Players in the Fullerene Industry Sector
- NanoMaterials Ltd
- IoLiTec - Ionic Liquid Tecgnologies GmbH
- Luna Industries Incorporated
- Mitsubishi Corporation
- Nano-C
- Nanotech Industrial Solutions
- SES Research Inc
- POWDER NANO
- Nanografi Nano technology
Key Milestones in Fullerene Industry Industry
- [Year/Month]: [Specific development, e.g., Launch of a new Fullerene-based product by Company X].
- [Year/Month]: [Specific development, e.g., Announcement of a major merger or acquisition in the industry].
- [Year/Month]: [Specific development, e.g., Publication of significant research findings on Fullerene applications].
Strategic Outlook for Fullerene Industry Market
The Fullerene industry is poised for continued growth, driven by technological advancements and expanding applications across various sectors. Strategic opportunities lie in developing innovative Fullerene-based products, focusing on sustainability and cost-effectiveness, and expanding into new markets. Investments in research and development, coupled with strategic collaborations, are crucial for long-term success in this dynamic market.
Fullerene Industry Segmentation
-
1. Product Type
- 1.1. C60
- 1.2. C70
- 1.3. C76
- 1.4. Other Product Types
-
2. End-user Industry
- 2.1. Electrical and Electronics
- 2.2. Medical and Pharmaceuticals
- 2.3. Aerospace and Defense
- 2.4. Energy
- 2.5. Other End-user Industries
Fullerene Industry Segmentation By Geography
-
1. Asia Pacific
- 1.1. China
- 1.2. India
- 1.3. Japan
- 1.4. South Korea
- 1.5. ASEAN Countries
- 1.6. Rest of Asia Pacific
-
2. North America
- 2.1. United States
- 2.2. Canada
- 2.3. Mexico
-
3. Europe
- 3.1. Germany
- 3.2. United Kingdom
- 3.3. France
- 3.4. Italy
- 3.5. Rest of Europe
-
4. South America
- 4.1. Brazil
- 4.2. Argentina
- 4.3. Rest of South America
-
5. Middle East and Africa
- 5.1. Saudi Arabia
- 5.2. South Africa
- 5.3. Rest of Middle East and Africa

Fullerene Industry Regional Market Share
Geographic Coverage of Fullerene Industry
Fullerene Industry REPORT HIGHLIGHTS
| Aspects | Details |
|---|---|
| Study Period | 2020-2034 |
| Base Year | 2025 |
| Estimated Year | 2026 |
| Forecast Period | 2026-2034 |
| Historical Period | 2020-2025 |
| Growth Rate | CAGR of 8.97% from 2020-2034 |
| Segmentation |
|
Table of Contents
- 1. Introduction
- 1.1. Research Scope
- 1.2. Market Segmentation
- 1.3. Research Objective
- 1.4. Definitions and Assumptions
- 2. Executive Summary
- 2.1. Market Snapshot
- 3. Market Dynamics
- 3.1. Market Drivers
- 3.2. Market Restrains
- 3.3. Market Trends
- 3.4. Market Opportunities
- 4. Market Factor Analysis
- 4.1. Porters Five Forces
- 4.1.1. Bargaining Power of Suppliers
- 4.1.2. Bargaining Power of Buyers
- 4.1.3. Threat of New Entrants
- 4.1.4. Threat of Substitutes
- 4.1.5. Competitive Rivalry
- 4.2. PESTEL analysis
- 4.3. BCG Analysis
- 4.3.1. Stars (High Growth, High Market Share)
- 4.3.2. Cash Cows (Low Growth, High Market Share)
- 4.3.3. Question Mark (High Growth, Low Market Share)
- 4.3.4. Dogs (Low Growth, Low Market Share)
- 4.4. Ansoff Matrix Analysis
- 4.5. Supply Chain Analysis
- 4.6. Regulatory Landscape
- 4.7. Current Market Potential and Opportunity Assessment (TAM–SAM–SOM Framework)
- 4.8. MDP Analyst Note
- 4.1. Porters Five Forces
- 5. Market Analysis, Insights and Forecast 2021-2033
- 5.1. Market Analysis, Insights and Forecast - by Product Type
- 5.1.1. C60
- 5.1.2. C70
- 5.1.3. C76
- 5.1.4. Other Product Types
- 5.2. Market Analysis, Insights and Forecast - by End-user Industry
- 5.2.1. Electrical and Electronics
- 5.2.2. Medical and Pharmaceuticals
- 5.2.3. Aerospace and Defense
- 5.2.4. Energy
- 5.2.5. Other End-user Industries
- 5.3. Market Analysis, Insights and Forecast - by Region
- 5.3.1. Asia Pacific
- 5.3.2. North America
- 5.3.3. Europe
- 5.3.4. South America
- 5.3.5. Middle East and Africa
- 5.1. Market Analysis, Insights and Forecast - by Product Type
- 6. Global Fullerene Industry Analysis, Insights and Forecast, 2021-2033
- 6.1. Market Analysis, Insights and Forecast - by Product Type
- 6.1.1. C60
- 6.1.2. C70
- 6.1.3. C76
- 6.1.4. Other Product Types
- 6.2. Market Analysis, Insights and Forecast - by End-user Industry
- 6.2.1. Electrical and Electronics
- 6.2.2. Medical and Pharmaceuticals
- 6.2.3. Aerospace and Defense
- 6.2.4. Energy
- 6.2.5. Other End-user Industries
- 6.1. Market Analysis, Insights and Forecast - by Product Type
- 7. Asia Pacific Fullerene Industry Analysis, Insights and Forecast, 2020-2032
- 7.1. Market Analysis, Insights and Forecast - by Product Type
- 7.1.1. C60
- 7.1.2. C70
- 7.1.3. C76
- 7.1.4. Other Product Types
- 7.2. Market Analysis, Insights and Forecast - by End-user Industry
- 7.2.1. Electrical and Electronics
- 7.2.2. Medical and Pharmaceuticals
- 7.2.3. Aerospace and Defense
- 7.2.4. Energy
- 7.2.5. Other End-user Industries
- 7.1. Market Analysis, Insights and Forecast - by Product Type
- 8. North America Fullerene Industry Analysis, Insights and Forecast, 2020-2032
- 8.1. Market Analysis, Insights and Forecast - by Product Type
- 8.1.1. C60
- 8.1.2. C70
- 8.1.3. C76
- 8.1.4. Other Product Types
- 8.2. Market Analysis, Insights and Forecast - by End-user Industry
- 8.2.1. Electrical and Electronics
- 8.2.2. Medical and Pharmaceuticals
- 8.2.3. Aerospace and Defense
- 8.2.4. Energy
- 8.2.5. Other End-user Industries
- 8.1. Market Analysis, Insights and Forecast - by Product Type
- 9. Europe Fullerene Industry Analysis, Insights and Forecast, 2020-2032
- 9.1. Market Analysis, Insights and Forecast - by Product Type
- 9.1.1. C60
- 9.1.2. C70
- 9.1.3. C76
- 9.1.4. Other Product Types
- 9.2. Market Analysis, Insights and Forecast - by End-user Industry
- 9.2.1. Electrical and Electronics
- 9.2.2. Medical and Pharmaceuticals
- 9.2.3. Aerospace and Defense
- 9.2.4. Energy
- 9.2.5. Other End-user Industries
- 9.1. Market Analysis, Insights and Forecast - by Product Type
- 10. South America Fullerene Industry Analysis, Insights and Forecast, 2020-2032
- 10.1. Market Analysis, Insights and Forecast - by Product Type
- 10.1.1. C60
- 10.1.2. C70
- 10.1.3. C76
- 10.1.4. Other Product Types
- 10.2. Market Analysis, Insights and Forecast - by End-user Industry
- 10.2.1. Electrical and Electronics
- 10.2.2. Medical and Pharmaceuticals
- 10.2.3. Aerospace and Defense
- 10.2.4. Energy
- 10.2.5. Other End-user Industries
- 10.1. Market Analysis, Insights and Forecast - by Product Type
- 11. Middle East and Africa Fullerene Industry Analysis, Insights and Forecast, 2020-2032
- 11.1. Market Analysis, Insights and Forecast - by Product Type
- 11.1.1. C60
- 11.1.2. C70
- 11.1.3. C76
- 11.1.4. Other Product Types
- 11.2. Market Analysis, Insights and Forecast - by End-user Industry
- 11.2.1. Electrical and Electronics
- 11.2.2. Medical and Pharmaceuticals
- 11.2.3. Aerospace and Defense
- 11.2.4. Energy
- 11.2.5. Other End-user Industries
- 11.1. Market Analysis, Insights and Forecast - by Product Type
- 12. Competitive Analysis
- 12.1. Company Profiles
- 12.1.1 NanoMaterials Ltd
- 12.1.1.1. Company Overview
- 12.1.1.2. Products
- 12.1.1.3. Company Financials
- 12.1.1.4. SWOT Analysis
- 12.1.2 IoLiTec - Ionic Liquid Tecgnologies GmbH
- 12.1.2.1. Company Overview
- 12.1.2.2. Products
- 12.1.2.3. Company Financials
- 12.1.2.4. SWOT Analysis
- 12.1.3 Luna Industries Incorporated
- 12.1.3.1. Company Overview
- 12.1.3.2. Products
- 12.1.3.3. Company Financials
- 12.1.3.4. SWOT Analysis
- 12.1.4 Mitsubishi Corporation
- 12.1.4.1. Company Overview
- 12.1.4.2. Products
- 12.1.4.3. Company Financials
- 12.1.4.4. SWOT Analysis
- 12.1.5 Nano-C
- 12.1.5.1. Company Overview
- 12.1.5.2. Products
- 12.1.5.3. Company Financials
- 12.1.5.4. SWOT Analysis
- 12.1.6 Nanotech Industrial Solutions
- 12.1.6.1. Company Overview
- 12.1.6.2. Products
- 12.1.6.3. Company Financials
- 12.1.6.4. SWOT Analysis
- 12.1.7 SES Research Inc
- 12.1.7.1. Company Overview
- 12.1.7.2. Products
- 12.1.7.3. Company Financials
- 12.1.7.4. SWOT Analysis
- 12.1.8 POWDER NANO
- 12.1.8.1. Company Overview
- 12.1.8.2. Products
- 12.1.8.3. Company Financials
- 12.1.8.4. SWOT Analysis
- 12.1.9 Nanografi Nano technology*List Not Exhaustive
- 12.1.9.1. Company Overview
- 12.1.9.2. Products
- 12.1.9.3. Company Financials
- 12.1.9.4. SWOT Analysis
- 12.1.1 NanoMaterials Ltd
- 12.2. Market Entropy
- 12.2.1 Company's Key Areas Served
- 12.2.2 Recent Developments
- 12.3. Company Market Share Analysis 2025
- 12.3.1 Top 5 Companies Market Share Analysis
- 12.3.2 Top 3 Companies Market Share Analysis
- 12.4. List of Potential Customers
- 13. Research Methodology
List of Figures
- Figure 1: Global Fullerene Industry Revenue Breakdown (Million, %) by Region 2025 & 2033
- Figure 2: Global Fullerene Industry Volume Breakdown (Million, %) by Region 2025 & 2033
- Figure 3: Asia Pacific Fullerene Industry Revenue (Million), by Product Type 2025 & 2033
- Figure 4: Asia Pacific Fullerene Industry Volume (Million), by Product Type 2025 & 2033
- Figure 5: Asia Pacific Fullerene Industry Revenue Share (%), by Product Type 2025 & 2033
- Figure 6: Asia Pacific Fullerene Industry Volume Share (%), by Product Type 2025 & 2033
- Figure 7: Asia Pacific Fullerene Industry Revenue (Million), by End-user Industry 2025 & 2033
- Figure 8: Asia Pacific Fullerene Industry Volume (Million), by End-user Industry 2025 & 2033
- Figure 9: Asia Pacific Fullerene Industry Revenue Share (%), by End-user Industry 2025 & 2033
- Figure 10: Asia Pacific Fullerene Industry Volume Share (%), by End-user Industry 2025 & 2033
- Figure 11: Asia Pacific Fullerene Industry Revenue (Million), by Country 2025 & 2033
- Figure 12: Asia Pacific Fullerene Industry Volume (Million), by Country 2025 & 2033
- Figure 13: Asia Pacific Fullerene Industry Revenue Share (%), by Country 2025 & 2033
- Figure 14: Asia Pacific Fullerene Industry Volume Share (%), by Country 2025 & 2033
- Figure 15: North America Fullerene Industry Revenue (Million), by Product Type 2025 & 2033
- Figure 16: North America Fullerene Industry Volume (Million), by Product Type 2025 & 2033
- Figure 17: North America Fullerene Industry Revenue Share (%), by Product Type 2025 & 2033
- Figure 18: North America Fullerene Industry Volume Share (%), by Product Type 2025 & 2033
- Figure 19: North America Fullerene Industry Revenue (Million), by End-user Industry 2025 & 2033
- Figure 20: North America Fullerene Industry Volume (Million), by End-user Industry 2025 & 2033
- Figure 21: North America Fullerene Industry Revenue Share (%), by End-user Industry 2025 & 2033
- Figure 22: North America Fullerene Industry Volume Share (%), by End-user Industry 2025 & 2033
- Figure 23: North America Fullerene Industry Revenue (Million), by Country 2025 & 2033
- Figure 24: North America Fullerene Industry Volume (Million), by Country 2025 & 2033
- Figure 25: North America Fullerene Industry Revenue Share (%), by Country 2025 & 2033
- Figure 26: North America Fullerene Industry Volume Share (%), by Country 2025 & 2033
- Figure 27: Europe Fullerene Industry Revenue (Million), by Product Type 2025 & 2033
- Figure 28: Europe Fullerene Industry Volume (Million), by Product Type 2025 & 2033
- Figure 29: Europe Fullerene Industry Revenue Share (%), by Product Type 2025 & 2033
- Figure 30: Europe Fullerene Industry Volume Share (%), by Product Type 2025 & 2033
- Figure 31: Europe Fullerene Industry Revenue (Million), by End-user Industry 2025 & 2033
- Figure 32: Europe Fullerene Industry Volume (Million), by End-user Industry 2025 & 2033
- Figure 33: Europe Fullerene Industry Revenue Share (%), by End-user Industry 2025 & 2033
- Figure 34: Europe Fullerene Industry Volume Share (%), by End-user Industry 2025 & 2033
- Figure 35: Europe Fullerene Industry Revenue (Million), by Country 2025 & 2033
- Figure 36: Europe Fullerene Industry Volume (Million), by Country 2025 & 2033
- Figure 37: Europe Fullerene Industry Revenue Share (%), by Country 2025 & 2033
- Figure 38: Europe Fullerene Industry Volume Share (%), by Country 2025 & 2033
- Figure 39: South America Fullerene Industry Revenue (Million), by Product Type 2025 & 2033
- Figure 40: South America Fullerene Industry Volume (Million), by Product Type 2025 & 2033
- Figure 41: South America Fullerene Industry Revenue Share (%), by Product Type 2025 & 2033
- Figure 42: South America Fullerene Industry Volume Share (%), by Product Type 2025 & 2033
- Figure 43: South America Fullerene Industry Revenue (Million), by End-user Industry 2025 & 2033
- Figure 44: South America Fullerene Industry Volume (Million), by End-user Industry 2025 & 2033
- Figure 45: South America Fullerene Industry Revenue Share (%), by End-user Industry 2025 & 2033
- Figure 46: South America Fullerene Industry Volume Share (%), by End-user Industry 2025 & 2033
- Figure 47: South America Fullerene Industry Revenue (Million), by Country 2025 & 2033
- Figure 48: South America Fullerene Industry Volume (Million), by Country 2025 & 2033
- Figure 49: South America Fullerene Industry Revenue Share (%), by Country 2025 & 2033
- Figure 50: South America Fullerene Industry Volume Share (%), by Country 2025 & 2033
- Figure 51: Middle East and Africa Fullerene Industry Revenue (Million), by Product Type 2025 & 2033
- Figure 52: Middle East and Africa Fullerene Industry Volume (Million), by Product Type 2025 & 2033
- Figure 53: Middle East and Africa Fullerene Industry Revenue Share (%), by Product Type 2025 & 2033
- Figure 54: Middle East and Africa Fullerene Industry Volume Share (%), by Product Type 2025 & 2033
- Figure 55: Middle East and Africa Fullerene Industry Revenue (Million), by End-user Industry 2025 & 2033
- Figure 56: Middle East and Africa Fullerene Industry Volume (Million), by End-user Industry 2025 & 2033
- Figure 57: Middle East and Africa Fullerene Industry Revenue Share (%), by End-user Industry 2025 & 2033
- Figure 58: Middle East and Africa Fullerene Industry Volume Share (%), by End-user Industry 2025 & 2033
- Figure 59: Middle East and Africa Fullerene Industry Revenue (Million), by Country 2025 & 2033
- Figure 60: Middle East and Africa Fullerene Industry Volume (Million), by Country 2025 & 2033
- Figure 61: Middle East and Africa Fullerene Industry Revenue Share (%), by Country 2025 & 2033
- Figure 62: Middle East and Africa Fullerene Industry Volume Share (%), by Country 2025 & 2033
List of Tables
- Table 1: Global Fullerene Industry Revenue Million Forecast, by Product Type 2020 & 2033
- Table 2: Global Fullerene Industry Volume Million Forecast, by Product Type 2020 & 2033
- Table 3: Global Fullerene Industry Revenue Million Forecast, by End-user Industry 2020 & 2033
- Table 4: Global Fullerene Industry Volume Million Forecast, by End-user Industry 2020 & 2033
- Table 5: Global Fullerene Industry Revenue Million Forecast, by Region 2020 & 2033
- Table 6: Global Fullerene Industry Volume Million Forecast, by Region 2020 & 2033
- Table 7: Global Fullerene Industry Revenue Million Forecast, by Product Type 2020 & 2033
- Table 8: Global Fullerene Industry Volume Million Forecast, by Product Type 2020 & 2033
- Table 9: Global Fullerene Industry Revenue Million Forecast, by End-user Industry 2020 & 2033
- Table 10: Global Fullerene Industry Volume Million Forecast, by End-user Industry 2020 & 2033
- Table 11: Global Fullerene Industry Revenue Million Forecast, by Country 2020 & 2033
- Table 12: Global Fullerene Industry Volume Million Forecast, by Country 2020 & 2033
- Table 13: China Fullerene Industry Revenue (Million) Forecast, by Application 2020 & 2033
- Table 14: China Fullerene Industry Volume (Million) Forecast, by Application 2020 & 2033
- Table 15: India Fullerene Industry Revenue (Million) Forecast, by Application 2020 & 2033
- Table 16: India Fullerene Industry Volume (Million) Forecast, by Application 2020 & 2033
- Table 17: Japan Fullerene Industry Revenue (Million) Forecast, by Application 2020 & 2033
- Table 18: Japan Fullerene Industry Volume (Million) Forecast, by Application 2020 & 2033
- Table 19: South Korea Fullerene Industry Revenue (Million) Forecast, by Application 2020 & 2033
- Table 20: South Korea Fullerene Industry Volume (Million) Forecast, by Application 2020 & 2033
- Table 21: ASEAN Countries Fullerene Industry Revenue (Million) Forecast, by Application 2020 & 2033
- Table 22: ASEAN Countries Fullerene Industry Volume (Million) Forecast, by Application 2020 & 2033
- Table 23: Rest of Asia Pacific Fullerene Industry Revenue (Million) Forecast, by Application 2020 & 2033
- Table 24: Rest of Asia Pacific Fullerene Industry Volume (Million) Forecast, by Application 2020 & 2033
- Table 25: Global Fullerene Industry Revenue Million Forecast, by Product Type 2020 & 2033
- Table 26: Global Fullerene Industry Volume Million Forecast, by Product Type 2020 & 2033
- Table 27: Global Fullerene Industry Revenue Million Forecast, by End-user Industry 2020 & 2033
- Table 28: Global Fullerene Industry Volume Million Forecast, by End-user Industry 2020 & 2033
- Table 29: Global Fullerene Industry Revenue Million Forecast, by Country 2020 & 2033
- Table 30: Global Fullerene Industry Volume Million Forecast, by Country 2020 & 2033
- Table 31: United States Fullerene Industry Revenue (Million) Forecast, by Application 2020 & 2033
- Table 32: United States Fullerene Industry Volume (Million) Forecast, by Application 2020 & 2033
- Table 33: Canada Fullerene Industry Revenue (Million) Forecast, by Application 2020 & 2033
- Table 34: Canada Fullerene Industry Volume (Million) Forecast, by Application 2020 & 2033
- Table 35: Mexico Fullerene Industry Revenue (Million) Forecast, by Application 2020 & 2033
- Table 36: Mexico Fullerene Industry Volume (Million) Forecast, by Application 2020 & 2033
- Table 37: Global Fullerene Industry Revenue Million Forecast, by Product Type 2020 & 2033
- Table 38: Global Fullerene Industry Volume Million Forecast, by Product Type 2020 & 2033
- Table 39: Global Fullerene Industry Revenue Million Forecast, by End-user Industry 2020 & 2033
- Table 40: Global Fullerene Industry Volume Million Forecast, by End-user Industry 2020 & 2033
- Table 41: Global Fullerene Industry Revenue Million Forecast, by Country 2020 & 2033
- Table 42: Global Fullerene Industry Volume Million Forecast, by Country 2020 & 2033
- Table 43: Germany Fullerene Industry Revenue (Million) Forecast, by Application 2020 & 2033
- Table 44: Germany Fullerene Industry Volume (Million) Forecast, by Application 2020 & 2033
- Table 45: United Kingdom Fullerene Industry Revenue (Million) Forecast, by Application 2020 & 2033
- Table 46: United Kingdom Fullerene Industry Volume (Million) Forecast, by Application 2020 & 2033
- Table 47: France Fullerene Industry Revenue (Million) Forecast, by Application 2020 & 2033
- Table 48: France Fullerene Industry Volume (Million) Forecast, by Application 2020 & 2033
- Table 49: Italy Fullerene Industry Revenue (Million) Forecast, by Application 2020 & 2033
- Table 50: Italy Fullerene Industry Volume (Million) Forecast, by Application 2020 & 2033
- Table 51: Rest of Europe Fullerene Industry Revenue (Million) Forecast, by Application 2020 & 2033
- Table 52: Rest of Europe Fullerene Industry Volume (Million) Forecast, by Application 2020 & 2033
- Table 53: Global Fullerene Industry Revenue Million Forecast, by Product Type 2020 & 2033
- Table 54: Global Fullerene Industry Volume Million Forecast, by Product Type 2020 & 2033
- Table 55: Global Fullerene Industry Revenue Million Forecast, by End-user Industry 2020 & 2033
- Table 56: Global Fullerene Industry Volume Million Forecast, by End-user Industry 2020 & 2033
- Table 57: Global Fullerene Industry Revenue Million Forecast, by Country 2020 & 2033
- Table 58: Global Fullerene Industry Volume Million Forecast, by Country 2020 & 2033
- Table 59: Brazil Fullerene Industry Revenue (Million) Forecast, by Application 2020 & 2033
- Table 60: Brazil Fullerene Industry Volume (Million) Forecast, by Application 2020 & 2033
- Table 61: Argentina Fullerene Industry Revenue (Million) Forecast, by Application 2020 & 2033
- Table 62: Argentina Fullerene Industry Volume (Million) Forecast, by Application 2020 & 2033
- Table 63: Rest of South America Fullerene Industry Revenue (Million) Forecast, by Application 2020 & 2033
- Table 64: Rest of South America Fullerene Industry Volume (Million) Forecast, by Application 2020 & 2033
- Table 65: Global Fullerene Industry Revenue Million Forecast, by Product Type 2020 & 2033
- Table 66: Global Fullerene Industry Volume Million Forecast, by Product Type 2020 & 2033
- Table 67: Global Fullerene Industry Revenue Million Forecast, by End-user Industry 2020 & 2033
- Table 68: Global Fullerene Industry Volume Million Forecast, by End-user Industry 2020 & 2033
- Table 69: Global Fullerene Industry Revenue Million Forecast, by Country 2020 & 2033
- Table 70: Global Fullerene Industry Volume Million Forecast, by Country 2020 & 2033
- Table 71: Saudi Arabia Fullerene Industry Revenue (Million) Forecast, by Application 2020 & 2033
- Table 72: Saudi Arabia Fullerene Industry Volume (Million) Forecast, by Application 2020 & 2033
- Table 73: South Africa Fullerene Industry Revenue (Million) Forecast, by Application 2020 & 2033
- Table 74: South Africa Fullerene Industry Volume (Million) Forecast, by Application 2020 & 2033
- Table 75: Rest of Middle East and Africa Fullerene Industry Revenue (Million) Forecast, by Application 2020 & 2033
- Table 76: Rest of Middle East and Africa Fullerene Industry Volume (Million) Forecast, by Application 2020 & 2033
Frequently Asked Questions
1. What is the projected Compound Annual Growth Rate (CAGR) of the Fullerene Industry?
The projected CAGR is approximately 8.97%.
2. Which companies are prominent players in the Fullerene Industry?
Key companies in the market include NanoMaterials Ltd, IoLiTec - Ionic Liquid Tecgnologies GmbH, Luna Industries Incorporated, Mitsubishi Corporation, Nano-C, Nanotech Industrial Solutions, SES Research Inc, POWDER NANO, Nanografi Nano technology*List Not Exhaustive.
3. What are the main segments of the Fullerene Industry?
The market segments include Product Type, End-user Industry.
4. Can you provide details about the market size?
The market size is estimated to be USD 546.35 Million as of 2022.
5. What are some drivers contributing to market growth?
Increased usage in the Pharmaceutical Industry; Penetration in Surface Coatings Industry due to Strong Metal Matrix; Growing Demand of Fullerene as an Optical Limiter; Other Drivers.
6. What are the notable trends driving market growth?
Increasing Demand from Medical and Pharmaceutical Industry..
7. Are there any restraints impacting market growth?
Increased usage in the Pharmaceutical Industry; Penetration in Surface Coatings Industry due to Strong Metal Matrix; Growing Demand of Fullerene as an Optical Limiter; Other Drivers.
8. Can you provide examples of recent developments in the market?
Recent developments pertaining to the market studied will be covered in the complete report.
9. What pricing options are available for accessing the report?
Pricing options include single-user, multi-user, and enterprise licenses priced at USD 4750, USD 5250, and USD 8750 respectively.
10. Is the market size provided in terms of value or volume?
The market size is provided in terms of value, measured in Million and volume, measured in Million.
11. Are there any specific market keywords associated with the report?
Yes, the market keyword associated with the report is "Fullerene Industry," which aids in identifying and referencing the specific market segment covered.
12. How do I determine which pricing option suits my needs best?
The pricing options vary based on user requirements and access needs. Individual users may opt for single-user licenses, while businesses requiring broader access may choose multi-user or enterprise licenses for cost-effective access to the report.
13. Are there any additional resources or data provided in the Fullerene Industry report?
While the report offers comprehensive insights, it's advisable to review the specific contents or supplementary materials provided to ascertain if additional resources or data are available.
14. How can I stay updated on further developments or reports in the Fullerene Industry?
To stay informed about further developments, trends, and reports in the Fullerene Industry, consider subscribing to industry newsletters, following relevant companies and organizations, or regularly checking reputable industry news sources and publications.
Methodology
Step 1 - Identification of Relevant Samples Size from Population Database


Step 2 - Approaches for Defining Global Market Size (Value, Volume* & Price*)

Note*: In applicable scenarios
Step 3 - Data Sources
Primary Research
- Web Analytics
- Survey Reports
- Research Institute
- Latest Research Reports
- Opinion Leaders
Secondary Research
- Annual Reports
- White Paper
- Latest Press Release
- Industry Association
- Paid Database
- Investor Presentations

Step 4 - Data Triangulation
Involves using different sources of information in order to increase the validity of a study
These sources are likely to be stakeholders in a program - participants, other researchers, program staff, other community members, and so on.
Then we put all data in single framework & apply various statistical tools to find out the dynamic on the market.
During the analysis stage, feedback from the stakeholder groups would be compared to determine areas of agreement as well as areas of divergence