

Key Insights
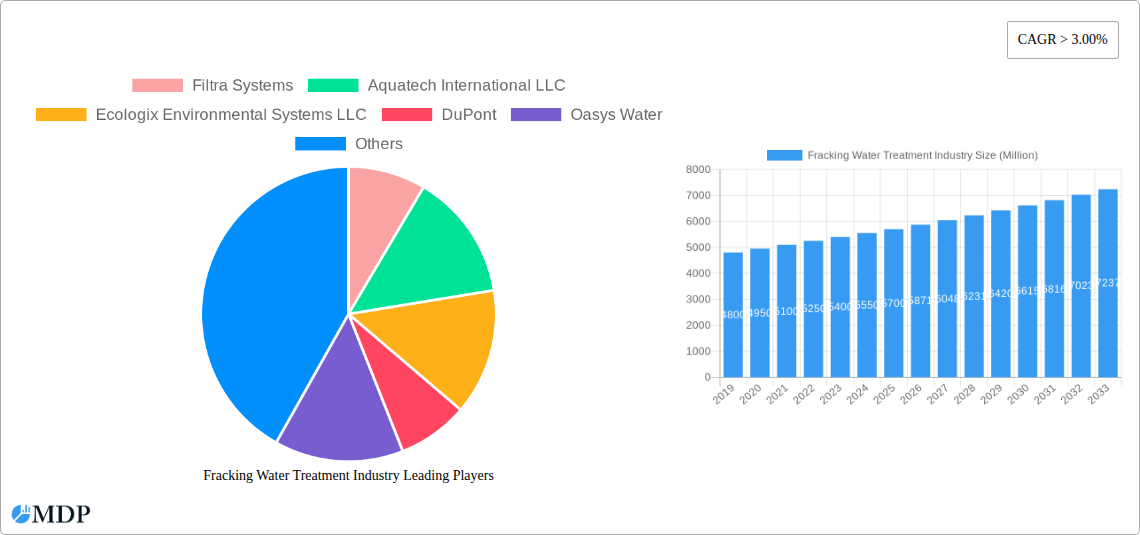
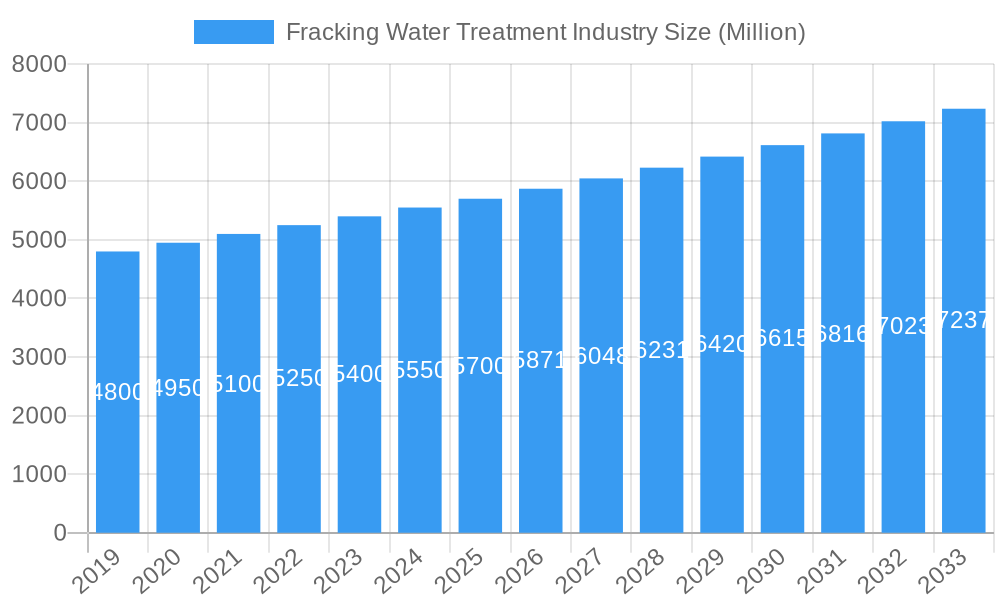
The global Fracking Water Treatment industry is poised for significant growth, projected to reach a market size of approximately \$5,700 million by 2025, with a robust Compound Annual Growth Rate (CAGR) exceeding 3.00% throughout the forecast period of 2019-2033. This expansion is fueled by the increasing demand for energy and the subsequent rise in hydraulic fracturing activities. Key drivers include stringent environmental regulations mandating effective wastewater management, the growing need for water conservation in water-scarce regions, and technological advancements in treatment and recycling solutions. The industry is witnessing a strong trend towards sustainable practices, with a notable shift towards advanced treatment technologies that enable higher recovery rates of water, thereby reducing the reliance on fresh water sources and minimizing the environmental footprint of oil and gas extraction. Furthermore, the development of more cost-effective and efficient treatment methods is making advanced fracking water management accessible to a broader range of operators.
Fracking Water Treatment Industry Market Size (In Billion)
The market is segmented into crucial applications such as Treatment & Recycle, and Deep well Injection, with Treatment & Recycle expected to dominate due to its environmental and economic benefits. The competitive landscape features prominent players like Filtra Systems, Aquatech International LLC, Ecologix Environmental Systems LLC, DuPont, and Veolia Water Technologies, all actively investing in research and development to offer innovative solutions. Geographically, North America, particularly the United States, is anticipated to remain a leading market due to extensive shale gas exploration. However, the Asia Pacific region, driven by China and India's growing energy demands and increasing focus on environmental compliance, is expected to exhibit the fastest growth rate. Restraints, such as high initial investment costs for advanced treatment infrastructure and the technical complexities associated with treating highly contaminated fracking wastewater, are being progressively addressed through innovation and economies of scale.
Fracking Water Treatment Industry Company Market Share
Unlocking the Potential: A Comprehensive Report on the Fracking Water Treatment Industry (2019–2033)
This in-depth report provides an unparalleled analysis of the global Fracking Water Treatment Industry, meticulously examining its market dynamics, innovative technologies, and future trajectory from 2019 to 2033. Delve into the critical trends shaping this vital sector, from the adoption of advanced purification techniques to the evolving regulatory landscape. With a base year of 2025 and a forecast period extending to 2033, this report equips industry stakeholders with actionable insights, identifying key growth drivers, emerging opportunities, and strategic imperatives. Discover how innovations in treatment and recycling, coupled with the increasing demand for deep well injection solutions, are redefining the operational efficiency and environmental sustainability of hydraulic fracturing. This report is an indispensable resource for investors, technology providers, regulatory bodies, and energy companies seeking to navigate and capitalize on the dynamic Fracking Water Treatment Industry.
Fracking Water Treatment Industry Market Dynamics & Concentration
The Fracking Water Treatment Industry is characterized by a moderate to high level of market concentration, driven by significant capital investment requirements and the need for specialized technological expertise. Key innovation drivers include the constant pursuit of cost-effective and environmentally sound water management solutions, propelled by stringent regulatory frameworks aimed at minimizing the environmental footprint of hydraulic fracturing operations. The increasing scarcity of freshwater resources and growing public awareness are fostering a shift towards water recycling and reuse applications. Product substitutes, while present in the form of less efficient or conventional treatment methods, are gradually being outpaced by advanced technologies. End-user trends highlight a strong preference for integrated solutions that offer comprehensive water management from capture to disposal or recycling. Mergers and acquisitions (M&A) activities are expected to remain a significant feature of the market, with companies seeking to consolidate market share, acquire innovative technologies, and expand their geographical reach. For instance, the estimated M&A deal count in the historical period (2019-2024) is approximately 25 deals, indicating a dynamic consolidation landscape. Leading players are actively engaging in strategic alliances to co-develop next-generation treatment technologies.
Fracking Water Treatment Industry Industry Trends & Analysis
The Fracking Water Treatment Industry is experiencing robust growth, fueled by several interconnected trends. The escalating demand for oil and gas, coupled with increasingly stringent environmental regulations, necessitates efficient and sustainable water management practices in hydraulic fracturing. This has led to a surge in the adoption of advanced treatment and recycling technologies, aiming to reduce freshwater consumption and minimize the environmental impact of wastewater disposal. Technological disruptions are at the forefront, with significant investments in research and development leading to the emergence of innovative solutions such as advanced membrane filtration, evaporation technologies, and electrochemical treatments. These advancements offer higher purification rates, lower energy consumption, and reduced operational costs, thereby enhancing the economic viability of fracking operations. Consumer preferences are increasingly leaning towards solutions that offer a closed-loop system, minimizing the need for deep well injection and promoting water reuse within the fracking process. The competitive dynamics of the market are characterized by intense innovation, strategic partnerships, and a focus on cost optimization. Companies are vying to develop proprietary technologies that offer a competitive edge in terms of efficiency, sustainability, and cost-effectiveness. The market penetration of advanced recycling technologies is estimated to have grown by approximately 15% in the historical period. The projected Compound Annual Growth Rate (CAGR) for the Fracking Water Treatment Industry from 2025 to 2033 is approximately 7.8%, indicating a sustained period of expansion driven by both technological innovation and regulatory mandates.
Leading Markets & Segments in Fracking Water Treatment Industry
The Fracking Water Treatment Industry is experiencing significant regional variations in its growth and adoption patterns. North America, particularly the United States, remains the dominant region due to the extensive presence of shale gas reserves and the mature nature of the hydraulic fracturing industry. Within this region, the Treatment & Recycle segment is leading the market, driven by a confluence of economic policies, robust infrastructure, and escalating environmental concerns.
- Dominance of Treatment & Recycle Segment: This segment's leadership is attributed to several key factors:
- Economic Policies: Government incentives and tax credits aimed at promoting water conservation and sustainable practices in the energy sector are significantly boosting the adoption of treatment and recycling technologies.
- Infrastructure Development: The availability of established infrastructure for water treatment and recycling facilities, coupled with ongoing investments in enhancing this infrastructure, supports the widespread deployment of these solutions.
- Environmental Regulations: Increasingly stringent regulations on wastewater disposal, including limits on the discharge of produced water into surface bodies and restrictions on deep well injection, are compelling operators to invest heavily in treatment and recycling to meet compliance requirements.
- Water Scarcity Concerns: In many arid and semi-arid regions where fracking operations are prevalent, freshwater scarcity is a critical issue. Treatment and recycling offer a sustainable solution by reducing the demand for virgin water resources.
- Cost Optimization: Over time, the operational costs associated with recycling water for fracking have become more competitive compared to sourcing and transporting fresh water, making it an economically attractive option for many companies.
While Deep Well Injection remains a viable disposal method in certain regions, the trend is clearly shifting towards more sustainable alternatives like Treatment & Recycle, which not only addresses regulatory pressures but also offers long-term economic and environmental benefits. The market share of the Treatment & Recycle segment is projected to reach approximately 65% by 2025, underscoring its growing importance.
Fracking Water Treatment Industry Product Developments
Product development in the Fracking Water Treatment Industry is laser-focused on enhancing efficiency, reducing costs, and improving environmental sustainability. Innovations are centered around advanced membrane technologies, such as reverse osmosis and nanofiltration, offering superior water purification capabilities with higher recovery rates. Mobile and modular treatment units are gaining traction, providing flexibility and on-site solutions for diverse operational needs. Furthermore, the integration of smart sensors and data analytics is enabling real-time monitoring and optimization of treatment processes, leading to reduced operational downtime and improved water quality. Competitive advantages are being forged through the development of proprietary treatment chemicals, energy-efficient evaporation systems, and integrated recycling solutions that minimize the volume of waste requiring disposal.
Key Drivers of Fracking Water Treatment Industry Growth
The Fracking Water Treatment Industry's growth is propelled by a multifaceted set of drivers. Technological advancements in membrane filtration, evaporation, and advanced oxidation processes are enabling more efficient and cost-effective water treatment. Economic factors, such as the increasing cost of freshwater sourcing and disposal, alongside government incentives for water recycling, are making sustainable water management more attractive. Regulatory frameworks are playing a crucial role, with governments worldwide implementing stricter regulations on wastewater discharge and promoting water conservation in the oil and gas sector. The growing adoption of automation and digitalization is enhancing operational efficiency and reducing labor costs. Furthermore, the increasing focus on Environmental, Social, and Governance (ESG) initiatives by energy companies is driving investment in sustainable water management solutions.
Challenges in the Fracking Water Treatment Industry Market
Despite its growth potential, the Fracking Water Treatment Industry faces several significant challenges. Regulatory hurdles, including evolving and sometimes inconsistent regulations across different jurisdictions, can create uncertainty and increase compliance costs. High initial capital investment for advanced treatment systems can be a barrier for smaller operators. Supply chain complexities related to specialized equipment and chemicals, particularly in remote operational areas, can lead to delays and increased costs. Public perception and environmental activism can also exert pressure on companies to adopt more sustainable practices, sometimes leading to operational disruptions. Furthermore, the competitiveness of conventional disposal methods, such as deep well injection, in regions with less stringent regulations, continues to pose a challenge to the widespread adoption of advanced treatment and recycling.
Emerging Opportunities in Fracking Water Treatment Industry
The Fracking Water Treatment Industry is ripe with emerging opportunities, primarily driven by ongoing technological breakthroughs and a growing emphasis on circular economy principles. Strategic partnerships between technology providers, energy companies, and research institutions are fostering the co-development of highly innovative and integrated water management solutions. The increasing demand for mobile and modular treatment units offers significant market expansion potential, catering to the dynamic nature of fracking operations. Furthermore, the development of advanced materials and catalysts for enhanced water purification and contaminant removal presents a lucrative avenue for innovation. The global push towards decarbonization and sustainability is creating a favorable environment for solutions that not only treat fracking water but also contribute to overall water resource management and conservation efforts.
Leading Players in the Fracking Water Treatment Industry Sector
- Filtra Systems
- Aquatech International LLC
- Ecologix Environmental Systems LLC
- DuPont
- Oasys Water
- Halliburton
- Schlumberger Limited
- Agua Dulce Technologies LLC
- Veolia Water Technologies
Key Milestones in Fracking Water Treatment Industry Industry
- 2019-2024: Increased partnerships between industry players (e.g., Halliburton and Schlumberger) to develop innovative technologies, leading to an estimated 15 new collaborative R&D projects.
- 2020: Significant government funding initiatives launched in North America and Europe for research and development of sustainable water treatment solutions, totaling over $500 Million in grant allocations.
- 2021: Growing focus on membrane technologies, with several key companies (e.g., DuPont, Veolia) launching new, high-efficiency membrane modules for produced water treatment, resulting in a projected 10% increase in treatment efficiency.
- 2022: Widespread adoption of automation and digitalization across major fracking operations, enhancing efficiency and reducing costs by an estimated 8-12% in treated water volumes.
- 2023: Emergence of advanced evaporation technologies (e.g., from Oasys Water) offering significantly lower energy consumption for produced water treatment, capturing an estimated 5% market share in this niche.
- 2024: Several M&A activities as larger players acquire smaller, innovative technology companies to strengthen their water treatment portfolios, with over 5 significant acquisitions recorded.
Strategic Outlook for Fracking Water Treatment Industry Market
The strategic outlook for the Fracking Water Treatment Industry remains exceptionally positive, driven by the imperative for sustainable energy production and responsible water management. Future growth will be accelerated by the continued integration of advanced digital technologies, enabling real-time monitoring, predictive maintenance, and optimized treatment processes, leading to substantial cost savings. The ongoing development of novel materials and processes will further enhance the efficiency and cost-effectiveness of water recycling, making it the preferred solution for a larger portion of the industry. Strategic partnerships and collaborations will be crucial for accelerating innovation and market penetration. The increasing global focus on ESG compliance will continue to incentivize investments in robust water treatment infrastructure, positioning the Fracking Water Treatment Industry as a critical enabler of sustainable resource extraction.
Fracking Water Treatment Industry Segmentation
-
1. Application
- 1.1. Treatment & Recycle
- 1.2. Deep well Injection
Fracking Water Treatment Industry Segmentation By Geography
-
1. Asia Pacific
- 1.1. China
- 1.2. India
- 1.3. Japan
- 1.4. South Korea
- 1.5. Rest of Asia Pacific
-
2. North America
- 2.1. United States
- 2.2. Canada
- 2.3. Mexico
-
3. Europe
- 3.1. Germany
- 3.2. United Kingdom
- 3.3. France
- 3.4. Italy
- 3.5. Rest of Europe
-
4. South America
- 4.1. Brazil
- 4.2. Argentina
- 4.3. Rest of South America
-
5. Middle East and Africa
- 5.1. Saudi Arabia
- 5.2. South Africa
- 5.3. Rest of Middle East and Africa
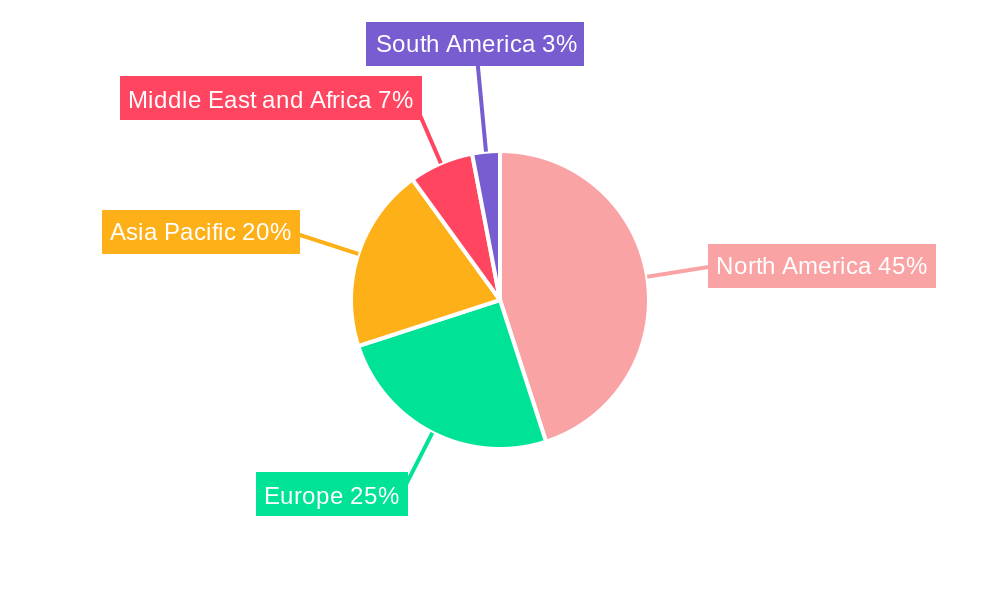
Fracking Water Treatment Industry Regional Market Share
Geographic Coverage of Fracking Water Treatment Industry
Fracking Water Treatment Industry REPORT HIGHLIGHTS
| Aspects | Details |
|---|---|
| Study Period | 2020-2034 |
| Base Year | 2025 |
| Estimated Year | 2026 |
| Forecast Period | 2026-2034 |
| Historical Period | 2020-2025 |
| Growth Rate | CAGR of > 3.00% from 2020-2034 |
| Segmentation |
|
Table of Contents
- 1. Introduction
- 1.1. Research Scope
- 1.2. Market Segmentation
- 1.3. Research Objective
- 1.4. Definitions and Assumptions
- 2. Executive Summary
- 2.1. Market Snapshot
- 3. Market Dynamics
- 3.1. Market Drivers
- 3.2. Market Restrains
- 3.3. Market Trends
- 3.4. Market Opportunities
- 4. Market Factor Analysis
- 4.1. Porters Five Forces
- 4.1.1. Bargaining Power of Suppliers
- 4.1.2. Bargaining Power of Buyers
- 4.1.3. Threat of New Entrants
- 4.1.4. Threat of Substitutes
- 4.1.5. Competitive Rivalry
- 4.2. PESTEL analysis
- 4.3. BCG Analysis
- 4.3.1. Stars (High Growth, High Market Share)
- 4.3.2. Cash Cows (Low Growth, High Market Share)
- 4.3.3. Question Mark (High Growth, Low Market Share)
- 4.3.4. Dogs (Low Growth, Low Market Share)
- 4.4. Ansoff Matrix Analysis
- 4.5. Supply Chain Analysis
- 4.6. Regulatory Landscape
- 4.7. Current Market Potential and Opportunity Assessment (TAM–SAM–SOM Framework)
- 4.8. MDP Analyst Note
- 4.1. Porters Five Forces
- 5. Market Analysis, Insights and Forecast 2021-2033
- 5.1. Market Analysis, Insights and Forecast - by Application
- 5.1.1. Treatment & Recycle
- 5.1.2. Deep well Injection
- 5.2. Market Analysis, Insights and Forecast - by Region
- 5.2.1. Asia Pacific
- 5.2.2. North America
- 5.2.3. Europe
- 5.2.4. South America
- 5.2.5. Middle East and Africa
- 5.1. Market Analysis, Insights and Forecast - by Application
- 6. Global Fracking Water Treatment Industry Analysis, Insights and Forecast, 2021-2033
- 6.1. Market Analysis, Insights and Forecast - by Application
- 6.1.1. Treatment & Recycle
- 6.1.2. Deep well Injection
- 6.1. Market Analysis, Insights and Forecast - by Application
- 7. Asia Pacific Fracking Water Treatment Industry Analysis, Insights and Forecast, 2020-2032
- 7.1. Market Analysis, Insights and Forecast - by Application
- 7.1.1. Treatment & Recycle
- 7.1.2. Deep well Injection
- 7.1. Market Analysis, Insights and Forecast - by Application
- 8. North America Fracking Water Treatment Industry Analysis, Insights and Forecast, 2020-2032
- 8.1. Market Analysis, Insights and Forecast - by Application
- 8.1.1. Treatment & Recycle
- 8.1.2. Deep well Injection
- 8.1. Market Analysis, Insights and Forecast - by Application
- 9. Europe Fracking Water Treatment Industry Analysis, Insights and Forecast, 2020-2032
- 9.1. Market Analysis, Insights and Forecast - by Application
- 9.1.1. Treatment & Recycle
- 9.1.2. Deep well Injection
- 9.1. Market Analysis, Insights and Forecast - by Application
- 10. South America Fracking Water Treatment Industry Analysis, Insights and Forecast, 2020-2032
- 10.1. Market Analysis, Insights and Forecast - by Application
- 10.1.1. Treatment & Recycle
- 10.1.2. Deep well Injection
- 10.1. Market Analysis, Insights and Forecast - by Application
- 11. Middle East and Africa Fracking Water Treatment Industry Analysis, Insights and Forecast, 2020-2032
- 11.1. Market Analysis, Insights and Forecast - by Application
- 11.1.1. Treatment & Recycle
- 11.1.2. Deep well Injection
- 11.1. Market Analysis, Insights and Forecast - by Application
- 12. Competitive Analysis
- 12.1. Company Profiles
- 12.1.1 Filtra Systems
- 12.1.1.1. Company Overview
- 12.1.1.2. Products
- 12.1.1.3. Company Financials
- 12.1.1.4. SWOT Analysis
- 12.1.2 Aquatech International LLC
- 12.1.2.1. Company Overview
- 12.1.2.2. Products
- 12.1.2.3. Company Financials
- 12.1.2.4. SWOT Analysis
- 12.1.3 Ecologix Environmental Systems LLC
- 12.1.3.1. Company Overview
- 12.1.3.2. Products
- 12.1.3.3. Company Financials
- 12.1.3.4. SWOT Analysis
- 12.1.4 DuPont
- 12.1.4.1. Company Overview
- 12.1.4.2. Products
- 12.1.4.3. Company Financials
- 12.1.4.4. SWOT Analysis
- 12.1.5 Oasys Water
- 12.1.5.1. Company Overview
- 12.1.5.2. Products
- 12.1.5.3. Company Financials
- 12.1.5.4. SWOT Analysis
- 12.1.6 Halliburton
- 12.1.6.1. Company Overview
- 12.1.6.2. Products
- 12.1.6.3. Company Financials
- 12.1.6.4. SWOT Analysis
- 12.1.7 Schlumberger Limited
- 12.1.7.1. Company Overview
- 12.1.7.2. Products
- 12.1.7.3. Company Financials
- 12.1.7.4. SWOT Analysis
- 12.1.8 Agua Dulce Technologies LLC
- 12.1.8.1. Company Overview
- 12.1.8.2. Products
- 12.1.8.3. Company Financials
- 12.1.8.4. SWOT Analysis
- 12.1.9 Veolia Water Technologies*List Not Exhaustive
- 12.1.9.1. Company Overview
- 12.1.9.2. Products
- 12.1.9.3. Company Financials
- 12.1.9.4. SWOT Analysis
- 12.1.10 Filtra Systems
- 12.1.10.1. Company Overview
- 12.1.10.2. Products
- 12.1.10.3. Company Financials
- 12.1.10.4. SWOT Analysis
- 12.1.1 Filtra Systems
- 12.2. Market Entropy
- 12.2.1 Company's Key Areas Served
- 12.2.2 Recent Developments
- 12.3. Company Market Share Analysis 2025
- 12.3.1 Top 5 Companies Market Share Analysis
- 12.3.2 Top 3 Companies Market Share Analysis
- 12.4. List of Potential Customers
- 13. Research Methodology
List of Figures
- Figure 1: Global Fracking Water Treatment Industry Revenue Breakdown (Million, %) by Region 2025 & 2033
- Figure 2: Global Fracking Water Treatment Industry Volume Breakdown (liter , %) by Region 2025 & 2033
- Figure 3: Asia Pacific Fracking Water Treatment Industry Revenue (Million), by Application 2025 & 2033
- Figure 4: Asia Pacific Fracking Water Treatment Industry Volume (liter ), by Application 2025 & 2033
- Figure 5: Asia Pacific Fracking Water Treatment Industry Revenue Share (%), by Application 2025 & 2033
- Figure 6: Asia Pacific Fracking Water Treatment Industry Volume Share (%), by Application 2025 & 2033
- Figure 7: Asia Pacific Fracking Water Treatment Industry Revenue (Million), by Country 2025 & 2033
- Figure 8: Asia Pacific Fracking Water Treatment Industry Volume (liter ), by Country 2025 & 2033
- Figure 9: Asia Pacific Fracking Water Treatment Industry Revenue Share (%), by Country 2025 & 2033
- Figure 10: Asia Pacific Fracking Water Treatment Industry Volume Share (%), by Country 2025 & 2033
- Figure 11: North America Fracking Water Treatment Industry Revenue (Million), by Application 2025 & 2033
- Figure 12: North America Fracking Water Treatment Industry Volume (liter ), by Application 2025 & 2033
- Figure 13: North America Fracking Water Treatment Industry Revenue Share (%), by Application 2025 & 2033
- Figure 14: North America Fracking Water Treatment Industry Volume Share (%), by Application 2025 & 2033
- Figure 15: North America Fracking Water Treatment Industry Revenue (Million), by Country 2025 & 2033
- Figure 16: North America Fracking Water Treatment Industry Volume (liter ), by Country 2025 & 2033
- Figure 17: North America Fracking Water Treatment Industry Revenue Share (%), by Country 2025 & 2033
- Figure 18: North America Fracking Water Treatment Industry Volume Share (%), by Country 2025 & 2033
- Figure 19: Europe Fracking Water Treatment Industry Revenue (Million), by Application 2025 & 2033
- Figure 20: Europe Fracking Water Treatment Industry Volume (liter ), by Application 2025 & 2033
- Figure 21: Europe Fracking Water Treatment Industry Revenue Share (%), by Application 2025 & 2033
- Figure 22: Europe Fracking Water Treatment Industry Volume Share (%), by Application 2025 & 2033
- Figure 23: Europe Fracking Water Treatment Industry Revenue (Million), by Country 2025 & 2033
- Figure 24: Europe Fracking Water Treatment Industry Volume (liter ), by Country 2025 & 2033
- Figure 25: Europe Fracking Water Treatment Industry Revenue Share (%), by Country 2025 & 2033
- Figure 26: Europe Fracking Water Treatment Industry Volume Share (%), by Country 2025 & 2033
- Figure 27: South America Fracking Water Treatment Industry Revenue (Million), by Application 2025 & 2033
- Figure 28: South America Fracking Water Treatment Industry Volume (liter ), by Application 2025 & 2033
- Figure 29: South America Fracking Water Treatment Industry Revenue Share (%), by Application 2025 & 2033
- Figure 30: South America Fracking Water Treatment Industry Volume Share (%), by Application 2025 & 2033
- Figure 31: South America Fracking Water Treatment Industry Revenue (Million), by Country 2025 & 2033
- Figure 32: South America Fracking Water Treatment Industry Volume (liter ), by Country 2025 & 2033
- Figure 33: South America Fracking Water Treatment Industry Revenue Share (%), by Country 2025 & 2033
- Figure 34: South America Fracking Water Treatment Industry Volume Share (%), by Country 2025 & 2033
- Figure 35: Middle East and Africa Fracking Water Treatment Industry Revenue (Million), by Application 2025 & 2033
- Figure 36: Middle East and Africa Fracking Water Treatment Industry Volume (liter ), by Application 2025 & 2033
- Figure 37: Middle East and Africa Fracking Water Treatment Industry Revenue Share (%), by Application 2025 & 2033
- Figure 38: Middle East and Africa Fracking Water Treatment Industry Volume Share (%), by Application 2025 & 2033
- Figure 39: Middle East and Africa Fracking Water Treatment Industry Revenue (Million), by Country 2025 & 2033
- Figure 40: Middle East and Africa Fracking Water Treatment Industry Volume (liter ), by Country 2025 & 2033
- Figure 41: Middle East and Africa Fracking Water Treatment Industry Revenue Share (%), by Country 2025 & 2033
- Figure 42: Middle East and Africa Fracking Water Treatment Industry Volume Share (%), by Country 2025 & 2033
List of Tables
- Table 1: Global Fracking Water Treatment Industry Revenue Million Forecast, by Application 2020 & 2033
- Table 2: Global Fracking Water Treatment Industry Volume liter Forecast, by Application 2020 & 2033
- Table 3: Global Fracking Water Treatment Industry Revenue Million Forecast, by Region 2020 & 2033
- Table 4: Global Fracking Water Treatment Industry Volume liter Forecast, by Region 2020 & 2033
- Table 5: Global Fracking Water Treatment Industry Revenue Million Forecast, by Application 2020 & 2033
- Table 6: Global Fracking Water Treatment Industry Volume liter Forecast, by Application 2020 & 2033
- Table 7: Global Fracking Water Treatment Industry Revenue Million Forecast, by Country 2020 & 2033
- Table 8: Global Fracking Water Treatment Industry Volume liter Forecast, by Country 2020 & 2033
- Table 9: China Fracking Water Treatment Industry Revenue (Million) Forecast, by Application 2020 & 2033
- Table 10: China Fracking Water Treatment Industry Volume (liter ) Forecast, by Application 2020 & 2033
- Table 11: India Fracking Water Treatment Industry Revenue (Million) Forecast, by Application 2020 & 2033
- Table 12: India Fracking Water Treatment Industry Volume (liter ) Forecast, by Application 2020 & 2033
- Table 13: Japan Fracking Water Treatment Industry Revenue (Million) Forecast, by Application 2020 & 2033
- Table 14: Japan Fracking Water Treatment Industry Volume (liter ) Forecast, by Application 2020 & 2033
- Table 15: South Korea Fracking Water Treatment Industry Revenue (Million) Forecast, by Application 2020 & 2033
- Table 16: South Korea Fracking Water Treatment Industry Volume (liter ) Forecast, by Application 2020 & 2033
- Table 17: Rest of Asia Pacific Fracking Water Treatment Industry Revenue (Million) Forecast, by Application 2020 & 2033
- Table 18: Rest of Asia Pacific Fracking Water Treatment Industry Volume (liter ) Forecast, by Application 2020 & 2033
- Table 19: Global Fracking Water Treatment Industry Revenue Million Forecast, by Application 2020 & 2033
- Table 20: Global Fracking Water Treatment Industry Volume liter Forecast, by Application 2020 & 2033
- Table 21: Global Fracking Water Treatment Industry Revenue Million Forecast, by Country 2020 & 2033
- Table 22: Global Fracking Water Treatment Industry Volume liter Forecast, by Country 2020 & 2033
- Table 23: United States Fracking Water Treatment Industry Revenue (Million) Forecast, by Application 2020 & 2033
- Table 24: United States Fracking Water Treatment Industry Volume (liter ) Forecast, by Application 2020 & 2033
- Table 25: Canada Fracking Water Treatment Industry Revenue (Million) Forecast, by Application 2020 & 2033
- Table 26: Canada Fracking Water Treatment Industry Volume (liter ) Forecast, by Application 2020 & 2033
- Table 27: Mexico Fracking Water Treatment Industry Revenue (Million) Forecast, by Application 2020 & 2033
- Table 28: Mexico Fracking Water Treatment Industry Volume (liter ) Forecast, by Application 2020 & 2033
- Table 29: Global Fracking Water Treatment Industry Revenue Million Forecast, by Application 2020 & 2033
- Table 30: Global Fracking Water Treatment Industry Volume liter Forecast, by Application 2020 & 2033
- Table 31: Global Fracking Water Treatment Industry Revenue Million Forecast, by Country 2020 & 2033
- Table 32: Global Fracking Water Treatment Industry Volume liter Forecast, by Country 2020 & 2033
- Table 33: Germany Fracking Water Treatment Industry Revenue (Million) Forecast, by Application 2020 & 2033
- Table 34: Germany Fracking Water Treatment Industry Volume (liter ) Forecast, by Application 2020 & 2033
- Table 35: United Kingdom Fracking Water Treatment Industry Revenue (Million) Forecast, by Application 2020 & 2033
- Table 36: United Kingdom Fracking Water Treatment Industry Volume (liter ) Forecast, by Application 2020 & 2033
- Table 37: France Fracking Water Treatment Industry Revenue (Million) Forecast, by Application 2020 & 2033
- Table 38: France Fracking Water Treatment Industry Volume (liter ) Forecast, by Application 2020 & 2033
- Table 39: Italy Fracking Water Treatment Industry Revenue (Million) Forecast, by Application 2020 & 2033
- Table 40: Italy Fracking Water Treatment Industry Volume (liter ) Forecast, by Application 2020 & 2033
- Table 41: Rest of Europe Fracking Water Treatment Industry Revenue (Million) Forecast, by Application 2020 & 2033
- Table 42: Rest of Europe Fracking Water Treatment Industry Volume (liter ) Forecast, by Application 2020 & 2033
- Table 43: Global Fracking Water Treatment Industry Revenue Million Forecast, by Application 2020 & 2033
- Table 44: Global Fracking Water Treatment Industry Volume liter Forecast, by Application 2020 & 2033
- Table 45: Global Fracking Water Treatment Industry Revenue Million Forecast, by Country 2020 & 2033
- Table 46: Global Fracking Water Treatment Industry Volume liter Forecast, by Country 2020 & 2033
- Table 47: Brazil Fracking Water Treatment Industry Revenue (Million) Forecast, by Application 2020 & 2033
- Table 48: Brazil Fracking Water Treatment Industry Volume (liter ) Forecast, by Application 2020 & 2033
- Table 49: Argentina Fracking Water Treatment Industry Revenue (Million) Forecast, by Application 2020 & 2033
- Table 50: Argentina Fracking Water Treatment Industry Volume (liter ) Forecast, by Application 2020 & 2033
- Table 51: Rest of South America Fracking Water Treatment Industry Revenue (Million) Forecast, by Application 2020 & 2033
- Table 52: Rest of South America Fracking Water Treatment Industry Volume (liter ) Forecast, by Application 2020 & 2033
- Table 53: Global Fracking Water Treatment Industry Revenue Million Forecast, by Application 2020 & 2033
- Table 54: Global Fracking Water Treatment Industry Volume liter Forecast, by Application 2020 & 2033
- Table 55: Global Fracking Water Treatment Industry Revenue Million Forecast, by Country 2020 & 2033
- Table 56: Global Fracking Water Treatment Industry Volume liter Forecast, by Country 2020 & 2033
- Table 57: Saudi Arabia Fracking Water Treatment Industry Revenue (Million) Forecast, by Application 2020 & 2033
- Table 58: Saudi Arabia Fracking Water Treatment Industry Volume (liter ) Forecast, by Application 2020 & 2033
- Table 59: South Africa Fracking Water Treatment Industry Revenue (Million) Forecast, by Application 2020 & 2033
- Table 60: South Africa Fracking Water Treatment Industry Volume (liter ) Forecast, by Application 2020 & 2033
- Table 61: Rest of Middle East and Africa Fracking Water Treatment Industry Revenue (Million) Forecast, by Application 2020 & 2033
- Table 62: Rest of Middle East and Africa Fracking Water Treatment Industry Volume (liter ) Forecast, by Application 2020 & 2033
Frequently Asked Questions
1. What is the projected Compound Annual Growth Rate (CAGR) of the Fracking Water Treatment Industry?
The projected CAGR is approximately > 3.00%.
2. Which companies are prominent players in the Fracking Water Treatment Industry?
Key companies in the market include Filtra Systems, Aquatech International LLC, Ecologix Environmental Systems LLC, DuPont, Oasys Water, Halliburton, Schlumberger Limited, Agua Dulce Technologies LLC, Veolia Water Technologies*List Not Exhaustive, Filtra Systems.
3. What are the main segments of the Fracking Water Treatment Industry?
The market segments include Application.
4. Can you provide details about the market size?
The market size is estimated to be USD 5700 Million as of 2022.
5. What are some drivers contributing to market growth?
; High Demand from Treatment & Recycle Segment; Stringent Government Regulations.
6. What are the notable trends driving market growth?
High Demand from Treatment & Recycle Segment.
7. Are there any restraints impacting market growth?
; Outbreak of COVID-19; Other Restraints.
8. Can you provide examples of recent developments in the market?
Partnerships between industry players to develop innovative technologies
9. What pricing options are available for accessing the report?
Pricing options include single-user, multi-user, and enterprise licenses priced at USD 4750, USD 5250, and USD 8750 respectively.
10. Is the market size provided in terms of value or volume?
The market size is provided in terms of value, measured in Million and volume, measured in liter .
11. Are there any specific market keywords associated with the report?
Yes, the market keyword associated with the report is "Fracking Water Treatment Industry," which aids in identifying and referencing the specific market segment covered.
12. How do I determine which pricing option suits my needs best?
The pricing options vary based on user requirements and access needs. Individual users may opt for single-user licenses, while businesses requiring broader access may choose multi-user or enterprise licenses for cost-effective access to the report.
13. Are there any additional resources or data provided in the Fracking Water Treatment Industry report?
While the report offers comprehensive insights, it's advisable to review the specific contents or supplementary materials provided to ascertain if additional resources or data are available.
14. How can I stay updated on further developments or reports in the Fracking Water Treatment Industry?
To stay informed about further developments, trends, and reports in the Fracking Water Treatment Industry, consider subscribing to industry newsletters, following relevant companies and organizations, or regularly checking reputable industry news sources and publications.
Methodology
Step 1 - Identification of Relevant Samples Size from Population Database


Step 2 - Approaches for Defining Global Market Size (Value, Volume* & Price*)

Note*: In applicable scenarios
Step 3 - Data Sources
Primary Research
- Web Analytics
- Survey Reports
- Research Institute
- Latest Research Reports
- Opinion Leaders
Secondary Research
- Annual Reports
- White Paper
- Latest Press Release
- Industry Association
- Paid Database
- Investor Presentations

Step 4 - Data Triangulation
Involves using different sources of information in order to increase the validity of a study
These sources are likely to be stakeholders in a program - participants, other researchers, program staff, other community members, and so on.
Then we put all data in single framework & apply various statistical tools to find out the dynamic on the market.
During the analysis stage, feedback from the stakeholder groups would be compared to determine areas of agreement as well as areas of divergence