

Key Insights
The global ferroalloys market, encompassing crucial components in steel production like ferrosilicon, ferromanganese, and silicomanganese, experienced robust growth between 2019 and 2024. Driven by burgeoning construction, automotive, and infrastructure sectors, this period witnessed a steady expansion. While precise market size figures for 2019-2024 aren't provided, industry reports indicate a significant market value exceeding $50 billion USD in 2024. The growth trajectory, based on a projected Compound Annual Growth Rate (CAGR) for 2025-2033, suggests continued expansion, fueled by increasing global steel production and the rising demand for high-strength, specialized steels in various applications. Factors such as government investments in infrastructure projects, particularly in developing economies, further contribute to this positive outlook. However, fluctuating raw material prices, environmental regulations concerning emissions, and potential supply chain disruptions pose challenges to sustained growth.
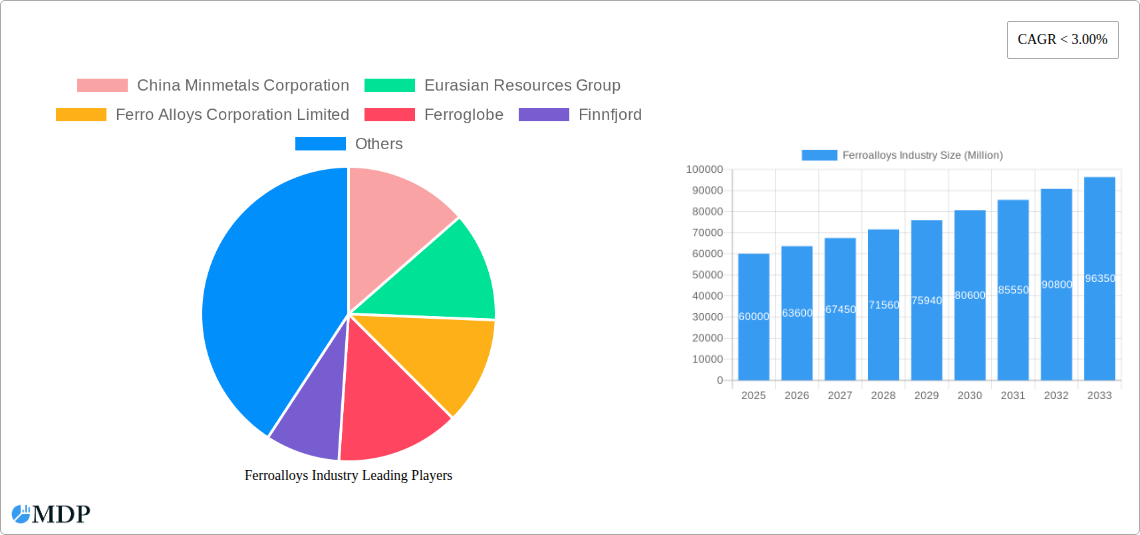
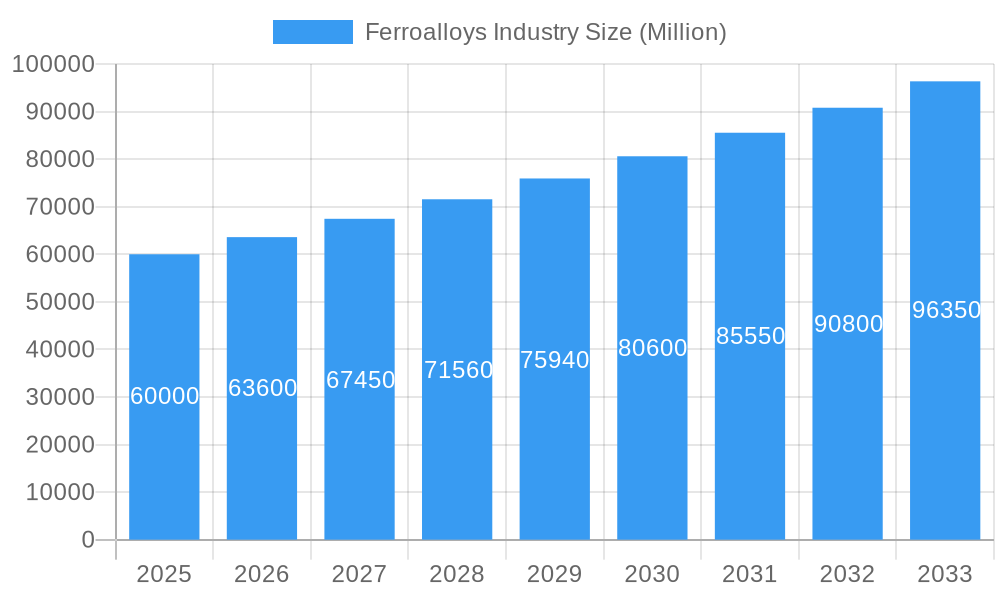
Ferroalloys Industry Market Size (In Billion)
The forecast period from 2025 to 2033 anticipates a sustained, albeit potentially moderated, growth rate. The market is expected to surpass $70 billion USD by 2033. This projection incorporates considerations of evolving technological advancements in steel manufacturing, the ongoing transition towards sustainable steel production practices, and potential shifts in global economic conditions. Strategic investments in R&D to enhance the efficiency and sustainability of ferroalloy production will play a crucial role in shaping the market's future trajectory. Specific regional variations will influence overall growth, with regions experiencing rapid industrialization anticipated to exhibit stronger market expansion compared to mature markets.
Ferroalloys Industry Company Market Share
This comprehensive report provides an in-depth analysis of the global ferroalloys industry, offering invaluable insights for stakeholders seeking to navigate this dynamic market. With a study period spanning 2019-2033, a base year of 2025, and a forecast period of 2025-2033, this report delivers actionable intelligence for strategic decision-making. The report covers key players like China Minmetals Corporation, Eurasian Resources Group, Ferro Alloys Corporation Limited, Ferroglobe, Finnfjord, Mechel, OM Holdings Ltd, Shanghai Shenjia Ferroalloys Co Ltd, SKP Group, and Tashi Group (list not exhaustive).
Ferroalloys Industry Market Dynamics & Concentration
The ferroalloys market exhibits a moderately concentrated landscape, with a few major players holding significant market share. The exact market share distribution varies across different ferroalloy types, but the top 10 companies are estimated to hold approximately xx% of the global market in 2025. This concentration is driven by economies of scale in production and significant capital investment required for new capacity. Innovation in production processes, particularly focusing on energy efficiency and reduced emissions, is a key driver. Stringent environmental regulations globally are reshaping the competitive landscape, favoring companies with advanced pollution control technologies. Product substitution is relatively limited due to the specialized properties of ferroalloys, but ongoing research in alternative materials warrants monitoring. End-user demand, primarily from the steel and stainless steel industries, significantly impacts market growth. M&A activity in the sector has been moderate in recent years, with approximately xx deals recorded between 2019 and 2024, mostly involving smaller players seeking consolidation or access to new technologies.
- Market Concentration: Estimated xx% held by top 10 players in 2025.
- Innovation Drivers: Energy efficiency, emission reduction technologies, and advanced material research.
- Regulatory Frameworks: Stringent environmental regulations globally influence production methods and costs.
- Product Substitutes: Limited, but alternative materials under development warrant monitoring.
- End-User Trends: Primarily driven by steel and stainless steel industries' production levels.
- M&A Activity: Approximately xx deals between 2019-2024.
Ferroalloys Industry Industry Trends & Analysis
The ferroalloys market is projected to experience a CAGR of xx% during the forecast period (2025-2033), driven by robust growth in the global steel industry and increasing demand for high-performance alloys in various applications. Technological advancements, particularly in energy-efficient smelting processes and automation, are improving production efficiency and reducing costs. Consumer preferences are shifting towards higher-quality, sustainable ferroalloys, pushing companies to adopt eco-friendly practices and transparent supply chains. The competitive landscape is characterized by intense price competition, particularly among producers in regions with abundant raw materials. Market penetration of new technologies, such as high-purity silicon metal for battery applications, is gradually increasing, creating new growth opportunities.
Leading Markets & Segments in Ferroalloys Industry
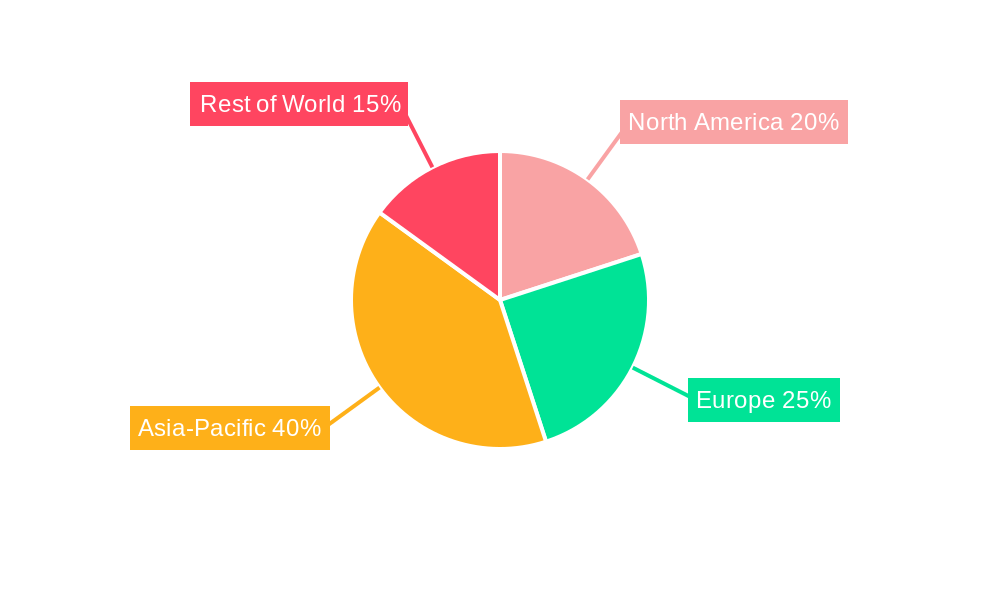
China remains the dominant player in the global ferroalloys market, holding approximately xx% of global production in 2025. This dominance is driven by several factors:
- Economic Policies: Government support for steel and related industries.
- Infrastructure: Well-established infrastructure and access to abundant raw materials.
- Large Domestic Demand: Significant consumption within the country's robust construction and manufacturing sectors.
Other significant markets include India, the United States, and countries in the European Union. While China dominates in terms of production volume, other regions show strong growth potential, especially in specific segments like high-purity ferroalloys for advanced applications. The report provides a detailed breakdown of regional and segmental market shares and growth projections.
Ferroalloys Industry Product Developments
Recent years have witnessed significant advancements in ferroalloy production, focusing on enhancing purity, improving consistency, and optimizing performance for diverse applications. The development of high-purity silicon metal, as exemplified by Ferroglobe's project, is a key highlight, opening doors to advanced applications in battery technology and solar energy. These improvements are enabling the use of ferroalloys in high-tech sectors, increasing their market appeal and enhancing competitive advantages.
Key Drivers of Ferroalloys Industry Growth
Several key factors drive the growth of the ferroalloys industry:
- Growth in Steel Production: Global steel production growth fuels demand for ferroalloys as essential alloying elements.
- Infrastructure Development: Expanding global infrastructure projects require significant quantities of steel and ferroalloys.
- Technological Advancements: Innovation in production processes leads to cost savings and improved product quality.
Challenges in the Ferroalloys Industry Market
The ferroalloys industry faces several challenges:
- Environmental Regulations: Stringent environmental regulations increase production costs and necessitate investments in pollution control technologies.
- Fluctuating Raw Material Prices: Volatility in raw material prices can impact profitability.
- Intense Competition: Intense price competition, especially from low-cost producers, puts pressure on profit margins.
Emerging Opportunities in Ferroalloys Industry
The ferroalloys industry presents significant long-term growth opportunities, driven by the increasing demand for high-purity ferroalloys in emerging sectors like renewable energy and advanced materials. Strategic partnerships and collaborations are fostering innovation and driving market expansion. Technological breakthroughs, such as improved energy efficiency and waste reduction methods, further enhance the industry's sustainability profile and market appeal.
Leading Players in the Ferroalloys Industry Sector
- China Minmetals Corporation
- Eurasian Resources Group
- Ferro Alloys Corporation Limited
- Ferroglobe
- Finnfjord
- Mechel
- OM Holdings Ltd
- Shanghai Shenjia Ferroalloys Co Ltd
- SKP Group
- Tashi Group
Key Milestones in Ferroalloys Industry Industry
- July 2022: Ferroglobe PLC achieves high-purity (up to 99.995%) silicon metal powder production for batteries and advanced technologies. This significantly expands the potential applications of silicon metal.
- June 2022: Ferroglobe PLC and REC Silicon sign a Memorandum of Understanding to establish a low-carbon U.S.-based solar supply chain, showcasing industry collaboration toward sustainability.
Strategic Outlook for Ferroalloys Industry Market
The ferroalloys market exhibits strong long-term growth potential, driven by sustained demand from the steel industry, expanding infrastructure projects, and the increasing adoption of ferroalloys in high-tech applications. Strategic investments in research and development, sustainable production practices, and strategic partnerships will be crucial for companies to capture the significant market opportunities ahead. Companies focusing on innovation and sustainability are well-positioned to achieve substantial growth in the coming years.
Ferroalloys Industry Segmentation
-
1. Application
- 1.1. Metallurgy
- 1.2. Semiconductors
- 1.3. Photovoltaic Solar Energy
- 1.4. Chemical Processing
- 1.5. Other Applications
Ferroalloys Industry Segmentation By Geography
-
1. Asia Pacific
- 1.1. China
- 1.2. India
- 1.3. Japan
- 1.4. South Korea
- 1.5. Rest of Asia Pacific
-
2. North America
- 2.1. United States
- 2.2. Canada
- 2.3. Mexico
-
3. Europe
- 3.1. Germany
- 3.2. United Kingdom
- 3.3. France
- 3.4. Italy
- 3.5. Rest of Europe
-
4. South America
- 4.1. Brazil
- 4.2. Argentina
- 4.3. Rest of South America
-
5. Middle East and Africa
- 5.1. Saudi Arabia
- 5.2. South Africa
- 5.3. Rest of Middle East and Africa
Ferroalloys Industry Regional Market Share
Geographic Coverage of Ferroalloys Industry
Ferroalloys Industry REPORT HIGHLIGHTS
| Aspects | Details |
|---|---|
| Study Period | 2020-2034 |
| Base Year | 2025 |
| Estimated Year | 2026 |
| Forecast Period | 2026-2034 |
| Historical Period | 2020-2025 |
| Growth Rate | CAGR of 16.1% from 2020-2034 |
| Segmentation |
|
Table of Contents
- 1. Introduction
- 1.1. Research Scope
- 1.2. Market Segmentation
- 1.3. Research Objective
- 1.4. Definitions and Assumptions
- 2. Executive Summary
- 2.1. Market Snapshot
- 3. Market Dynamics
- 3.1. Market Drivers
- 3.2. Market Restrains
- 3.3. Market Trends
- 3.4. Market Opportunities
- 4. Market Factor Analysis
- 4.1. Porters Five Forces
- 4.1.1. Bargaining Power of Suppliers
- 4.1.2. Bargaining Power of Buyers
- 4.1.3. Threat of New Entrants
- 4.1.4. Threat of Substitutes
- 4.1.5. Competitive Rivalry
- 4.2. PESTEL analysis
- 4.3. BCG Analysis
- 4.3.1. Stars (High Growth, High Market Share)
- 4.3.2. Cash Cows (Low Growth, High Market Share)
- 4.3.3. Question Mark (High Growth, Low Market Share)
- 4.3.4. Dogs (Low Growth, Low Market Share)
- 4.4. Ansoff Matrix Analysis
- 4.5. Supply Chain Analysis
- 4.6. Regulatory Landscape
- 4.7. Current Market Potential and Opportunity Assessment (TAM–SAM–SOM Framework)
- 4.8. MDP Analyst Note
- 4.1. Porters Five Forces
- 5. Market Analysis, Insights and Forecast 2021-2033
- 5.1. Market Analysis, Insights and Forecast - by Application
- 5.1.1. Metallurgy
- 5.1.2. Semiconductors
- 5.1.3. Photovoltaic Solar Energy
- 5.1.4. Chemical Processing
- 5.1.5. Other Applications
- 5.2. Market Analysis, Insights and Forecast - by Region
- 5.2.1. Asia Pacific
- 5.2.2. North America
- 5.2.3. Europe
- 5.2.4. South America
- 5.2.5. Middle East and Africa
- 5.1. Market Analysis, Insights and Forecast - by Application
- 6. Global Ferroalloys Industry Analysis, Insights and Forecast, 2021-2033
- 6.1. Market Analysis, Insights and Forecast - by Application
- 6.1.1. Metallurgy
- 6.1.2. Semiconductors
- 6.1.3. Photovoltaic Solar Energy
- 6.1.4. Chemical Processing
- 6.1.5. Other Applications
- 6.1. Market Analysis, Insights and Forecast - by Application
- 7. Asia Pacific Ferroalloys Industry Analysis, Insights and Forecast, 2020-2032
- 7.1. Market Analysis, Insights and Forecast - by Application
- 7.1.1. Metallurgy
- 7.1.2. Semiconductors
- 7.1.3. Photovoltaic Solar Energy
- 7.1.4. Chemical Processing
- 7.1.5. Other Applications
- 7.1. Market Analysis, Insights and Forecast - by Application
- 8. North America Ferroalloys Industry Analysis, Insights and Forecast, 2020-2032
- 8.1. Market Analysis, Insights and Forecast - by Application
- 8.1.1. Metallurgy
- 8.1.2. Semiconductors
- 8.1.3. Photovoltaic Solar Energy
- 8.1.4. Chemical Processing
- 8.1.5. Other Applications
- 8.1. Market Analysis, Insights and Forecast - by Application
- 9. Europe Ferroalloys Industry Analysis, Insights and Forecast, 2020-2032
- 9.1. Market Analysis, Insights and Forecast - by Application
- 9.1.1. Metallurgy
- 9.1.2. Semiconductors
- 9.1.3. Photovoltaic Solar Energy
- 9.1.4. Chemical Processing
- 9.1.5. Other Applications
- 9.1. Market Analysis, Insights and Forecast - by Application
- 10. South America Ferroalloys Industry Analysis, Insights and Forecast, 2020-2032
- 10.1. Market Analysis, Insights and Forecast - by Application
- 10.1.1. Metallurgy
- 10.1.2. Semiconductors
- 10.1.3. Photovoltaic Solar Energy
- 10.1.4. Chemical Processing
- 10.1.5. Other Applications
- 10.1. Market Analysis, Insights and Forecast - by Application
- 11. Middle East and Africa Ferroalloys Industry Analysis, Insights and Forecast, 2020-2032
- 11.1. Market Analysis, Insights and Forecast - by Application
- 11.1.1. Metallurgy
- 11.1.2. Semiconductors
- 11.1.3. Photovoltaic Solar Energy
- 11.1.4. Chemical Processing
- 11.1.5. Other Applications
- 11.1. Market Analysis, Insights and Forecast - by Application
- 12. Competitive Analysis
- 12.1. Company Profiles
- 12.1.1 China Minmetals Corporation
- 12.1.1.1. Company Overview
- 12.1.1.2. Products
- 12.1.1.3. Company Financials
- 12.1.1.4. SWOT Analysis
- 12.1.2 Eurasian Resources Group
- 12.1.2.1. Company Overview
- 12.1.2.2. Products
- 12.1.2.3. Company Financials
- 12.1.2.4. SWOT Analysis
- 12.1.3 Ferro Alloys Corporation Limited
- 12.1.3.1. Company Overview
- 12.1.3.2. Products
- 12.1.3.3. Company Financials
- 12.1.3.4. SWOT Analysis
- 12.1.4 Ferroglobe
- 12.1.4.1. Company Overview
- 12.1.4.2. Products
- 12.1.4.3. Company Financials
- 12.1.4.4. SWOT Analysis
- 12.1.5 Finnfjord
- 12.1.5.1. Company Overview
- 12.1.5.2. Products
- 12.1.5.3. Company Financials
- 12.1.5.4. SWOT Analysis
- 12.1.6 Mechel
- 12.1.6.1. Company Overview
- 12.1.6.2. Products
- 12.1.6.3. Company Financials
- 12.1.6.4. SWOT Analysis
- 12.1.7 OM Holdings Ltd
- 12.1.7.1. Company Overview
- 12.1.7.2. Products
- 12.1.7.3. Company Financials
- 12.1.7.4. SWOT Analysis
- 12.1.8 Shanghai Shenjia Ferroalloys Co Ltd
- 12.1.8.1. Company Overview
- 12.1.8.2. Products
- 12.1.8.3. Company Financials
- 12.1.8.4. SWOT Analysis
- 12.1.9 SKP Group
- 12.1.9.1. Company Overview
- 12.1.9.2. Products
- 12.1.9.3. Company Financials
- 12.1.9.4. SWOT Analysis
- 12.1.10 Tashi Group*List Not Exhaustive
- 12.1.10.1. Company Overview
- 12.1.10.2. Products
- 12.1.10.3. Company Financials
- 12.1.10.4. SWOT Analysis
- 12.1.1 China Minmetals Corporation
- 12.2. Market Entropy
- 12.2.1 Company's Key Areas Served
- 12.2.2 Recent Developments
- 12.3. Company Market Share Analysis 2025
- 12.3.1 Top 5 Companies Market Share Analysis
- 12.3.2 Top 3 Companies Market Share Analysis
- 12.4. List of Potential Customers
- 13. Research Methodology
List of Figures
- Figure 1: Global Ferroalloys Industry Revenue Breakdown (undefined, %) by Region 2025 & 2033
- Figure 2: Asia Pacific Ferroalloys Industry Revenue (undefined), by Application 2025 & 2033
- Figure 3: Asia Pacific Ferroalloys Industry Revenue Share (%), by Application 2025 & 2033
- Figure 4: Asia Pacific Ferroalloys Industry Revenue (undefined), by Country 2025 & 2033
- Figure 5: Asia Pacific Ferroalloys Industry Revenue Share (%), by Country 2025 & 2033
- Figure 6: North America Ferroalloys Industry Revenue (undefined), by Application 2025 & 2033
- Figure 7: North America Ferroalloys Industry Revenue Share (%), by Application 2025 & 2033
- Figure 8: North America Ferroalloys Industry Revenue (undefined), by Country 2025 & 2033
- Figure 9: North America Ferroalloys Industry Revenue Share (%), by Country 2025 & 2033
- Figure 10: Europe Ferroalloys Industry Revenue (undefined), by Application 2025 & 2033
- Figure 11: Europe Ferroalloys Industry Revenue Share (%), by Application 2025 & 2033
- Figure 12: Europe Ferroalloys Industry Revenue (undefined), by Country 2025 & 2033
- Figure 13: Europe Ferroalloys Industry Revenue Share (%), by Country 2025 & 2033
- Figure 14: South America Ferroalloys Industry Revenue (undefined), by Application 2025 & 2033
- Figure 15: South America Ferroalloys Industry Revenue Share (%), by Application 2025 & 2033
- Figure 16: South America Ferroalloys Industry Revenue (undefined), by Country 2025 & 2033
- Figure 17: South America Ferroalloys Industry Revenue Share (%), by Country 2025 & 2033
- Figure 18: Middle East and Africa Ferroalloys Industry Revenue (undefined), by Application 2025 & 2033
- Figure 19: Middle East and Africa Ferroalloys Industry Revenue Share (%), by Application 2025 & 2033
- Figure 20: Middle East and Africa Ferroalloys Industry Revenue (undefined), by Country 2025 & 2033
- Figure 21: Middle East and Africa Ferroalloys Industry Revenue Share (%), by Country 2025 & 2033
List of Tables
- Table 1: Global Ferroalloys Industry Revenue undefined Forecast, by Application 2020 & 2033
- Table 2: Global Ferroalloys Industry Revenue undefined Forecast, by Region 2020 & 2033
- Table 3: Global Ferroalloys Industry Revenue undefined Forecast, by Application 2020 & 2033
- Table 4: Global Ferroalloys Industry Revenue undefined Forecast, by Country 2020 & 2033
- Table 5: China Ferroalloys Industry Revenue (undefined) Forecast, by Application 2020 & 2033
- Table 6: India Ferroalloys Industry Revenue (undefined) Forecast, by Application 2020 & 2033
- Table 7: Japan Ferroalloys Industry Revenue (undefined) Forecast, by Application 2020 & 2033
- Table 8: South Korea Ferroalloys Industry Revenue (undefined) Forecast, by Application 2020 & 2033
- Table 9: Rest of Asia Pacific Ferroalloys Industry Revenue (undefined) Forecast, by Application 2020 & 2033
- Table 10: Global Ferroalloys Industry Revenue undefined Forecast, by Application 2020 & 2033
- Table 11: Global Ferroalloys Industry Revenue undefined Forecast, by Country 2020 & 2033
- Table 12: United States Ferroalloys Industry Revenue (undefined) Forecast, by Application 2020 & 2033
- Table 13: Canada Ferroalloys Industry Revenue (undefined) Forecast, by Application 2020 & 2033
- Table 14: Mexico Ferroalloys Industry Revenue (undefined) Forecast, by Application 2020 & 2033
- Table 15: Global Ferroalloys Industry Revenue undefined Forecast, by Application 2020 & 2033
- Table 16: Global Ferroalloys Industry Revenue undefined Forecast, by Country 2020 & 2033
- Table 17: Germany Ferroalloys Industry Revenue (undefined) Forecast, by Application 2020 & 2033
- Table 18: United Kingdom Ferroalloys Industry Revenue (undefined) Forecast, by Application 2020 & 2033
- Table 19: France Ferroalloys Industry Revenue (undefined) Forecast, by Application 2020 & 2033
- Table 20: Italy Ferroalloys Industry Revenue (undefined) Forecast, by Application 2020 & 2033
- Table 21: Rest of Europe Ferroalloys Industry Revenue (undefined) Forecast, by Application 2020 & 2033
- Table 22: Global Ferroalloys Industry Revenue undefined Forecast, by Application 2020 & 2033
- Table 23: Global Ferroalloys Industry Revenue undefined Forecast, by Country 2020 & 2033
- Table 24: Brazil Ferroalloys Industry Revenue (undefined) Forecast, by Application 2020 & 2033
- Table 25: Argentina Ferroalloys Industry Revenue (undefined) Forecast, by Application 2020 & 2033
- Table 26: Rest of South America Ferroalloys Industry Revenue (undefined) Forecast, by Application 2020 & 2033
- Table 27: Global Ferroalloys Industry Revenue undefined Forecast, by Application 2020 & 2033
- Table 28: Global Ferroalloys Industry Revenue undefined Forecast, by Country 2020 & 2033
- Table 29: Saudi Arabia Ferroalloys Industry Revenue (undefined) Forecast, by Application 2020 & 2033
- Table 30: South Africa Ferroalloys Industry Revenue (undefined) Forecast, by Application 2020 & 2033
- Table 31: Rest of Middle East and Africa Ferroalloys Industry Revenue (undefined) Forecast, by Application 2020 & 2033
Frequently Asked Questions
1. What is the projected Compound Annual Growth Rate (CAGR) of the Ferroalloys Industry?
The projected CAGR is approximately 16.1%.
2. Which companies are prominent players in the Ferroalloys Industry?
Key companies in the market include China Minmetals Corporation, Eurasian Resources Group, Ferro Alloys Corporation Limited, Ferroglobe, Finnfjord, Mechel, OM Holdings Ltd, Shanghai Shenjia Ferroalloys Co Ltd, SKP Group, Tashi Group*List Not Exhaustive.
3. What are the main segments of the Ferroalloys Industry?
The market segments include Application.
4. Can you provide details about the market size?
The market size is estimated to be USD XXX N/A as of 2022.
5. What are some drivers contributing to market growth?
Increasing Applications for Corrosion Resistance; Growing Demand from Steel Production Industries.
6. What are the notable trends driving market growth?
Growing Demand from Metallurgy Industry.
7. Are there any restraints impacting market growth?
Increasing Applications for Corrosion Resistance; Growing Demand from Steel Production Industries.
8. Can you provide examples of recent developments in the market?
July 2022: Ferroglobe PLC entered a new phase in its silicon metal powder project for batteries and other advanced technologies, reaching a high purity production (up to 99.995%) in micrometer and sub-micrometer size.
9. What pricing options are available for accessing the report?
Pricing options include single-user, multi-user, and enterprise licenses priced at USD 4750, USD 5250, and USD 8750 respectively.
10. Is the market size provided in terms of value or volume?
The market size is provided in terms of value, measured in N/A.
11. Are there any specific market keywords associated with the report?
Yes, the market keyword associated with the report is "Ferroalloys Industry," which aids in identifying and referencing the specific market segment covered.
12. How do I determine which pricing option suits my needs best?
The pricing options vary based on user requirements and access needs. Individual users may opt for single-user licenses, while businesses requiring broader access may choose multi-user or enterprise licenses for cost-effective access to the report.
13. Are there any additional resources or data provided in the Ferroalloys Industry report?
While the report offers comprehensive insights, it's advisable to review the specific contents or supplementary materials provided to ascertain if additional resources or data are available.
14. How can I stay updated on further developments or reports in the Ferroalloys Industry?
To stay informed about further developments, trends, and reports in the Ferroalloys Industry, consider subscribing to industry newsletters, following relevant companies and organizations, or regularly checking reputable industry news sources and publications.
Methodology
Step 1 - Identification of Relevant Samples Size from Population Database


Step 2 - Approaches for Defining Global Market Size (Value, Volume* & Price*)

Note*: In applicable scenarios
Step 3 - Data Sources
Primary Research
- Web Analytics
- Survey Reports
- Research Institute
- Latest Research Reports
- Opinion Leaders
Secondary Research
- Annual Reports
- White Paper
- Latest Press Release
- Industry Association
- Paid Database
- Investor Presentations

Step 4 - Data Triangulation
Involves using different sources of information in order to increase the validity of a study
These sources are likely to be stakeholders in a program - participants, other researchers, program staff, other community members, and so on.
Then we put all data in single framework & apply various statistical tools to find out the dynamic on the market.
During the analysis stage, feedback from the stakeholder groups would be compared to determine areas of agreement as well as areas of divergence