

Key Insights
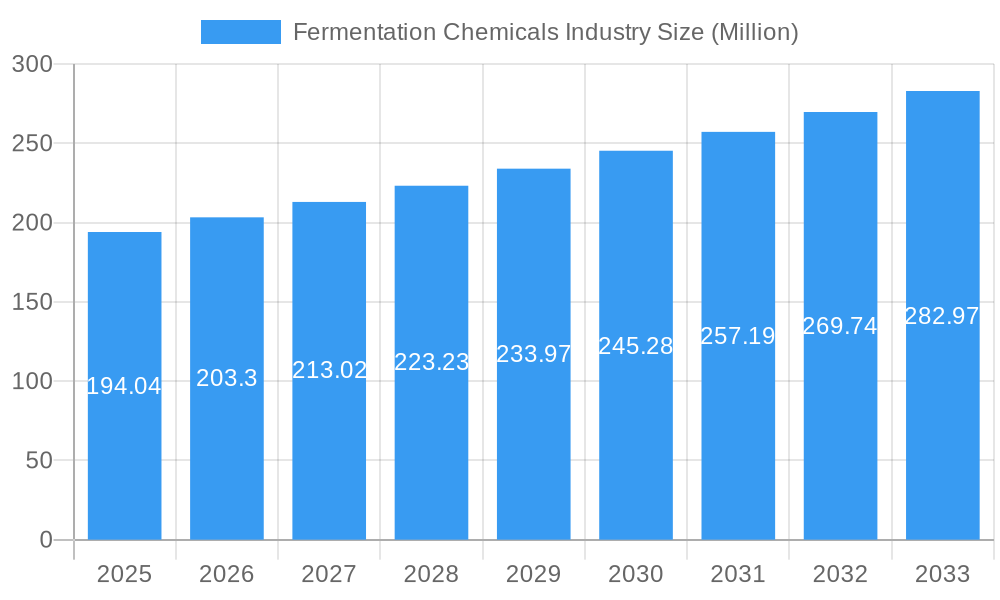
The global fermentation chemicals market, valued at $194.04 million in 2025, is projected to experience robust growth, exhibiting a compound annual growth rate (CAGR) of 4.60% from 2025 to 2033. This expansion is driven by several key factors. The increasing demand for bio-based products across diverse sectors, including food and beverage, pharmaceuticals, and industrial applications, is a primary catalyst. Growing consumer preference for natural and sustainable ingredients is fueling the adoption of fermentation-derived chemicals as alternatives to synthetic counterparts. Advancements in fermentation technologies, leading to higher yields and reduced production costs, further contribute to market growth. The rising prevalence of chronic diseases is also bolstering the demand for fermentation-derived pharmaceuticals and nutritional supplements. Specific product segments like enzymes and organic acids are experiencing particularly strong growth due to their widespread applications in various industries. Geographical expansion, especially in developing economies of Asia-Pacific, presents significant opportunities for market players. However, challenges such as stringent regulatory approvals and potential fluctuations in raw material prices represent constraints to market expansion.
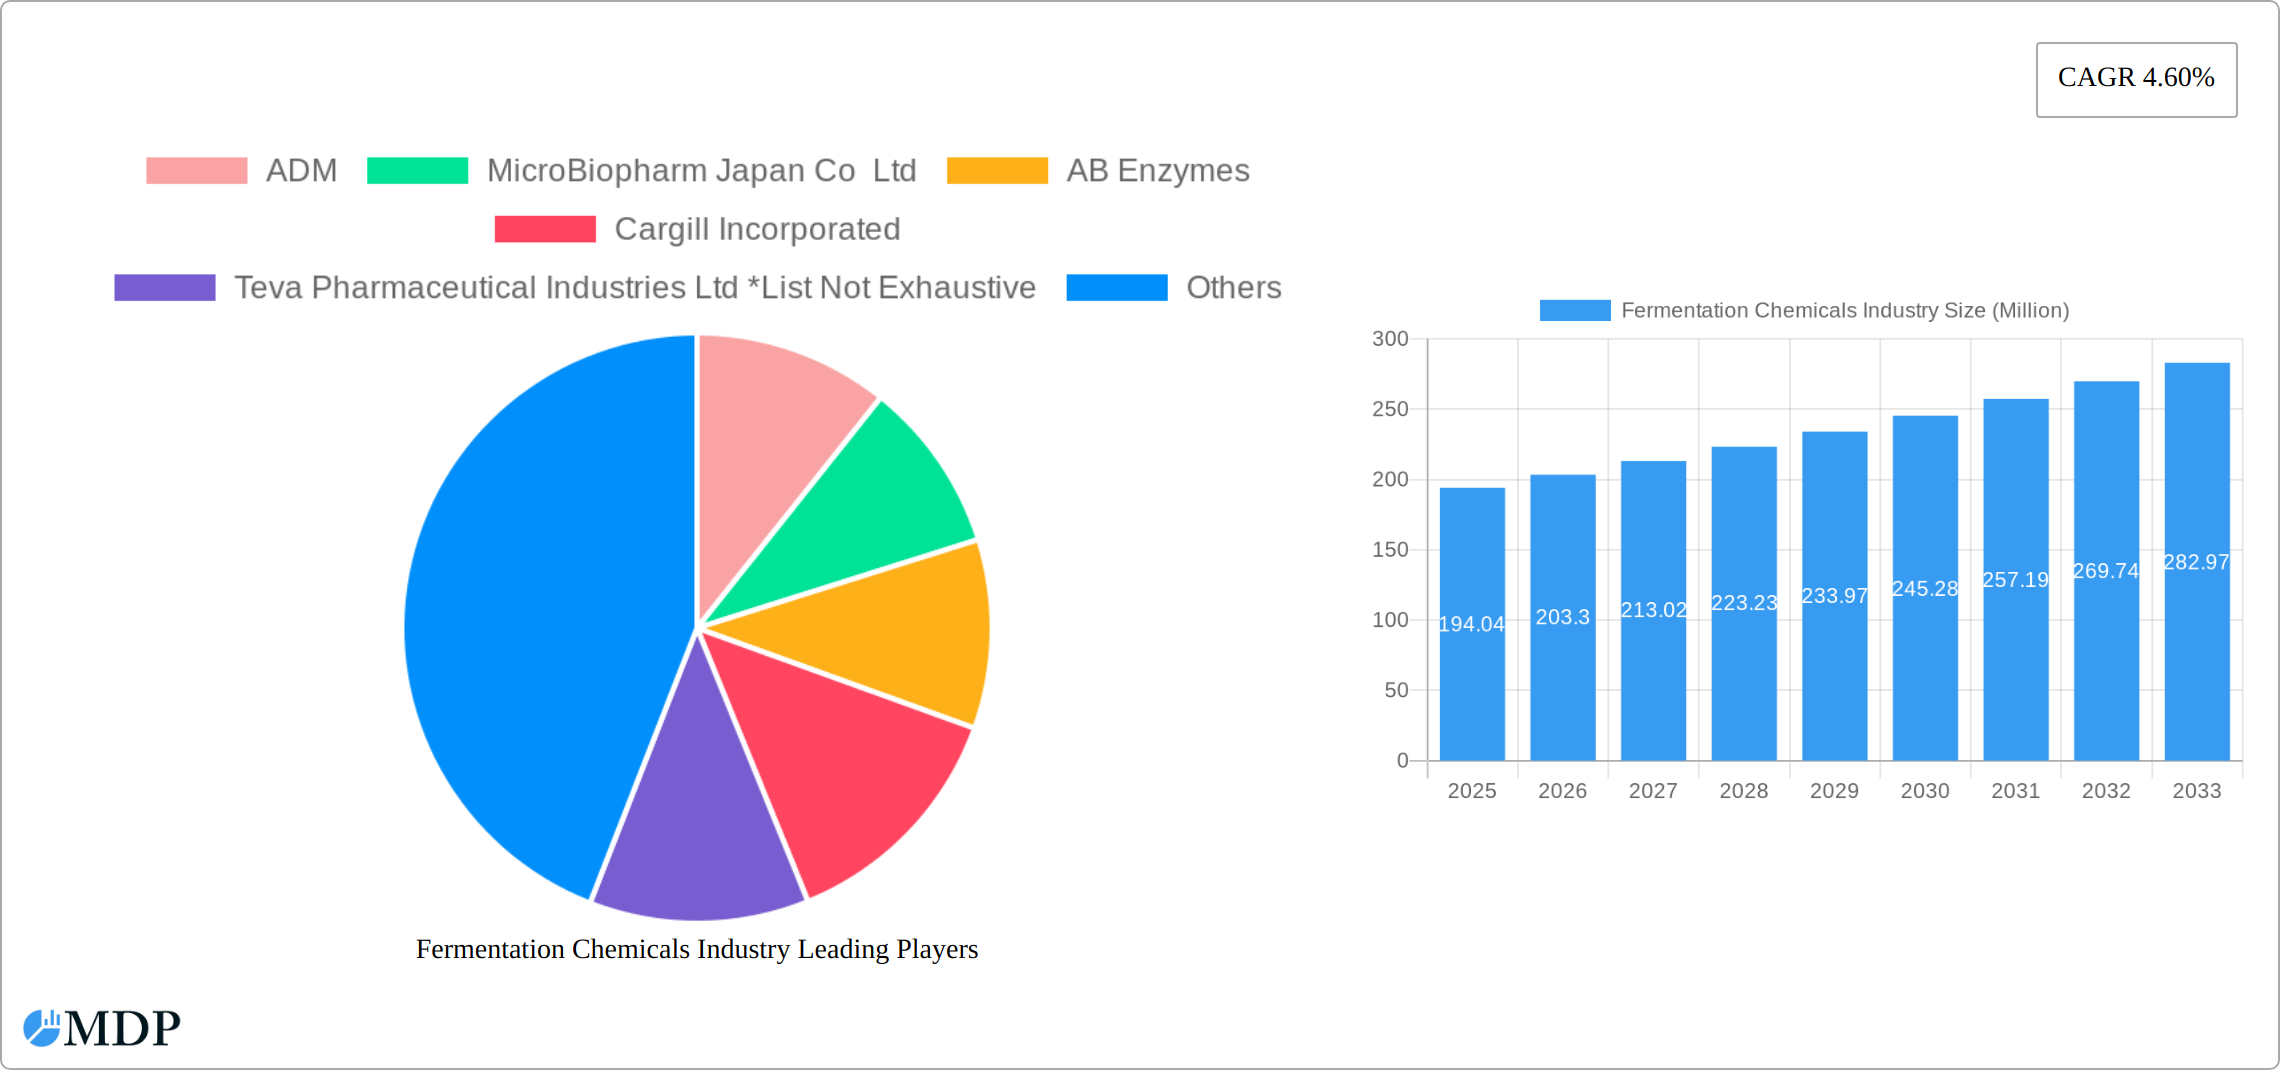
Fermentation Chemicals Industry Market Size (In Million)
While the market enjoys significant growth potential, competitive intensity among established players like ADM, Cargill, Novozymes, and BASF, alongside emerging companies, is notable. Companies are focusing on strategic partnerships, acquisitions, and research and development initiatives to enhance their product portfolios and expand their market reach. The market is segmented by product type (alcohols, organic acids, enzymes, others) and application (industrial, food & beverage, pharmaceutical & nutritional, plastics & fibers, others), allowing for targeted strategies by companies based on specific industry requirements and growth trends. The regional distribution of the market is diverse, with North America and Europe currently holding substantial market shares, but the Asia-Pacific region is poised for significant growth due to its expanding manufacturing base and rising consumer demand. The forecast period (2025-2033) anticipates continued expansion, driven by the factors mentioned above, creating opportunities for both established and emerging players in this dynamic market.
Fermentation Chemicals Industry Company Market Share
Fermentation Chemicals Industry: Market Report 2019-2033
This comprehensive report provides a detailed analysis of the global Fermentation Chemicals market, offering valuable insights for industry stakeholders, investors, and researchers. Covering the period 2019-2033, with a base year of 2025 and a forecast period of 2025-2033, this report analyzes market dynamics, trends, leading players, and future opportunities within this rapidly evolving sector. The global market size is projected to reach xx Million by 2033, exhibiting a significant CAGR.
Fermentation Chemicals Industry Market Dynamics & Concentration
The global fermentation chemicals market presents a moderately concentrated landscape, dominated by established players such as ADM, Cargill Incorporated, and BASF SE, who collectively command a significant market share. While the top five players hold an estimated xx% of the market, this concentration coexists with substantial opportunities for emerging companies and innovative technologies. Driving market growth is a strong emphasis on research and development (R&D), with companies investing heavily in creating novel enzymes, alcohols, and organic acids exhibiting improved performance and expanded applications. This innovation is further fueled by the increasing demand for sustainable and bio-based alternatives across various sectors. However, the industry faces challenges. Stringent regulatory frameworks governing food safety and environmental impact significantly influence market dynamics and necessitate ongoing compliance efforts. The availability of substitute products, notably chemically synthesized chemicals, presents a competitive pressure. Mergers and acquisitions (M&A) activity has been moderate in recent years (approximately xx deals between 2019 and 2024), largely focused on expanding product portfolios and geographical reach. This consolidation, combined with the burgeoning demand for sustainable solutions, creates a dynamic and evolving market.
- Market Concentration: Top 5 players hold xx% market share, indicating a moderately consolidated market with room for growth of smaller players.
- Innovation Drivers: Robust R&D investment in novel enzymes, sustainable processes, and advanced fermentation technologies is a key growth driver.
- Regulatory Landscape: Stringent food safety and environmental regulations necessitate compliance and influence product development strategies.
- Product Substitutes: Competition from chemically synthesized alternatives requires differentiation through innovation and sustainability.
- End-User Trends: The rising demand for sustainable and bio-based products in food, pharmaceuticals, and other sectors fuels significant market expansion.
- M&A Activity: Approximately xx deals between 2019 and 2024, primarily focused on strategic expansion and diversification.
Fermentation Chemicals Industry Trends & Analysis
The fermentation chemicals market is experiencing robust growth, driven by increasing demand across various applications. The global market is projected to reach xx Million by 2033, exhibiting a CAGR of xx%. Technological advancements, such as precision fermentation and advanced bioprocessing techniques, are revolutionizing the industry, leading to higher yields, improved product quality, and reduced costs. Consumer preferences towards natural and sustainable products fuel demand in the food and beverage sector. The competitive landscape is characterized by both established players and emerging biotech companies, leading to intense competition and continuous innovation. Market penetration of fermentation-derived chemicals is increasing steadily, driven by favorable government policies and environmental concerns.
Leading Markets & Segments in Fermentation Chemicals Industry
The Asia-Pacific region dominates the global fermentation chemicals market, driven by strong economic growth, expanding industrial sectors, and a burgeoning food and beverage industry. Within product types, enzymes hold the largest market share, followed by organic acids and alcohols. The pharmaceutical and nutritional segment is the fastest-growing application area.
- Dominant Region: Asia-Pacific
- Key Drivers: Rapid economic growth, expanding industrial sectors, and increasing consumer demand.
- Dominant Product Type: Enzymes
- Key Drivers: Versatility in applications, increasing demand in various industries.
- Dominant Application: Pharmaceutical and Nutritional
- Key Drivers: Growing demand for bio-based pharmaceuticals and nutritional supplements.
Fermentation Chemicals Industry Product Developments
Recent years have witnessed significant advancements in fermentation technology, leading to the development of novel enzymes with enhanced performance, improved stability, and broader applications. New organic acids and alcohols with tailored properties are also emerging, expanding their use in various industries. These innovations offer competitive advantages by enhancing product efficiency, cost-effectiveness, and sustainability. The market is seeing a shift towards precision fermentation and synthetic biology approaches, enabling the production of high-value chemicals with improved yields and reduced environmental impact.
Key Drivers of Fermentation Chemicals Industry Growth
The fermentation chemicals market is experiencing significant growth propelled by factors such as the rising demand for bio-based products driven by sustainability concerns, technological advancements in fermentation processes leading to higher efficiency and lower costs, and supportive government policies promoting bioeconomy initiatives. Increased investment in R&D, particularly in precision fermentation and metabolic engineering, is also a key driver.
Challenges in the Fermentation Chemicals Industry Market
The fermentation chemicals industry faces challenges such as fluctuating raw material prices which impacts production costs, stringent regulatory approvals for new products which can delay market entry, and intense competition from established players and new entrants which necessitates continuous innovation and cost optimization. Supply chain disruptions can also lead to production delays and increased costs.
Emerging Opportunities in Fermentation Chemicals Industry
The fermentation chemicals industry is poised for significant growth, driven by several key opportunities. The increasing global preference for sustainable and bio-based alternatives to traditional petrochemical-derived products is a major catalyst. This trend is further amplified by ongoing R&D efforts focused on developing innovative fermentation processes for high-value chemicals. The industry is expanding into new application areas, including bioplastics and biofuels, showcasing its versatility and adaptability. Crucially, strategic collaborations and partnerships between fermentation companies and end-users are accelerating market growth by facilitating access to new technologies and markets. This collaborative approach enhances the efficiency of technology transfer and ensures that innovative solutions meet real-world needs. The market is ripe for companies willing to invest in sustainable and efficient technologies.
Leading Players in the Fermentation Chemicals Industry Sector
Key Milestones in Fermentation Chemicals Industry Industry
- 2020: Novozymes launched a new, high-yield enzyme, significantly improving efficiency in various applications.
- 2022: BASF SE's acquisition of a smaller fermentation company expanded its product portfolio and market reach.
- 2023: Successful clinical trials of a fermentation-derived pharmaceutical underscored the industry's role in advancing healthcare.
- 2024: The introduction of new regulatory guidelines for fermentation-based products shaped industry standards and practices.
Strategic Outlook for Fermentation Chemicals Industry Market
The future of the fermentation chemicals market appears bright, driven by strong growth in demand across various sectors. Strategic opportunities include expansion into new applications, technological innovation to improve efficiency and sustainability, and strategic partnerships to enhance market access and secure raw materials. Further consolidation within the industry is also expected, resulting in a more concentrated market landscape.
Fermentation Chemicals Industry Segmentation
-
1. Product Type
- 1.1. Alcohols
- 1.2. Organic Acids
- 1.3. Enzymes
- 1.4. Other Product Types
-
2. Application
- 2.1. Industrial
- 2.2. Food and Beverage
- 2.3. Pharmaceutical and Nutritional
- 2.4. Plastics and Fibers
- 2.5. Other Applications
Fermentation Chemicals Industry Segmentation By Geography
-
1. Asia Pacific
- 1.1. China
- 1.2. India
- 1.3. Japan
- 1.4. South Korea
- 1.5. ASEAN Countries
- 1.6. Rest of Asia Pacific
-
2. North America
- 2.1. United States
- 2.2. Canada
- 2.3. Mexico
-
3. Europe
- 3.1. Germany
- 3.2. United Kingdom
- 3.3. Italy
- 3.4. France
- 3.5. Rest of Europe
-
4. South America
- 4.1. Brazil
- 4.2. Argentina
- 4.3. Rest of South America
-
5. Middle East and Africa
- 5.1. Saudi Arabia
- 5.2. South Africa
- 5.3. Rest of Middle East and Africa
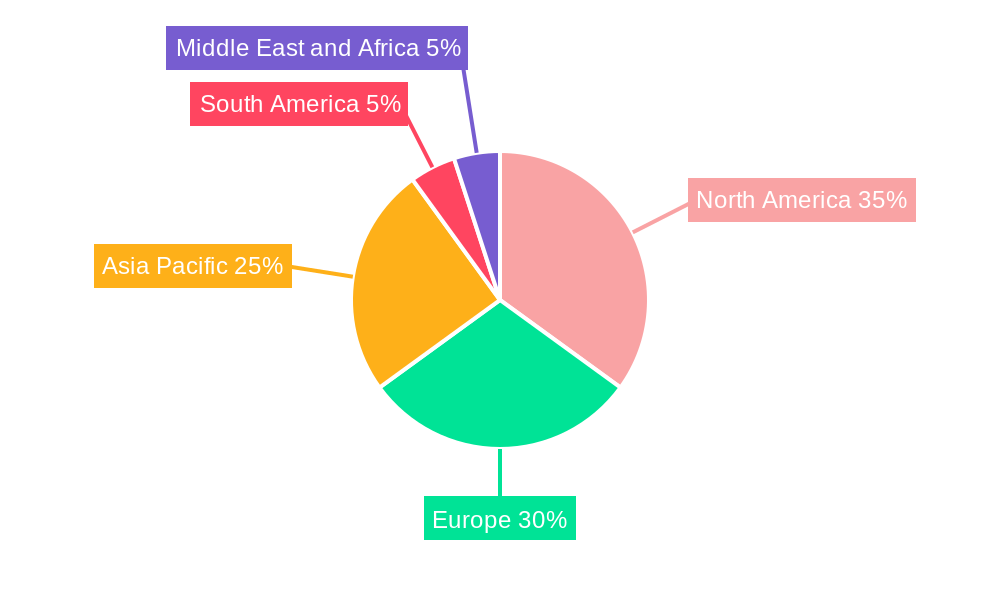
Fermentation Chemicals Industry Regional Market Share
Geographic Coverage of Fermentation Chemicals Industry
Fermentation Chemicals Industry REPORT HIGHLIGHTS
| Aspects | Details |
|---|---|
| Study Period | 2020-2034 |
| Base Year | 2025 |
| Estimated Year | 2026 |
| Forecast Period | 2026-2034 |
| Historical Period | 2020-2025 |
| Growth Rate | CAGR of 4.60% from 2020-2034 |
| Segmentation |
|
Table of Contents
- 1. Introduction
- 1.1. Research Scope
- 1.2. Market Segmentation
- 1.3. Research Objective
- 1.4. Definitions and Assumptions
- 2. Executive Summary
- 2.1. Market Snapshot
- 3. Market Dynamics
- 3.1. Market Drivers
- 3.2. Market Restrains
- 3.3. Market Trends
- 3.4. Market Opportunities
- 4. Market Factor Analysis
- 4.1. Porters Five Forces
- 4.1.1. Bargaining Power of Suppliers
- 4.1.2. Bargaining Power of Buyers
- 4.1.3. Threat of New Entrants
- 4.1.4. Threat of Substitutes
- 4.1.5. Competitive Rivalry
- 4.2. PESTEL analysis
- 4.3. BCG Analysis
- 4.3.1. Stars (High Growth, High Market Share)
- 4.3.2. Cash Cows (Low Growth, High Market Share)
- 4.3.3. Question Mark (High Growth, Low Market Share)
- 4.3.4. Dogs (Low Growth, Low Market Share)
- 4.4. Ansoff Matrix Analysis
- 4.5. Supply Chain Analysis
- 4.6. Regulatory Landscape
- 4.7. Current Market Potential and Opportunity Assessment (TAM–SAM–SOM Framework)
- 4.8. MDP Analyst Note
- 4.1. Porters Five Forces
- 5. Market Analysis, Insights and Forecast 2021-2033
- 5.1. Market Analysis, Insights and Forecast - by Product Type
- 5.1.1. Alcohols
- 5.1.2. Organic Acids
- 5.1.3. Enzymes
- 5.1.4. Other Product Types
- 5.2. Market Analysis, Insights and Forecast - by Application
- 5.2.1. Industrial
- 5.2.2. Food and Beverage
- 5.2.3. Pharmaceutical and Nutritional
- 5.2.4. Plastics and Fibers
- 5.2.5. Other Applications
- 5.3. Market Analysis, Insights and Forecast - by Region
- 5.3.1. Asia Pacific
- 5.3.2. North America
- 5.3.3. Europe
- 5.3.4. South America
- 5.3.5. Middle East and Africa
- 5.1. Market Analysis, Insights and Forecast - by Product Type
- 6. Global Fermentation Chemicals Industry Analysis, Insights and Forecast, 2021-2033
- 6.1. Market Analysis, Insights and Forecast - by Product Type
- 6.1.1. Alcohols
- 6.1.2. Organic Acids
- 6.1.3. Enzymes
- 6.1.4. Other Product Types
- 6.2. Market Analysis, Insights and Forecast - by Application
- 6.2.1. Industrial
- 6.2.2. Food and Beverage
- 6.2.3. Pharmaceutical and Nutritional
- 6.2.4. Plastics and Fibers
- 6.2.5. Other Applications
- 6.1. Market Analysis, Insights and Forecast - by Product Type
- 7. Asia Pacific Fermentation Chemicals Industry Analysis, Insights and Forecast, 2020-2032
- 7.1. Market Analysis, Insights and Forecast - by Product Type
- 7.1.1. Alcohols
- 7.1.2. Organic Acids
- 7.1.3. Enzymes
- 7.1.4. Other Product Types
- 7.2. Market Analysis, Insights and Forecast - by Application
- 7.2.1. Industrial
- 7.2.2. Food and Beverage
- 7.2.3. Pharmaceutical and Nutritional
- 7.2.4. Plastics and Fibers
- 7.2.5. Other Applications
- 7.1. Market Analysis, Insights and Forecast - by Product Type
- 8. North America Fermentation Chemicals Industry Analysis, Insights and Forecast, 2020-2032
- 8.1. Market Analysis, Insights and Forecast - by Product Type
- 8.1.1. Alcohols
- 8.1.2. Organic Acids
- 8.1.3. Enzymes
- 8.1.4. Other Product Types
- 8.2. Market Analysis, Insights and Forecast - by Application
- 8.2.1. Industrial
- 8.2.2. Food and Beverage
- 8.2.3. Pharmaceutical and Nutritional
- 8.2.4. Plastics and Fibers
- 8.2.5. Other Applications
- 8.1. Market Analysis, Insights and Forecast - by Product Type
- 9. Europe Fermentation Chemicals Industry Analysis, Insights and Forecast, 2020-2032
- 9.1. Market Analysis, Insights and Forecast - by Product Type
- 9.1.1. Alcohols
- 9.1.2. Organic Acids
- 9.1.3. Enzymes
- 9.1.4. Other Product Types
- 9.2. Market Analysis, Insights and Forecast - by Application
- 9.2.1. Industrial
- 9.2.2. Food and Beverage
- 9.2.3. Pharmaceutical and Nutritional
- 9.2.4. Plastics and Fibers
- 9.2.5. Other Applications
- 9.1. Market Analysis, Insights and Forecast - by Product Type
- 10. South America Fermentation Chemicals Industry Analysis, Insights and Forecast, 2020-2032
- 10.1. Market Analysis, Insights and Forecast - by Product Type
- 10.1.1. Alcohols
- 10.1.2. Organic Acids
- 10.1.3. Enzymes
- 10.1.4. Other Product Types
- 10.2. Market Analysis, Insights and Forecast - by Application
- 10.2.1. Industrial
- 10.2.2. Food and Beverage
- 10.2.3. Pharmaceutical and Nutritional
- 10.2.4. Plastics and Fibers
- 10.2.5. Other Applications
- 10.1. Market Analysis, Insights and Forecast - by Product Type
- 11. Middle East and Africa Fermentation Chemicals Industry Analysis, Insights and Forecast, 2020-2032
- 11.1. Market Analysis, Insights and Forecast - by Product Type
- 11.1.1. Alcohols
- 11.1.2. Organic Acids
- 11.1.3. Enzymes
- 11.1.4. Other Product Types
- 11.2. Market Analysis, Insights and Forecast - by Application
- 11.2.1. Industrial
- 11.2.2. Food and Beverage
- 11.2.3. Pharmaceutical and Nutritional
- 11.2.4. Plastics and Fibers
- 11.2.5. Other Applications
- 11.1. Market Analysis, Insights and Forecast - by Product Type
- 12. Competitive Analysis
- 12.1. Company Profiles
- 12.1.1 ADM
- 12.1.1.1. Company Overview
- 12.1.1.2. Products
- 12.1.1.3. Company Financials
- 12.1.1.4. SWOT Analysis
- 12.1.2 MicroBiopharm Japan Co Ltd
- 12.1.2.1. Company Overview
- 12.1.2.2. Products
- 12.1.2.3. Company Financials
- 12.1.2.4. SWOT Analysis
- 12.1.3 AB Enzymes
- 12.1.3.1. Company Overview
- 12.1.3.2. Products
- 12.1.3.3. Company Financials
- 12.1.3.4. SWOT Analysis
- 12.1.4 Cargill Incorporated
- 12.1.4.1. Company Overview
- 12.1.4.2. Products
- 12.1.4.3. Company Financials
- 12.1.4.4. SWOT Analysis
- 12.1.5 Teva Pharmaceutical Industries Ltd *List Not Exhaustive
- 12.1.5.1. Company Overview
- 12.1.5.2. Products
- 12.1.5.3. Company Financials
- 12.1.5.4. SWOT Analysis
- 12.1.6 BioVectra
- 12.1.6.1. Company Overview
- 12.1.6.2. Products
- 12.1.6.3. Company Financials
- 12.1.6.4. SWOT Analysis
- 12.1.7 Novozymes
- 12.1.7.1. Company Overview
- 12.1.7.2. Products
- 12.1.7.3. Company Financials
- 12.1.7.4. SWOT Analysis
- 12.1.8 Evonik Industries AG
- 12.1.8.1. Company Overview
- 12.1.8.2. Products
- 12.1.8.3. Company Financials
- 12.1.8.4. SWOT Analysis
- 12.1.9 Ajinomoto Co Inc
- 12.1.9.1. Company Overview
- 12.1.9.2. Products
- 12.1.9.3. Company Financials
- 12.1.9.4. SWOT Analysis
- 12.1.10 Chr Hansen Holding A/S
- 12.1.10.1. Company Overview
- 12.1.10.2. Products
- 12.1.10.3. Company Financials
- 12.1.10.4. SWOT Analysis
- 12.1.11 BASF SE
- 12.1.11.1. Company Overview
- 12.1.11.2. Products
- 12.1.11.3. Company Financials
- 12.1.11.4. SWOT Analysis
- 12.1.12 Biocon
- 12.1.12.1. Company Overview
- 12.1.12.2. Products
- 12.1.12.3. Company Financials
- 12.1.12.4. SWOT Analysis
- 12.1.13 DSM
- 12.1.13.1. Company Overview
- 12.1.13.2. Products
- 12.1.13.3. Company Financials
- 12.1.13.4. SWOT Analysis
- 12.1.14 Novasep
- 12.1.14.1. Company Overview
- 12.1.14.2. Products
- 12.1.14.3. Company Financials
- 12.1.14.4. SWOT Analysis
- 12.1.15 Lonza
- 12.1.15.1. Company Overview
- 12.1.15.2. Products
- 12.1.15.3. Company Financials
- 12.1.15.4. SWOT Analysis
- 12.1.1 ADM
- 12.2. Market Entropy
- 12.2.1 Company's Key Areas Served
- 12.2.2 Recent Developments
- 12.3. Company Market Share Analysis 2025
- 12.3.1 Top 5 Companies Market Share Analysis
- 12.3.2 Top 3 Companies Market Share Analysis
- 12.4. List of Potential Customers
- 13. Research Methodology
List of Figures
- Figure 1: Global Fermentation Chemicals Industry Revenue Breakdown (Million, %) by Region 2025 & 2033
- Figure 2: Asia Pacific Fermentation Chemicals Industry Revenue (Million), by Product Type 2025 & 2033
- Figure 3: Asia Pacific Fermentation Chemicals Industry Revenue Share (%), by Product Type 2025 & 2033
- Figure 4: Asia Pacific Fermentation Chemicals Industry Revenue (Million), by Application 2025 & 2033
- Figure 5: Asia Pacific Fermentation Chemicals Industry Revenue Share (%), by Application 2025 & 2033
- Figure 6: Asia Pacific Fermentation Chemicals Industry Revenue (Million), by Country 2025 & 2033
- Figure 7: Asia Pacific Fermentation Chemicals Industry Revenue Share (%), by Country 2025 & 2033
- Figure 8: North America Fermentation Chemicals Industry Revenue (Million), by Product Type 2025 & 2033
- Figure 9: North America Fermentation Chemicals Industry Revenue Share (%), by Product Type 2025 & 2033
- Figure 10: North America Fermentation Chemicals Industry Revenue (Million), by Application 2025 & 2033
- Figure 11: North America Fermentation Chemicals Industry Revenue Share (%), by Application 2025 & 2033
- Figure 12: North America Fermentation Chemicals Industry Revenue (Million), by Country 2025 & 2033
- Figure 13: North America Fermentation Chemicals Industry Revenue Share (%), by Country 2025 & 2033
- Figure 14: Europe Fermentation Chemicals Industry Revenue (Million), by Product Type 2025 & 2033
- Figure 15: Europe Fermentation Chemicals Industry Revenue Share (%), by Product Type 2025 & 2033
- Figure 16: Europe Fermentation Chemicals Industry Revenue (Million), by Application 2025 & 2033
- Figure 17: Europe Fermentation Chemicals Industry Revenue Share (%), by Application 2025 & 2033
- Figure 18: Europe Fermentation Chemicals Industry Revenue (Million), by Country 2025 & 2033
- Figure 19: Europe Fermentation Chemicals Industry Revenue Share (%), by Country 2025 & 2033
- Figure 20: South America Fermentation Chemicals Industry Revenue (Million), by Product Type 2025 & 2033
- Figure 21: South America Fermentation Chemicals Industry Revenue Share (%), by Product Type 2025 & 2033
- Figure 22: South America Fermentation Chemicals Industry Revenue (Million), by Application 2025 & 2033
- Figure 23: South America Fermentation Chemicals Industry Revenue Share (%), by Application 2025 & 2033
- Figure 24: South America Fermentation Chemicals Industry Revenue (Million), by Country 2025 & 2033
- Figure 25: South America Fermentation Chemicals Industry Revenue Share (%), by Country 2025 & 2033
- Figure 26: Middle East and Africa Fermentation Chemicals Industry Revenue (Million), by Product Type 2025 & 2033
- Figure 27: Middle East and Africa Fermentation Chemicals Industry Revenue Share (%), by Product Type 2025 & 2033
- Figure 28: Middle East and Africa Fermentation Chemicals Industry Revenue (Million), by Application 2025 & 2033
- Figure 29: Middle East and Africa Fermentation Chemicals Industry Revenue Share (%), by Application 2025 & 2033
- Figure 30: Middle East and Africa Fermentation Chemicals Industry Revenue (Million), by Country 2025 & 2033
- Figure 31: Middle East and Africa Fermentation Chemicals Industry Revenue Share (%), by Country 2025 & 2033
List of Tables
- Table 1: Global Fermentation Chemicals Industry Revenue Million Forecast, by Product Type 2020 & 2033
- Table 2: Global Fermentation Chemicals Industry Revenue Million Forecast, by Application 2020 & 2033
- Table 3: Global Fermentation Chemicals Industry Revenue Million Forecast, by Region 2020 & 2033
- Table 4: Global Fermentation Chemicals Industry Revenue Million Forecast, by Product Type 2020 & 2033
- Table 5: Global Fermentation Chemicals Industry Revenue Million Forecast, by Application 2020 & 2033
- Table 6: Global Fermentation Chemicals Industry Revenue Million Forecast, by Country 2020 & 2033
- Table 7: China Fermentation Chemicals Industry Revenue (Million) Forecast, by Application 2020 & 2033
- Table 8: India Fermentation Chemicals Industry Revenue (Million) Forecast, by Application 2020 & 2033
- Table 9: Japan Fermentation Chemicals Industry Revenue (Million) Forecast, by Application 2020 & 2033
- Table 10: South Korea Fermentation Chemicals Industry Revenue (Million) Forecast, by Application 2020 & 2033
- Table 11: ASEAN Countries Fermentation Chemicals Industry Revenue (Million) Forecast, by Application 2020 & 2033
- Table 12: Rest of Asia Pacific Fermentation Chemicals Industry Revenue (Million) Forecast, by Application 2020 & 2033
- Table 13: Global Fermentation Chemicals Industry Revenue Million Forecast, by Product Type 2020 & 2033
- Table 14: Global Fermentation Chemicals Industry Revenue Million Forecast, by Application 2020 & 2033
- Table 15: Global Fermentation Chemicals Industry Revenue Million Forecast, by Country 2020 & 2033
- Table 16: United States Fermentation Chemicals Industry Revenue (Million) Forecast, by Application 2020 & 2033
- Table 17: Canada Fermentation Chemicals Industry Revenue (Million) Forecast, by Application 2020 & 2033
- Table 18: Mexico Fermentation Chemicals Industry Revenue (Million) Forecast, by Application 2020 & 2033
- Table 19: Global Fermentation Chemicals Industry Revenue Million Forecast, by Product Type 2020 & 2033
- Table 20: Global Fermentation Chemicals Industry Revenue Million Forecast, by Application 2020 & 2033
- Table 21: Global Fermentation Chemicals Industry Revenue Million Forecast, by Country 2020 & 2033
- Table 22: Germany Fermentation Chemicals Industry Revenue (Million) Forecast, by Application 2020 & 2033
- Table 23: United Kingdom Fermentation Chemicals Industry Revenue (Million) Forecast, by Application 2020 & 2033
- Table 24: Italy Fermentation Chemicals Industry Revenue (Million) Forecast, by Application 2020 & 2033
- Table 25: France Fermentation Chemicals Industry Revenue (Million) Forecast, by Application 2020 & 2033
- Table 26: Rest of Europe Fermentation Chemicals Industry Revenue (Million) Forecast, by Application 2020 & 2033
- Table 27: Global Fermentation Chemicals Industry Revenue Million Forecast, by Product Type 2020 & 2033
- Table 28: Global Fermentation Chemicals Industry Revenue Million Forecast, by Application 2020 & 2033
- Table 29: Global Fermentation Chemicals Industry Revenue Million Forecast, by Country 2020 & 2033
- Table 30: Brazil Fermentation Chemicals Industry Revenue (Million) Forecast, by Application 2020 & 2033
- Table 31: Argentina Fermentation Chemicals Industry Revenue (Million) Forecast, by Application 2020 & 2033
- Table 32: Rest of South America Fermentation Chemicals Industry Revenue (Million) Forecast, by Application 2020 & 2033
- Table 33: Global Fermentation Chemicals Industry Revenue Million Forecast, by Product Type 2020 & 2033
- Table 34: Global Fermentation Chemicals Industry Revenue Million Forecast, by Application 2020 & 2033
- Table 35: Global Fermentation Chemicals Industry Revenue Million Forecast, by Country 2020 & 2033
- Table 36: Saudi Arabia Fermentation Chemicals Industry Revenue (Million) Forecast, by Application 2020 & 2033
- Table 37: South Africa Fermentation Chemicals Industry Revenue (Million) Forecast, by Application 2020 & 2033
- Table 38: Rest of Middle East and Africa Fermentation Chemicals Industry Revenue (Million) Forecast, by Application 2020 & 2033
Frequently Asked Questions
1. What is the projected Compound Annual Growth Rate (CAGR) of the Fermentation Chemicals Industry?
The projected CAGR is approximately 4.60%.
2. Which companies are prominent players in the Fermentation Chemicals Industry?
Key companies in the market include ADM, MicroBiopharm Japan Co Ltd, AB Enzymes, Cargill Incorporated, Teva Pharmaceutical Industries Ltd *List Not Exhaustive, BioVectra, Novozymes, Evonik Industries AG, Ajinomoto Co Inc, Chr Hansen Holding A/S, BASF SE, Biocon, DSM, Novasep, Lonza.
3. What are the main segments of the Fermentation Chemicals Industry?
The market segments include Product Type, Application.
4. Can you provide details about the market size?
The market size is estimated to be USD 194.04 Million as of 2022.
5. What are some drivers contributing to market growth?
Growing Demand from Methanol and Ethanol Industry; Increasing Demand from the Pharmaceutical Industry; Other Drivers.
6. What are the notable trends driving market growth?
Food and Beverage Sector to Dominate the Market.
7. Are there any restraints impacting market growth?
High Cost Due to the Complexity Involved in the Manufacturing Process; Other Restraints.
8. Can you provide examples of recent developments in the market?
N/A
9. What pricing options are available for accessing the report?
Pricing options include single-user, multi-user, and enterprise licenses priced at USD 4750, USD 5250, and USD 8750 respectively.
10. Is the market size provided in terms of value or volume?
The market size is provided in terms of value, measured in Million.
11. Are there any specific market keywords associated with the report?
Yes, the market keyword associated with the report is "Fermentation Chemicals Industry," which aids in identifying and referencing the specific market segment covered.
12. How do I determine which pricing option suits my needs best?
The pricing options vary based on user requirements and access needs. Individual users may opt for single-user licenses, while businesses requiring broader access may choose multi-user or enterprise licenses for cost-effective access to the report.
13. Are there any additional resources or data provided in the Fermentation Chemicals Industry report?
While the report offers comprehensive insights, it's advisable to review the specific contents or supplementary materials provided to ascertain if additional resources or data are available.
14. How can I stay updated on further developments or reports in the Fermentation Chemicals Industry?
To stay informed about further developments, trends, and reports in the Fermentation Chemicals Industry, consider subscribing to industry newsletters, following relevant companies and organizations, or regularly checking reputable industry news sources and publications.
Methodology
Step 1 - Identification of Relevant Samples Size from Population Database


Step 2 - Approaches for Defining Global Market Size (Value, Volume* & Price*)

Note*: In applicable scenarios
Step 3 - Data Sources
Primary Research
- Web Analytics
- Survey Reports
- Research Institute
- Latest Research Reports
- Opinion Leaders
Secondary Research
- Annual Reports
- White Paper
- Latest Press Release
- Industry Association
- Paid Database
- Investor Presentations

Step 4 - Data Triangulation
Involves using different sources of information in order to increase the validity of a study
These sources are likely to be stakeholders in a program - participants, other researchers, program staff, other community members, and so on.
Then we put all data in single framework & apply various statistical tools to find out the dynamic on the market.
During the analysis stage, feedback from the stakeholder groups would be compared to determine areas of agreement as well as areas of divergence