

Key Insights
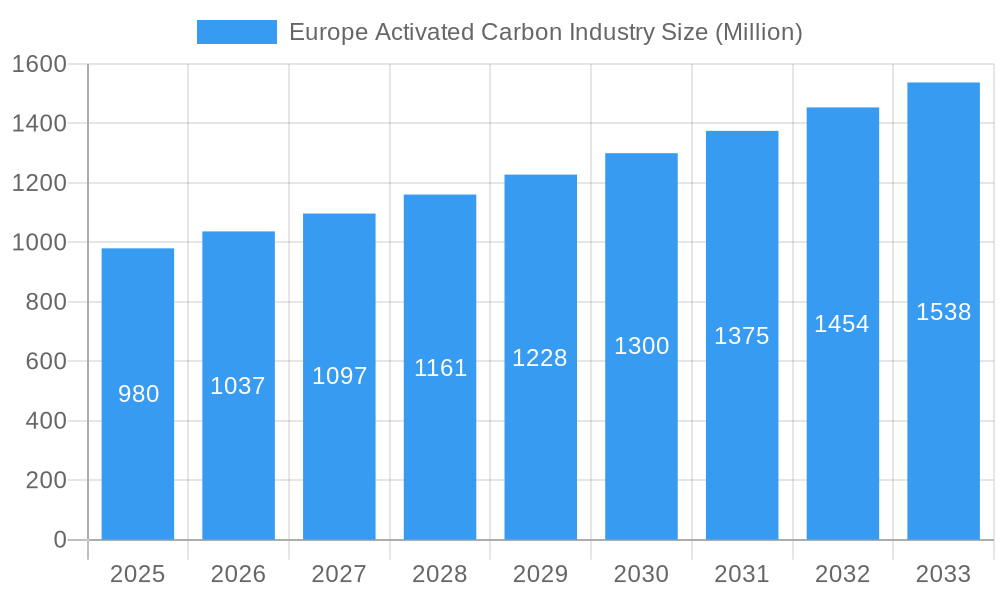
The European activated carbon market, valued at approximately €980 million in 2025, is projected to experience robust growth, driven by increasing demand across diverse applications. The 5.41% CAGR indicates a steady expansion throughout the forecast period (2025-2033). Key drivers include stringent environmental regulations promoting water and air purification, particularly in Germany, France, and the UK, the rising adoption of activated carbon in industrial processes like metal extraction, and growth in the pharmaceutical and healthcare sectors. The granular activated carbon (GAC) segment currently dominates due to its versatility and efficacy in various applications, while powdered activated carbon (PAC) shows potential for growth in niche applications requiring rapid adsorption. Trends such as the development of advanced activated carbon materials with enhanced adsorption capacities and the exploration of sustainable production methods are shaping market dynamics. Potential restraints include fluctuating raw material prices and the emergence of alternative technologies. However, the overall market outlook remains positive, fueled by consistent demand from major industries and the commitment to environmental sustainability across Europe.
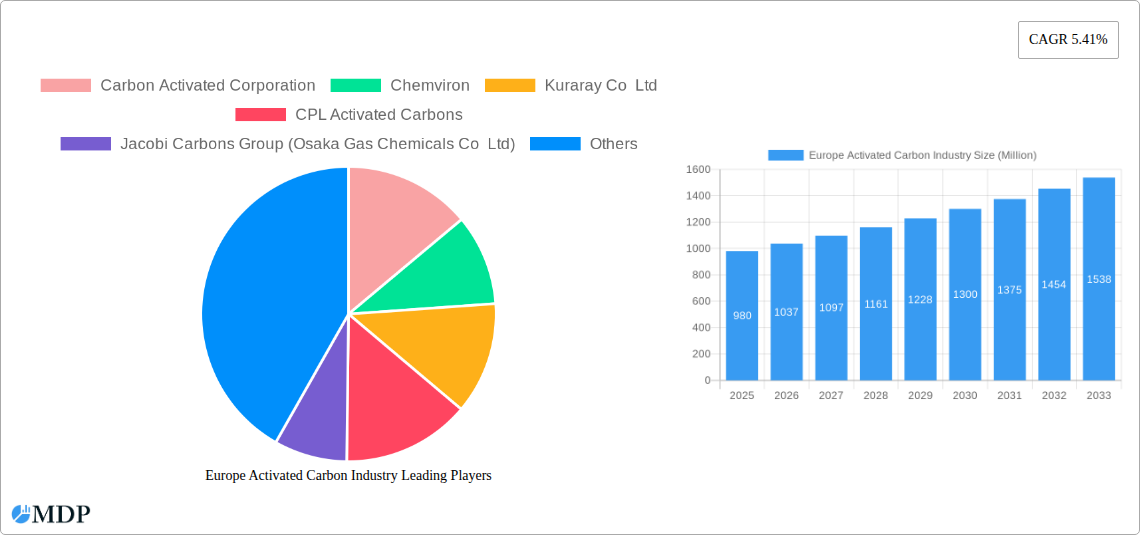
Europe Activated Carbon Industry Market Size (In Million)
Growth is expected to be particularly strong in the water purification segment due to increasing concerns about water scarcity and stricter regulations on water quality. The increasing adoption of activated carbon in gas purification applications related to industrial emissions and air pollution control will also contribute to the market expansion. Furthermore, the medicine and healthcare sector is demonstrating significant potential, with activated carbon being increasingly used in drug delivery and medical treatments. Competition among major players like Carbon Activated Corporation, Chemviron, Kuraray Co Ltd, and others will likely intensify, leading to innovations in product development and strategic partnerships to capture market share. Regional variations will exist, with Germany, France, and the UK expected to maintain leading positions due to their established industrial base and stringent environmental regulations. The "Rest of Europe" segment also holds promise for future growth as awareness of activated carbon's benefits increases.
Europe Activated Carbon Industry Company Market Share
This comprehensive report provides an in-depth analysis of the Europe Activated Carbon Industry, covering market dynamics, leading players, industry trends, and future growth prospects from 2019-2033. The report utilizes data from the historical period (2019-2024), base year (2025), and estimated year (2025) to forecast market trends up to 2033. This essential resource is designed for industry stakeholders, investors, and market entrants seeking to understand and capitalize on opportunities within this dynamic sector.
Europe Activated Carbon Industry Market Dynamics & Concentration
The European activated carbon market exhibits a moderately concentrated landscape, with key players like Albemarle Corporation, Ingevity, and Kuraray Co Ltd holding significant market share. The exact market share distribution for 2025 is estimated at xx%, with a concentration ratio (CR4) of approximately xx%. However, several smaller, specialized companies contribute to overall market volume. Innovation drives competition, with ongoing R&D focusing on enhancing adsorption capacity, improving selectivity, and developing sustainable production methods.
Stringent environmental regulations, particularly concerning water and air purification, are major drivers, while the emergence of alternative filtration technologies creates competitive pressure. Mergers and acquisitions (M&A) activity has been moderate in recent years, with approximately xx deals recorded between 2019 and 2024. These activities aim to consolidate market share and expand product portfolios. End-user trends favor eco-friendly solutions, with growing demand for activated carbon in environmentally conscious industries such as water treatment and renewable energy.
- Market Concentration: Moderately concentrated, with top players holding xx% market share in 2025 (estimated).
- Innovation Drivers: Enhanced adsorption, selectivity, sustainable production.
- Regulatory Framework: Stringent environmental regulations driving demand.
- Product Substitutes: Emerging alternative filtration technologies pose a competitive threat.
- End-User Trends: Growing demand from environmentally conscious industries.
- M&A Activity: Approximately xx deals between 2019 and 2024.
Europe Activated Carbon Industry Industry Trends & Analysis
The European activated carbon market is projected to experience a Compound Annual Growth Rate (CAGR) of xx% during the forecast period (2025-2033). This growth is primarily driven by increasing demand from water and air purification applications, fueled by stricter environmental regulations across Europe. Technological advancements, particularly in the development of high-performance activated carbons with enhanced adsorption capabilities, are also significantly contributing to market expansion. Furthermore, the rising adoption of activated carbon in emerging applications such as lithium-ion battery production and medical devices is accelerating market growth. However, fluctuating raw material prices and potential supply chain disruptions pose challenges to sustained growth. Market penetration in niche applications, such as metal extraction and medicine, remains relatively low, presenting opportunities for future expansion. Competitive dynamics are intense, with companies vying for market share through product innovation, strategic partnerships, and price competitiveness.
Leading Markets & Segments in Europe Activated Carbon Industry
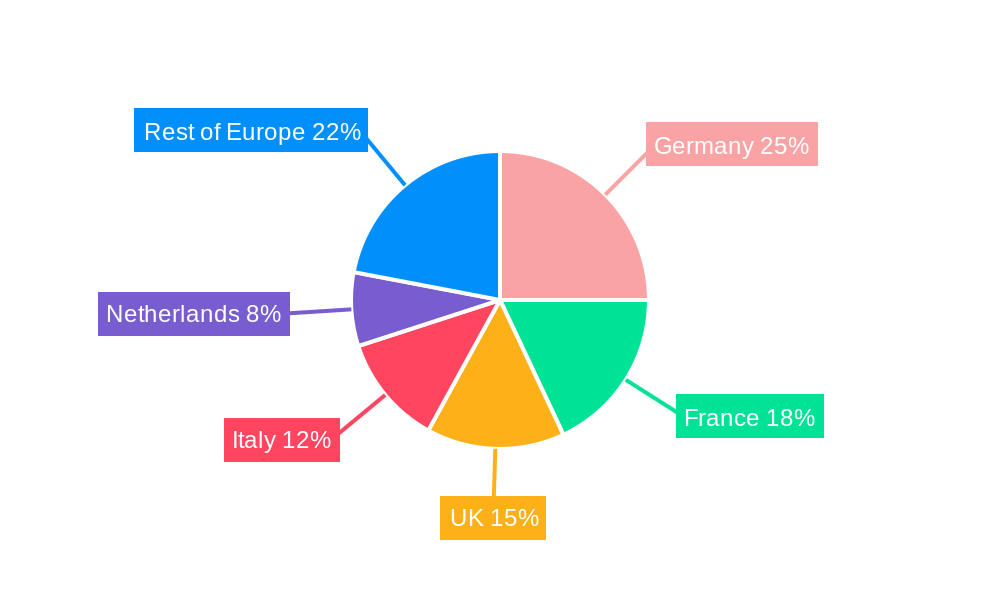
Germany, France, and the UK are currently the leading markets for activated carbon in Europe, driven by robust industrial activity and stringent environmental regulations. Within the product segments, Granular Activated Carbon (GAC) holds the largest market share, followed by Powdered Activated Carbon (PAC). Extruded or Pelletized Activated Carbon shows significant growth potential due to its advantages in specific applications.
- Key Drivers of Regional Dominance:
- Germany, France, UK: Strong industrial base, stringent environmental regulations, robust infrastructure.
- Segment Dominance:
- GAC (Granular Activated Carbon): Largest market share due to versatility and suitability for various applications.
- PAC (Powdered Activated Carbon): Significant market share, particularly in water treatment.
- Extruded/Pelletized Activated Carbon: Growing rapidly due to advantages in specific applications.
- Application Dominance: Water purification currently accounts for the largest share of applications, followed closely by Gas purification, which is experiencing the fastest growth due to the energy sector's needs.
Europe Activated Carbon Industry Product Developments
Recent product developments focus on enhancing the adsorption capacity and selectivity of activated carbon through innovative manufacturing techniques and material modifications. This includes the use of novel precursors and activation methods to create tailored activated carbons for specific applications, such as superior performance in gas purification for industrial processes or improved efficiency in water treatment. Competitive advantages are increasingly gained through specialized product offerings, efficient manufacturing processes, and establishing strong supply chains.
Key Drivers of Europe Activated Carbon Industry Growth
The growth of the European activated carbon industry is primarily fueled by the increasing demand for water and air purification solutions driven by stricter environmental regulations. Technological advancements leading to enhanced product performance and cost-effectiveness play a significant role. The expansion into new applications like energy storage and medical devices also provides further impetus to market growth.
Challenges in the Europe Activated Carbon Industry Market
The industry faces challenges from fluctuating raw material prices, which directly impact production costs and profitability. Supply chain disruptions can cause significant operational issues, and intense competition necessitates continuous product innovation to maintain market share. Furthermore, managing the environmental impact of manufacturing processes is crucial for long-term sustainability.
Emerging Opportunities in Europe Activated Carbon Industry
Emerging opportunities lie in the growing demand for high-performance activated carbons in specialized applications, such as lithium-ion batteries for electric vehicles. Strategic partnerships and collaborations to develop innovative solutions for emerging sectors like renewable energy and healthcare will drive growth. Market expansion in Eastern European countries presents significant potential.
Leading Players in the Europe Activated Carbon Industry Sector
- Albemarle Corporation
- Ingevity
- Kuraray Co Ltd
- Carbon Activated Corporation
- Chemviron
- CPL Activated Carbons
- Jacobi Carbons Group (Osaka Gas Chemicals Co Ltd)
- Kureha Corporation
- CarboTech
- Puragen Activated Carbons
- Donau Chemie AG
Key Milestones in Europe Activated Carbon Industry Industry
- August 2022: Ingevity invested USD 60 million in a USD 170 million round to acquire an equity stake in Nexeon Limited. This strategic move strengthens Ingevity's position in the electric vehicle (EV) market and expands its activated carbon business opportunities.
Strategic Outlook for Europe Activated Carbon Industry Market
The European activated carbon market shows strong growth potential driven by environmental regulations, technological advancements, and expansion into new applications. Strategic partnerships, focusing on R&D, and efficient supply chain management are crucial for long-term success. Companies that successfully adapt to these trends and innovate will capture significant market share in the coming years.
Europe Activated Carbon Industry Segmentation
-
1. Type
- 1.1. Powdered Activated Carbon (PAC)
- 1.2. Granular Activated Carbon (GAC)
- 1.3. Extruded or Pelletized Activated Carbon
-
2. Application
- 2.1. Gas Purification
- 2.2. Water Purification
- 2.3. Metal Extraction
- 2.4. Medicine
- 2.5. Other Applications
Europe Activated Carbon Industry Segmentation By Geography
- 1. Germany
- 2. United Kingdom
- 3. France
- 4. Italy
- 5. Spain
- 6. Rest of Europe
Europe Activated Carbon Industry Regional Market Share
Geographic Coverage of Europe Activated Carbon Industry
Europe Activated Carbon Industry REPORT HIGHLIGHTS
| Aspects | Details |
|---|---|
| Study Period | 2020-2034 |
| Base Year | 2025 |
| Estimated Year | 2026 |
| Forecast Period | 2026-2034 |
| Historical Period | 2020-2025 |
| Growth Rate | CAGR of 5.41% from 2020-2034 |
| Segmentation |
|
Table of Contents
- 1. Introduction
- 1.1. Research Scope
- 1.2. Market Segmentation
- 1.3. Research Objective
- 1.4. Definitions and Assumptions
- 2. Executive Summary
- 2.1. Market Snapshot
- 3. Market Dynamics
- 3.1. Market Drivers
- 3.2. Market Restrains
- 3.3. Market Trends
- 3.4. Market Opportunities
- 4. Market Factor Analysis
- 4.1. Porters Five Forces
- 4.1.1. Bargaining Power of Suppliers
- 4.1.2. Bargaining Power of Buyers
- 4.1.3. Threat of New Entrants
- 4.1.4. Threat of Substitutes
- 4.1.5. Competitive Rivalry
- 4.2. PESTEL analysis
- 4.3. BCG Analysis
- 4.3.1. Stars (High Growth, High Market Share)
- 4.3.2. Cash Cows (Low Growth, High Market Share)
- 4.3.3. Question Mark (High Growth, Low Market Share)
- 4.3.4. Dogs (Low Growth, Low Market Share)
- 4.4. Ansoff Matrix Analysis
- 4.5. Supply Chain Analysis
- 4.6. Regulatory Landscape
- 4.7. Current Market Potential and Opportunity Assessment (TAM–SAM–SOM Framework)
- 4.8. MDP Analyst Note
- 4.1. Porters Five Forces
- 5. Market Analysis, Insights and Forecast 2021-2033
- 5.1. Market Analysis, Insights and Forecast - by Type
- 5.1.1. Powdered Activated Carbon (PAC)
- 5.1.2. Granular Activated Carbon (GAC)
- 5.1.3. Extruded or Pelletized Activated Carbon
- 5.2. Market Analysis, Insights and Forecast - by Application
- 5.2.1. Gas Purification
- 5.2.2. Water Purification
- 5.2.3. Metal Extraction
- 5.2.4. Medicine
- 5.2.5. Other Applications
- 5.3. Market Analysis, Insights and Forecast - by Region
- 5.3.1. Germany
- 5.3.2. United Kingdom
- 5.3.3. France
- 5.3.4. Italy
- 5.3.5. Spain
- 5.3.6. Rest of Europe
- 5.1. Market Analysis, Insights and Forecast - by Type
- 6. Europe Activated Carbon Industry Analysis, Insights and Forecast, 2021-2033
- 6.1. Market Analysis, Insights and Forecast - by Type
- 6.1.1. Powdered Activated Carbon (PAC)
- 6.1.2. Granular Activated Carbon (GAC)
- 6.1.3. Extruded or Pelletized Activated Carbon
- 6.2. Market Analysis, Insights and Forecast - by Application
- 6.2.1. Gas Purification
- 6.2.2. Water Purification
- 6.2.3. Metal Extraction
- 6.2.4. Medicine
- 6.2.5. Other Applications
- 6.1. Market Analysis, Insights and Forecast - by Type
- 7. Germany Europe Activated Carbon Industry Analysis, Insights and Forecast, 2020-2032
- 7.1. Market Analysis, Insights and Forecast - by Type
- 7.1.1. Powdered Activated Carbon (PAC)
- 7.1.2. Granular Activated Carbon (GAC)
- 7.1.3. Extruded or Pelletized Activated Carbon
- 7.2. Market Analysis, Insights and Forecast - by Application
- 7.2.1. Gas Purification
- 7.2.2. Water Purification
- 7.2.3. Metal Extraction
- 7.2.4. Medicine
- 7.2.5. Other Applications
- 7.1. Market Analysis, Insights and Forecast - by Type
- 8. United Kingdom Europe Activated Carbon Industry Analysis, Insights and Forecast, 2020-2032
- 8.1. Market Analysis, Insights and Forecast - by Type
- 8.1.1. Powdered Activated Carbon (PAC)
- 8.1.2. Granular Activated Carbon (GAC)
- 8.1.3. Extruded or Pelletized Activated Carbon
- 8.2. Market Analysis, Insights and Forecast - by Application
- 8.2.1. Gas Purification
- 8.2.2. Water Purification
- 8.2.3. Metal Extraction
- 8.2.4. Medicine
- 8.2.5. Other Applications
- 8.1. Market Analysis, Insights and Forecast - by Type
- 9. France Europe Activated Carbon Industry Analysis, Insights and Forecast, 2020-2032
- 9.1. Market Analysis, Insights and Forecast - by Type
- 9.1.1. Powdered Activated Carbon (PAC)
- 9.1.2. Granular Activated Carbon (GAC)
- 9.1.3. Extruded or Pelletized Activated Carbon
- 9.2. Market Analysis, Insights and Forecast - by Application
- 9.2.1. Gas Purification
- 9.2.2. Water Purification
- 9.2.3. Metal Extraction
- 9.2.4. Medicine
- 9.2.5. Other Applications
- 9.1. Market Analysis, Insights and Forecast - by Type
- 10. Italy Europe Activated Carbon Industry Analysis, Insights and Forecast, 2020-2032
- 10.1. Market Analysis, Insights and Forecast - by Type
- 10.1.1. Powdered Activated Carbon (PAC)
- 10.1.2. Granular Activated Carbon (GAC)
- 10.1.3. Extruded or Pelletized Activated Carbon
- 10.2. Market Analysis, Insights and Forecast - by Application
- 10.2.1. Gas Purification
- 10.2.2. Water Purification
- 10.2.3. Metal Extraction
- 10.2.4. Medicine
- 10.2.5. Other Applications
- 10.1. Market Analysis, Insights and Forecast - by Type
- 11. Spain Europe Activated Carbon Industry Analysis, Insights and Forecast, 2020-2032
- 11.1. Market Analysis, Insights and Forecast - by Type
- 11.1.1. Powdered Activated Carbon (PAC)
- 11.1.2. Granular Activated Carbon (GAC)
- 11.1.3. Extruded or Pelletized Activated Carbon
- 11.2. Market Analysis, Insights and Forecast - by Application
- 11.2.1. Gas Purification
- 11.2.2. Water Purification
- 11.2.3. Metal Extraction
- 11.2.4. Medicine
- 11.2.5. Other Applications
- 11.1. Market Analysis, Insights and Forecast - by Type
- 12. Rest of Europe Europe Activated Carbon Industry Analysis, Insights and Forecast, 2020-2032
- 12.1. Market Analysis, Insights and Forecast - by Type
- 12.1.1. Powdered Activated Carbon (PAC)
- 12.1.2. Granular Activated Carbon (GAC)
- 12.1.3. Extruded or Pelletized Activated Carbon
- 12.2. Market Analysis, Insights and Forecast - by Application
- 12.2.1. Gas Purification
- 12.2.2. Water Purification
- 12.2.3. Metal Extraction
- 12.2.4. Medicine
- 12.2.5. Other Applications
- 12.1. Market Analysis, Insights and Forecast - by Type
- 13. Competitive Analysis
- 13.1. Company Profiles
- 13.1.1 Carbon Activated Corporation
- 13.1.1.1. Company Overview
- 13.1.1.2. Products
- 13.1.1.3. Company Financials
- 13.1.1.4. SWOT Analysis
- 13.1.2 Chemviron
- 13.1.2.1. Company Overview
- 13.1.2.2. Products
- 13.1.2.3. Company Financials
- 13.1.2.4. SWOT Analysis
- 13.1.3 Kuraray Co Ltd
- 13.1.3.1. Company Overview
- 13.1.3.2. Products
- 13.1.3.3. Company Financials
- 13.1.3.4. SWOT Analysis
- 13.1.4 CPL Activated Carbons
- 13.1.4.1. Company Overview
- 13.1.4.2. Products
- 13.1.4.3. Company Financials
- 13.1.4.4. SWOT Analysis
- 13.1.5 Jacobi Carbons Group (Osaka Gas Chemicals Co Ltd)
- 13.1.5.1. Company Overview
- 13.1.5.2. Products
- 13.1.5.3. Company Financials
- 13.1.5.4. SWOT Analysis
- 13.1.6 Kureha Corporation
- 13.1.6.1. Company Overview
- 13.1.6.2. Products
- 13.1.6.3. Company Financials
- 13.1.6.4. SWOT Analysis
- 13.1.7 Ingevity
- 13.1.7.1. Company Overview
- 13.1.7.2. Products
- 13.1.7.3. Company Financials
- 13.1.7.4. SWOT Analysis
- 13.1.8 CarboTech
- 13.1.8.1. Company Overview
- 13.1.8.2. Products
- 13.1.8.3. Company Financials
- 13.1.8.4. SWOT Analysis
- 13.1.9 Puragen Activated Carbons
- 13.1.9.1. Company Overview
- 13.1.9.2. Products
- 13.1.9.3. Company Financials
- 13.1.9.4. SWOT Analysis
- 13.1.10 Donau Chemie AG
- 13.1.10.1. Company Overview
- 13.1.10.2. Products
- 13.1.10.3. Company Financials
- 13.1.10.4. SWOT Analysis
- 13.1.11 Albemarle Corporation
- 13.1.11.1. Company Overview
- 13.1.11.2. Products
- 13.1.11.3. Company Financials
- 13.1.11.4. SWOT Analysis
- 13.1.1 Carbon Activated Corporation
- 13.2. Market Entropy
- 13.2.1 Company's Key Areas Served
- 13.2.2 Recent Developments
- 13.3. Company Market Share Analysis 2025
- 13.3.1 Top 5 Companies Market Share Analysis
- 13.3.2 Top 3 Companies Market Share Analysis
- 13.4. List of Potential Customers
- 14. Research Methodology
List of Figures
- Figure 1: Europe Activated Carbon Industry Revenue Breakdown (Million, %) by Product 2025 & 2033
- Figure 2: Europe Activated Carbon Industry Share (%) by Company 2025
List of Tables
- Table 1: Europe Activated Carbon Industry Revenue Million Forecast, by Type 2020 & 2033
- Table 2: Europe Activated Carbon Industry Volume K Tons Forecast, by Type 2020 & 2033
- Table 3: Europe Activated Carbon Industry Revenue Million Forecast, by Application 2020 & 2033
- Table 4: Europe Activated Carbon Industry Volume K Tons Forecast, by Application 2020 & 2033
- Table 5: Europe Activated Carbon Industry Revenue Million Forecast, by Region 2020 & 2033
- Table 6: Europe Activated Carbon Industry Volume K Tons Forecast, by Region 2020 & 2033
- Table 7: Europe Activated Carbon Industry Revenue Million Forecast, by Type 2020 & 2033
- Table 8: Europe Activated Carbon Industry Volume K Tons Forecast, by Type 2020 & 2033
- Table 9: Europe Activated Carbon Industry Revenue Million Forecast, by Application 2020 & 2033
- Table 10: Europe Activated Carbon Industry Volume K Tons Forecast, by Application 2020 & 2033
- Table 11: Europe Activated Carbon Industry Revenue Million Forecast, by Country 2020 & 2033
- Table 12: Europe Activated Carbon Industry Volume K Tons Forecast, by Country 2020 & 2033
- Table 13: Europe Activated Carbon Industry Revenue Million Forecast, by Type 2020 & 2033
- Table 14: Europe Activated Carbon Industry Volume K Tons Forecast, by Type 2020 & 2033
- Table 15: Europe Activated Carbon Industry Revenue Million Forecast, by Application 2020 & 2033
- Table 16: Europe Activated Carbon Industry Volume K Tons Forecast, by Application 2020 & 2033
- Table 17: Europe Activated Carbon Industry Revenue Million Forecast, by Country 2020 & 2033
- Table 18: Europe Activated Carbon Industry Volume K Tons Forecast, by Country 2020 & 2033
- Table 19: Europe Activated Carbon Industry Revenue Million Forecast, by Type 2020 & 2033
- Table 20: Europe Activated Carbon Industry Volume K Tons Forecast, by Type 2020 & 2033
- Table 21: Europe Activated Carbon Industry Revenue Million Forecast, by Application 2020 & 2033
- Table 22: Europe Activated Carbon Industry Volume K Tons Forecast, by Application 2020 & 2033
- Table 23: Europe Activated Carbon Industry Revenue Million Forecast, by Country 2020 & 2033
- Table 24: Europe Activated Carbon Industry Volume K Tons Forecast, by Country 2020 & 2033
- Table 25: Europe Activated Carbon Industry Revenue Million Forecast, by Type 2020 & 2033
- Table 26: Europe Activated Carbon Industry Volume K Tons Forecast, by Type 2020 & 2033
- Table 27: Europe Activated Carbon Industry Revenue Million Forecast, by Application 2020 & 2033
- Table 28: Europe Activated Carbon Industry Volume K Tons Forecast, by Application 2020 & 2033
- Table 29: Europe Activated Carbon Industry Revenue Million Forecast, by Country 2020 & 2033
- Table 30: Europe Activated Carbon Industry Volume K Tons Forecast, by Country 2020 & 2033
- Table 31: Europe Activated Carbon Industry Revenue Million Forecast, by Type 2020 & 2033
- Table 32: Europe Activated Carbon Industry Volume K Tons Forecast, by Type 2020 & 2033
- Table 33: Europe Activated Carbon Industry Revenue Million Forecast, by Application 2020 & 2033
- Table 34: Europe Activated Carbon Industry Volume K Tons Forecast, by Application 2020 & 2033
- Table 35: Europe Activated Carbon Industry Revenue Million Forecast, by Country 2020 & 2033
- Table 36: Europe Activated Carbon Industry Volume K Tons Forecast, by Country 2020 & 2033
- Table 37: Europe Activated Carbon Industry Revenue Million Forecast, by Type 2020 & 2033
- Table 38: Europe Activated Carbon Industry Volume K Tons Forecast, by Type 2020 & 2033
- Table 39: Europe Activated Carbon Industry Revenue Million Forecast, by Application 2020 & 2033
- Table 40: Europe Activated Carbon Industry Volume K Tons Forecast, by Application 2020 & 2033
- Table 41: Europe Activated Carbon Industry Revenue Million Forecast, by Country 2020 & 2033
- Table 42: Europe Activated Carbon Industry Volume K Tons Forecast, by Country 2020 & 2033
Frequently Asked Questions
1. What is the projected Compound Annual Growth Rate (CAGR) of the Europe Activated Carbon Industry?
The projected CAGR is approximately 5.41%.
2. Which companies are prominent players in the Europe Activated Carbon Industry?
Key companies in the market include Carbon Activated Corporation, Chemviron, Kuraray Co Ltd, CPL Activated Carbons, Jacobi Carbons Group (Osaka Gas Chemicals Co Ltd), Kureha Corporation, Ingevity, CarboTech, Puragen Activated Carbons, Donau Chemie AG, Albemarle Corporation.
3. What are the main segments of the Europe Activated Carbon Industry?
The market segments include Type, Application.
4. Can you provide details about the market size?
The market size is estimated to be USD 0.98 Million as of 2022.
5. What are some drivers contributing to market growth?
Augmenting Prominence for Air Pollution Control; Surge in Demand from Water Treatment and Water Purification Applications; Other Drivers.
6. What are the notable trends driving market growth?
Medicine Segment to be the Fastest Growing Application.
7. Are there any restraints impacting market growth?
Availability of Substitute Products; Other Restraints.
8. Can you provide examples of recent developments in the market?
August 2022: Ingevity invested USD 60 million in a USD 170 million round to acquire an equity stake in Nexeon Limited. It is a strategic move to establish the company's presence in the electric vehicle (EV) market and increase opportunities to grow its activated carbon business.
9. What pricing options are available for accessing the report?
Pricing options include single-user, multi-user, and enterprise licenses priced at USD 3,950, USD 4,950, and USD 6,950 respectively.
10. Is the market size provided in terms of value or volume?
The market size is provided in terms of value, measured in Million and volume, measured in K Tons.
11. Are there any specific market keywords associated with the report?
Yes, the market keyword associated with the report is "Europe Activated Carbon Industry," which aids in identifying and referencing the specific market segment covered.
12. How do I determine which pricing option suits my needs best?
The pricing options vary based on user requirements and access needs. Individual users may opt for single-user licenses, while businesses requiring broader access may choose multi-user or enterprise licenses for cost-effective access to the report.
13. Are there any additional resources or data provided in the Europe Activated Carbon Industry report?
While the report offers comprehensive insights, it's advisable to review the specific contents or supplementary materials provided to ascertain if additional resources or data are available.
14. How can I stay updated on further developments or reports in the Europe Activated Carbon Industry?
To stay informed about further developments, trends, and reports in the Europe Activated Carbon Industry, consider subscribing to industry newsletters, following relevant companies and organizations, or regularly checking reputable industry news sources and publications.
Methodology
Step 1 - Identification of Relevant Samples Size from Population Database


Step 2 - Approaches for Defining Global Market Size (Value, Volume* & Price*)

Note*: In applicable scenarios
Step 3 - Data Sources
Primary Research
- Web Analytics
- Survey Reports
- Research Institute
- Latest Research Reports
- Opinion Leaders
Secondary Research
- Annual Reports
- White Paper
- Latest Press Release
- Industry Association
- Paid Database
- Investor Presentations

Step 4 - Data Triangulation
Involves using different sources of information in order to increase the validity of a study
These sources are likely to be stakeholders in a program - participants, other researchers, program staff, other community members, and so on.
Then we put all data in single framework & apply various statistical tools to find out the dynamic on the market.
During the analysis stage, feedback from the stakeholder groups would be compared to determine areas of agreement as well as areas of divergence