

Key Insights
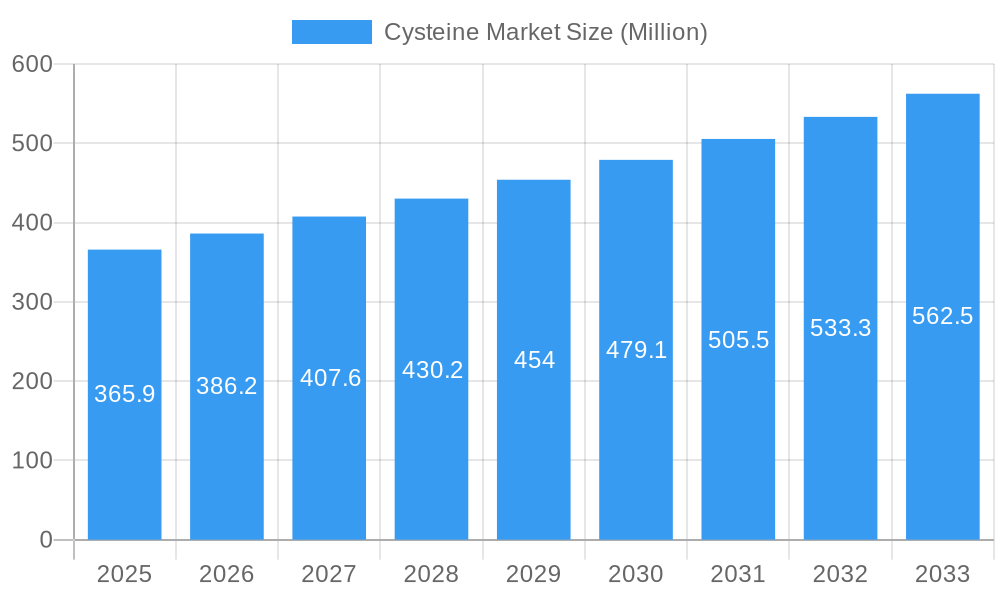
The global cysteine market, valued at $365.9 million in 2025, is projected to experience robust growth, driven by a Compound Annual Growth Rate (CAGR) exceeding 5.00% from 2025 to 2033. This expansion is fueled by the increasing demand for cysteine across diverse sectors. The pharmaceutical industry's reliance on cysteine for insulin production and other therapeutic applications significantly contributes to market growth. Furthermore, the food and beverage industry utilizes cysteine as a flavor enhancer and conditioner, further bolstering demand. The animal feed industry's adoption of cysteine as a nutritional supplement represents another key growth driver. The natural production process segment is expected to maintain a considerable market share due to increasing consumer preference for natural ingredients. However, challenges remain, including fluctuations in raw material prices and stringent regulatory requirements impacting market expansion. The Asia-Pacific region, particularly China and India, is anticipated to dominate the market due to rapid industrialization, rising disposable incomes, and expanding pharmaceutical and food processing sectors. North America and Europe will also witness significant growth, driven by technological advancements and a focus on health and wellness. Competitive landscape analysis reveals key players like Ajinomoto Co Inc, Merck KGaA, and CJ CHEILJEDANG CORP actively engaging in research and development, strategic partnerships, and expansions to capitalize on emerging opportunities within this dynamic market.
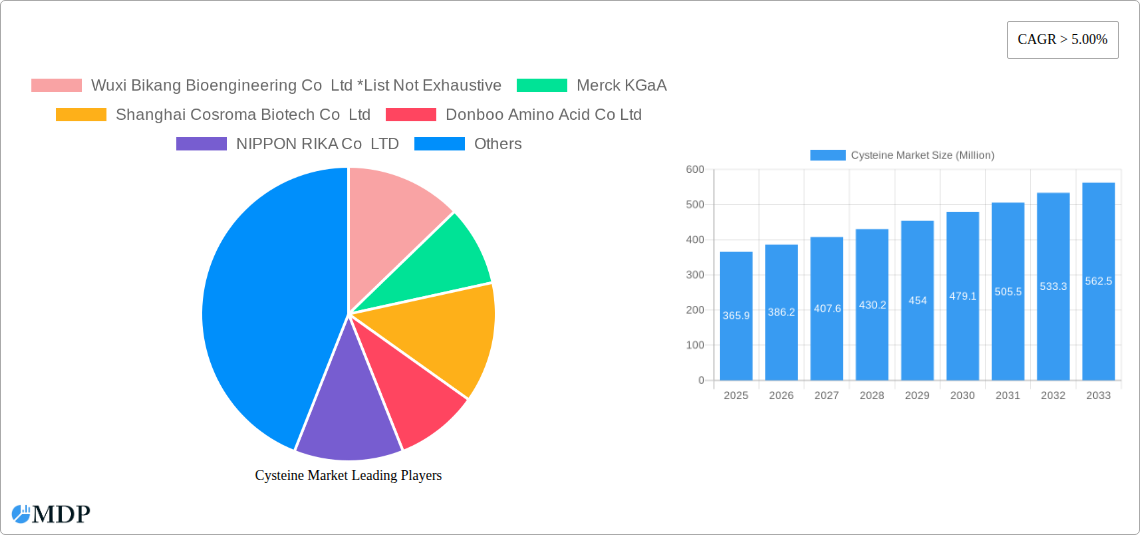
Cysteine Market Market Size (In Million)
The significant growth trajectory of the cysteine market is projected to continue throughout the forecast period. The increasing adoption of cysteine in various applications, coupled with advancements in production technologies, will further propel market expansion. However, sustainable sourcing of raw materials and the need to address potential environmental concerns associated with cysteine production will be crucial considerations for industry stakeholders. Furthermore, technological advancements in synthetic cysteine production could lead to changes in the market share of different production processes. Regional variations in growth rates are expected, with developing economies likely to experience faster expansion compared to mature markets. Companies are focusing on diversification, product innovation, and geographical expansion to maintain a competitive edge in this evolving market landscape. The focus on optimizing production processes for efficiency and sustainability will play a vital role in shaping the future growth trajectory of the cysteine market.
Cysteine Market Company Market Share
Cysteine Market Report: 2019-2033 - A Comprehensive Analysis
This comprehensive report provides an in-depth analysis of the global cysteine market from 2019 to 2033, offering invaluable insights for industry stakeholders. With a focus on market dynamics, trends, leading players, and future opportunities, this report is an essential resource for strategic decision-making. The study period covers 2019-2033, with 2025 as the base and estimated year. The forecast period spans 2025-2033, while the historical period encompasses 2019-2024. This report leverages rigorous research methodologies to provide actionable insights into this rapidly evolving market, segmented by production process (natural, synthetic), application (conditioner, flavor enhancer, reducing agent, production of human insulin, other applications (anti-aging agent)), and end-user industry (food, pharmaceutical, animal feed, other end-user industries (marine)). The report's findings are supported by quantitative data, revealing market size, growth rates, and key trends. Major players like Wuxi Bikang Bioengineering Co Ltd, Merck KGaA, Shanghai Cosroma Biotech Co Ltd, Donboo Amino Acid Co Ltd, NIPPON RIKA Co LTD, Ajinomoto Co Inc, Wuhan Grand Hoyo Co Ltd, Shine Star (Hubei) Biological Engineering Co Ltd, Wacker Chemie AG, and CJ CHEILJEDANG CORP are profiled in detail.
Cysteine Market Market Dynamics & Concentration
The global cysteine market exhibits a moderately concentrated structure, with a handful of major players commanding significant market share. Innovation is a key driver, with ongoing efforts to improve production efficiency, explore novel applications, and enhance product quality. Stringent regulatory frameworks related to food safety and pharmaceutical standards influence market dynamics. While no direct substitutes for cysteine exist in all its applications, alternatives are employed in specific instances, depending on the final product. End-user trends, particularly in the food and pharmaceutical sectors, significantly impact cysteine demand. Mergers and acquisitions (M&A) activity has been moderate, with key players strategically expanding their market presence. For example, in 2021, the Merck KGaA acquisition of Sigma-Aldrich impacted market dynamics. The total M&A deal count for the period 2019-2024 is estimated at xx. Market share distribution is uneven, with top 5 players collectively holding an estimated xx% share in 2024, indicating a moderately concentrated yet dynamic market landscape.
Cysteine Market Industry Trends & Analysis
The cysteine market is experiencing steady growth, driven by increasing demand from various end-use industries. The Compound Annual Growth Rate (CAGR) during the historical period (2019-2024) was approximately xx%, and is projected to reach xx% during the forecast period (2025-2033). Technological advancements in fermentation and synthetic production methods are enhancing efficiency and reducing costs, pushing down the price per unit, consequently stimulating market penetration. Consumer preferences for natural and sustainable products are influencing the adoption of naturally produced cysteine. Intense competition among key players is fostering innovation and price optimization. Market penetration is highest in the food and pharmaceutical sectors, with growth opportunities emerging in the animal feed and marine industries. The market size in 2024 was estimated at xx Million, and it is predicted to reach xx Million by 2033.
Leading Markets & Segments in Cysteine Market
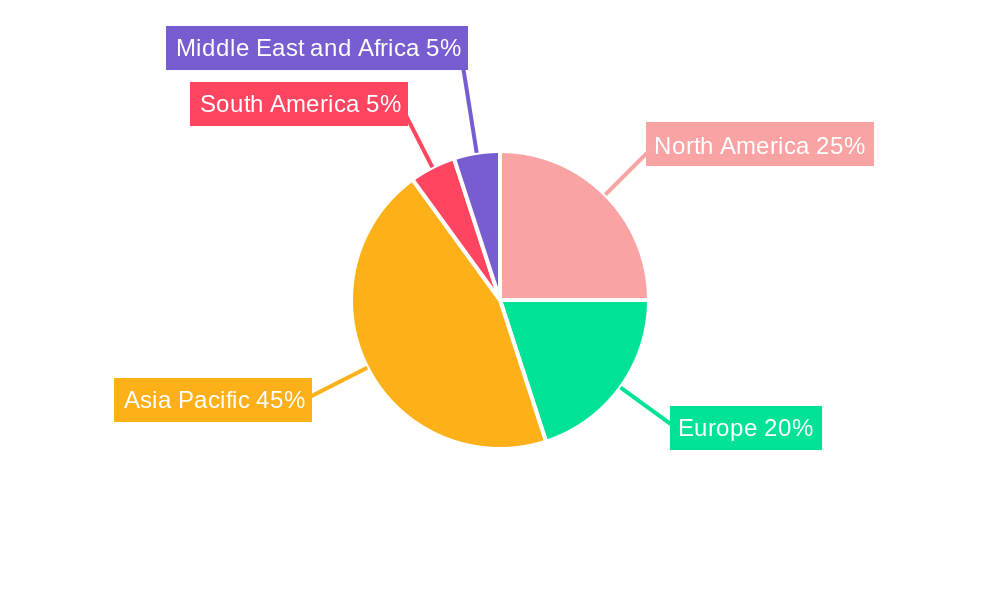
The global cysteine market is currently experiencing robust growth, with the Asia-Pacific region standing out as the dominant force. This supremacy is largely attributed to the burgeoning food and pharmaceutical industries in key economies like China and India. Favorable economic policies, well-developed infrastructure, and a rapidly expanding population are significant catalysts for this regional leadership. Within the application landscape, the flavor enhancer segment commands the largest market share, driven by the escalating demand for processed and convenience foods. The pharmaceutical sector also represents a substantial consumer of cysteine, primarily for its critical role in the synthesis of essential medicines, most notably human insulin.
-
Key Drivers for Asia-Pacific Dominance:
- Sustained rapid economic expansion
- Significant growth in food processing and pharmaceutical manufacturing
- Continuous population increase and urbanization
- Rising disposable incomes and changing dietary habits
-
Key Drivers for Flavor Enhancer Segment Dominance:
- Increasing global consumption of processed and convenience foods
- Growing consumer preference for flavorful and convenient food options
- Expansion and modernization of the global food processing industry
Further segmentation reveals that the synthetic production process currently holds a more substantial market share, owing to its inherent cost-effectiveness and scalability. However, the natural production segment is witnessing a discernible uptick in interest and adoption, mirroring a broader global consumer trend towards natural and sustainably sourced ingredients across various product categories.
Cysteine Market Product Developments
Recent product developments focus on improving the efficiency and sustainability of cysteine production. Companies are investing in advanced fermentation technologies and exploring innovative extraction methods to enhance yield and reduce environmental impact. New applications of cysteine are also being explored, particularly in the cosmetics and anti-aging industries, broadening market reach. The focus on improved purity and consistency is also crucial, reflecting the stringent quality requirements of the pharmaceutical and food sectors. This ongoing development reflects a strategic imperative of adapting to the dynamic demands of various industries while addressing evolving market needs.
Key Drivers of Cysteine Market Growth
The cysteine market's upward trajectory is underpinned by a confluence of influential factors. Ongoing technological advancements in production methodologies are leading to enhanced efficiency and reduced manufacturing costs. The ever-expanding food and pharmaceutical industries continue to generate substantial and consistent demand for cysteine, recognizing its indispensable role as a vital ingredient. Furthermore, supportive regulatory frameworks established in numerous countries are fostering a conducive environment for industry expansion. A prime example of this growth potential is the strategic expansion initiatives undertaken by prominent players like Wacker Chemie AG in key markets, underscoring the significant opportunities present.
Challenges in the Cysteine Market Market
The cysteine market faces challenges including fluctuating raw material prices, potentially impacting production costs. Supply chain disruptions can lead to production delays and shortages. Intense competition among existing players and the emergence of new entrants put pressure on pricing and margins. Stringent regulatory requirements for food and pharmaceutical applications can increase compliance costs. These challenges necessitate robust strategies for raw material sourcing, supply chain management, and regulatory compliance. The overall impact of these challenges on market growth is predicted to be limited to a xx% reduction in CAGR between 2025-2033.
Emerging Opportunities in Cysteine Market
The cysteine market is ripe with emerging opportunities, particularly in the exploration of novel applications. The nutraceutical and cosmeceutical sectors present significant untapped potential, where cysteine's beneficial properties can be leveraged. Strategic alliances and collaborative ventures among market participants can serve as powerful accelerators for innovation and facilitate smoother market penetration. Geographic expansion into developing economies, which often exhibit strong growth potential and increasing consumer demand, represents another avenue for substantial market capture. Furthermore, advancements in biotechnology and genetic engineering hold the key to unlocking more cost-effective and environmentally sustainable methods for cysteine production.
Leading Players in the Cysteine Market Sector
- Wuxi Bikang Bioengineering Co Ltd
- Merck KGaA
- Shanghai Cosroma Biotech Co Ltd
- Donboo Amino Acid Co Ltd
- NIPPON RIKA Co LTD
- Ajinomoto Co Inc
- Wuhan Grand Hoyo Co Ltd
- Shine Star (Hubei) Biological Engineering Co Ltd
- Wacker Chemie AG
- CJ CHEILJEDANG CORP
Key Milestones in Cysteine Market Industry
- 2020, October: Ajinomoto Co. Inc. develops a new fermentation process for cysteine production, reducing production costs and environmental impact.
- 2021, November: Merck KGaA acquires Sigma-Aldrich, a leading supplier of cysteine.
- 2022, June: Wacker Chemie AG announces plans to expand its cysteine production capacity in China.
Strategic Outlook for Cysteine Market Market
The cysteine market is poised for continued growth, driven by technological innovation, expanding applications, and increasing demand from key end-user industries. Strategic partnerships, investments in R&D, and expansion into emerging markets will be critical for success. Companies focusing on sustainable and cost-effective production methods will be well-positioned to capitalize on the long-term growth potential of this dynamic market. The focus on both improving the sustainability and economic feasibility of cysteine production will ultimately drive both production and consumption growth in the coming decade.
Cysteine Market Segmentation
-
1. Production Process
- 1.1. Natural
- 1.2. Synthetic
-
2. Application
- 2.1. Conditioner
- 2.2. Flavor Enhancer
- 2.3. Reducing Agent
- 2.4. Production of Human Insulin
- 2.5. Other Applications (Anti-aging Agent)
-
3. End-user Industry
- 3.1. Food
- 3.2. Pharmaceutical
- 3.3. Animal Feed
- 3.4. Other End-user Industries (Marine)
Cysteine Market Segmentation By Geography
-
1. Asia Pacific
- 1.1. China
- 1.2. India
- 1.3. Japan
- 1.4. South Korea
- 1.5. ASEAN Countries
- 1.6. Rest of Asia Pacific
-
2. North America
- 2.1. United States
- 2.2. Canada
- 2.3. Mexico
-
3. Europe
- 3.1. Germany
- 3.2. United Kingdom
- 3.3. France
- 3.4. Italy
- 3.5. Russia
- 3.6. Nordic Countries
- 3.7. Rest of Europe
-
4. South America
- 4.1. Brazil
- 4.2. Argentina
- 4.3. Rest of South America
-
5. Middle East and Africa
- 5.1. GCC Countries
- 5.2. South Africa
- 5.3. Rest of Middle East and Africa
Cysteine Market Regional Market Share
Geographic Coverage of Cysteine Market
Cysteine Market REPORT HIGHLIGHTS
| Aspects | Details |
|---|---|
| Study Period | 2020-2034 |
| Base Year | 2025 |
| Estimated Year | 2026 |
| Forecast Period | 2026-2034 |
| Historical Period | 2020-2025 |
| Growth Rate | CAGR of > 5.00% from 2020-2034 |
| Segmentation |
|
Table of Contents
- 1. Introduction
- 1.1. Research Scope
- 1.2. Market Segmentation
- 1.3. Research Objective
- 1.4. Definitions and Assumptions
- 2. Executive Summary
- 2.1. Market Snapshot
- 3. Market Dynamics
- 3.1. Market Drivers
- 3.2. Market Restrains
- 3.3. Market Trends
- 3.4. Market Opportunities
- 4. Market Factor Analysis
- 4.1. Porters Five Forces
- 4.1.1. Bargaining Power of Suppliers
- 4.1.2. Bargaining Power of Buyers
- 4.1.3. Threat of New Entrants
- 4.1.4. Threat of Substitutes
- 4.1.5. Competitive Rivalry
- 4.2. PESTEL analysis
- 4.3. BCG Analysis
- 4.3.1. Stars (High Growth, High Market Share)
- 4.3.2. Cash Cows (Low Growth, High Market Share)
- 4.3.3. Question Mark (High Growth, Low Market Share)
- 4.3.4. Dogs (Low Growth, Low Market Share)
- 4.4. Ansoff Matrix Analysis
- 4.5. Supply Chain Analysis
- 4.6. Regulatory Landscape
- 4.7. Current Market Potential and Opportunity Assessment (TAM–SAM–SOM Framework)
- 4.8. MDP Analyst Note
- 4.1. Porters Five Forces
- 5. Market Analysis, Insights and Forecast 2021-2033
- 5.1. Market Analysis, Insights and Forecast - by Production Process
- 5.1.1. Natural
- 5.1.2. Synthetic
- 5.2. Market Analysis, Insights and Forecast - by Application
- 5.2.1. Conditioner
- 5.2.2. Flavor Enhancer
- 5.2.3. Reducing Agent
- 5.2.4. Production of Human Insulin
- 5.2.5. Other Applications (Anti-aging Agent)
- 5.3. Market Analysis, Insights and Forecast - by End-user Industry
- 5.3.1. Food
- 5.3.2. Pharmaceutical
- 5.3.3. Animal Feed
- 5.3.4. Other End-user Industries (Marine)
- 5.4. Market Analysis, Insights and Forecast - by Region
- 5.4.1. Asia Pacific
- 5.4.2. North America
- 5.4.3. Europe
- 5.4.4. South America
- 5.4.5. Middle East and Africa
- 5.1. Market Analysis, Insights and Forecast - by Production Process
- 6. Global Cysteine Market Analysis, Insights and Forecast, 2021-2033
- 6.1. Market Analysis, Insights and Forecast - by Production Process
- 6.1.1. Natural
- 6.1.2. Synthetic
- 6.2. Market Analysis, Insights and Forecast - by Application
- 6.2.1. Conditioner
- 6.2.2. Flavor Enhancer
- 6.2.3. Reducing Agent
- 6.2.4. Production of Human Insulin
- 6.2.5. Other Applications (Anti-aging Agent)
- 6.3. Market Analysis, Insights and Forecast - by End-user Industry
- 6.3.1. Food
- 6.3.2. Pharmaceutical
- 6.3.3. Animal Feed
- 6.3.4. Other End-user Industries (Marine)
- 6.1. Market Analysis, Insights and Forecast - by Production Process
- 7. Asia Pacific Cysteine Market Analysis, Insights and Forecast, 2020-2032
- 7.1. Market Analysis, Insights and Forecast - by Production Process
- 7.1.1. Natural
- 7.1.2. Synthetic
- 7.2. Market Analysis, Insights and Forecast - by Application
- 7.2.1. Conditioner
- 7.2.2. Flavor Enhancer
- 7.2.3. Reducing Agent
- 7.2.4. Production of Human Insulin
- 7.2.5. Other Applications (Anti-aging Agent)
- 7.3. Market Analysis, Insights and Forecast - by End-user Industry
- 7.3.1. Food
- 7.3.2. Pharmaceutical
- 7.3.3. Animal Feed
- 7.3.4. Other End-user Industries (Marine)
- 7.1. Market Analysis, Insights and Forecast - by Production Process
- 8. North America Cysteine Market Analysis, Insights and Forecast, 2020-2032
- 8.1. Market Analysis, Insights and Forecast - by Production Process
- 8.1.1. Natural
- 8.1.2. Synthetic
- 8.2. Market Analysis, Insights and Forecast - by Application
- 8.2.1. Conditioner
- 8.2.2. Flavor Enhancer
- 8.2.3. Reducing Agent
- 8.2.4. Production of Human Insulin
- 8.2.5. Other Applications (Anti-aging Agent)
- 8.3. Market Analysis, Insights and Forecast - by End-user Industry
- 8.3.1. Food
- 8.3.2. Pharmaceutical
- 8.3.3. Animal Feed
- 8.3.4. Other End-user Industries (Marine)
- 8.1. Market Analysis, Insights and Forecast - by Production Process
- 9. Europe Cysteine Market Analysis, Insights and Forecast, 2020-2032
- 9.1. Market Analysis, Insights and Forecast - by Production Process
- 9.1.1. Natural
- 9.1.2. Synthetic
- 9.2. Market Analysis, Insights and Forecast - by Application
- 9.2.1. Conditioner
- 9.2.2. Flavor Enhancer
- 9.2.3. Reducing Agent
- 9.2.4. Production of Human Insulin
- 9.2.5. Other Applications (Anti-aging Agent)
- 9.3. Market Analysis, Insights and Forecast - by End-user Industry
- 9.3.1. Food
- 9.3.2. Pharmaceutical
- 9.3.3. Animal Feed
- 9.3.4. Other End-user Industries (Marine)
- 9.1. Market Analysis, Insights and Forecast - by Production Process
- 10. South America Cysteine Market Analysis, Insights and Forecast, 2020-2032
- 10.1. Market Analysis, Insights and Forecast - by Production Process
- 10.1.1. Natural
- 10.1.2. Synthetic
- 10.2. Market Analysis, Insights and Forecast - by Application
- 10.2.1. Conditioner
- 10.2.2. Flavor Enhancer
- 10.2.3. Reducing Agent
- 10.2.4. Production of Human Insulin
- 10.2.5. Other Applications (Anti-aging Agent)
- 10.3. Market Analysis, Insights and Forecast - by End-user Industry
- 10.3.1. Food
- 10.3.2. Pharmaceutical
- 10.3.3. Animal Feed
- 10.3.4. Other End-user Industries (Marine)
- 10.1. Market Analysis, Insights and Forecast - by Production Process
- 11. Middle East and Africa Cysteine Market Analysis, Insights and Forecast, 2020-2032
- 11.1. Market Analysis, Insights and Forecast - by Production Process
- 11.1.1. Natural
- 11.1.2. Synthetic
- 11.2. Market Analysis, Insights and Forecast - by Application
- 11.2.1. Conditioner
- 11.2.2. Flavor Enhancer
- 11.2.3. Reducing Agent
- 11.2.4. Production of Human Insulin
- 11.2.5. Other Applications (Anti-aging Agent)
- 11.3. Market Analysis, Insights and Forecast - by End-user Industry
- 11.3.1. Food
- 11.3.2. Pharmaceutical
- 11.3.3. Animal Feed
- 11.3.4. Other End-user Industries (Marine)
- 11.1. Market Analysis, Insights and Forecast - by Production Process
- 12. Competitive Analysis
- 12.1. Company Profiles
- 12.1.1 Wuxi Bikang Bioengineering Co Ltd *List Not Exhaustive
- 12.1.1.1. Company Overview
- 12.1.1.2. Products
- 12.1.1.3. Company Financials
- 12.1.1.4. SWOT Analysis
- 12.1.2 Merck KGaA
- 12.1.2.1. Company Overview
- 12.1.2.2. Products
- 12.1.2.3. Company Financials
- 12.1.2.4. SWOT Analysis
- 12.1.3 Shanghai Cosroma Biotech Co Ltd
- 12.1.3.1. Company Overview
- 12.1.3.2. Products
- 12.1.3.3. Company Financials
- 12.1.3.4. SWOT Analysis
- 12.1.4 Donboo Amino Acid Co Ltd
- 12.1.4.1. Company Overview
- 12.1.4.2. Products
- 12.1.4.3. Company Financials
- 12.1.4.4. SWOT Analysis
- 12.1.5 NIPPON RIKA Co LTD
- 12.1.5.1. Company Overview
- 12.1.5.2. Products
- 12.1.5.3. Company Financials
- 12.1.5.4. SWOT Analysis
- 12.1.6 Ajinomoto Co Inc
- 12.1.6.1. Company Overview
- 12.1.6.2. Products
- 12.1.6.3. Company Financials
- 12.1.6.4. SWOT Analysis
- 12.1.7 Wuhan Grand Hoyo Co Ltd
- 12.1.7.1. Company Overview
- 12.1.7.2. Products
- 12.1.7.3. Company Financials
- 12.1.7.4. SWOT Analysis
- 12.1.8 Shine Star (Hubei) Biological Engineering Co Ltd
- 12.1.8.1. Company Overview
- 12.1.8.2. Products
- 12.1.8.3. Company Financials
- 12.1.8.4. SWOT Analysis
- 12.1.9 Wacker Chemie AG
- 12.1.9.1. Company Overview
- 12.1.9.2. Products
- 12.1.9.3. Company Financials
- 12.1.9.4. SWOT Analysis
- 12.1.10 CJ CHEILJEDANG CORP
- 12.1.10.1. Company Overview
- 12.1.10.2. Products
- 12.1.10.3. Company Financials
- 12.1.10.4. SWOT Analysis
- 12.1.1 Wuxi Bikang Bioengineering Co Ltd *List Not Exhaustive
- 12.2. Market Entropy
- 12.2.1 Company's Key Areas Served
- 12.2.2 Recent Developments
- 12.3. Company Market Share Analysis 2025
- 12.3.1 Top 5 Companies Market Share Analysis
- 12.3.2 Top 3 Companies Market Share Analysis
- 12.4. List of Potential Customers
- 13. Research Methodology
List of Figures
- Figure 1: Global Cysteine Market Revenue Breakdown (Million, %) by Region 2025 & 2033
- Figure 2: Global Cysteine Market Volume Breakdown (kilotons, %) by Region 2025 & 2033
- Figure 3: Asia Pacific Cysteine Market Revenue (Million), by Production Process 2025 & 2033
- Figure 4: Asia Pacific Cysteine Market Volume (kilotons), by Production Process 2025 & 2033
- Figure 5: Asia Pacific Cysteine Market Revenue Share (%), by Production Process 2025 & 2033
- Figure 6: Asia Pacific Cysteine Market Volume Share (%), by Production Process 2025 & 2033
- Figure 7: Asia Pacific Cysteine Market Revenue (Million), by Application 2025 & 2033
- Figure 8: Asia Pacific Cysteine Market Volume (kilotons), by Application 2025 & 2033
- Figure 9: Asia Pacific Cysteine Market Revenue Share (%), by Application 2025 & 2033
- Figure 10: Asia Pacific Cysteine Market Volume Share (%), by Application 2025 & 2033
- Figure 11: Asia Pacific Cysteine Market Revenue (Million), by End-user Industry 2025 & 2033
- Figure 12: Asia Pacific Cysteine Market Volume (kilotons), by End-user Industry 2025 & 2033
- Figure 13: Asia Pacific Cysteine Market Revenue Share (%), by End-user Industry 2025 & 2033
- Figure 14: Asia Pacific Cysteine Market Volume Share (%), by End-user Industry 2025 & 2033
- Figure 15: Asia Pacific Cysteine Market Revenue (Million), by Country 2025 & 2033
- Figure 16: Asia Pacific Cysteine Market Volume (kilotons), by Country 2025 & 2033
- Figure 17: Asia Pacific Cysteine Market Revenue Share (%), by Country 2025 & 2033
- Figure 18: Asia Pacific Cysteine Market Volume Share (%), by Country 2025 & 2033
- Figure 19: North America Cysteine Market Revenue (Million), by Production Process 2025 & 2033
- Figure 20: North America Cysteine Market Volume (kilotons), by Production Process 2025 & 2033
- Figure 21: North America Cysteine Market Revenue Share (%), by Production Process 2025 & 2033
- Figure 22: North America Cysteine Market Volume Share (%), by Production Process 2025 & 2033
- Figure 23: North America Cysteine Market Revenue (Million), by Application 2025 & 2033
- Figure 24: North America Cysteine Market Volume (kilotons), by Application 2025 & 2033
- Figure 25: North America Cysteine Market Revenue Share (%), by Application 2025 & 2033
- Figure 26: North America Cysteine Market Volume Share (%), by Application 2025 & 2033
- Figure 27: North America Cysteine Market Revenue (Million), by End-user Industry 2025 & 2033
- Figure 28: North America Cysteine Market Volume (kilotons), by End-user Industry 2025 & 2033
- Figure 29: North America Cysteine Market Revenue Share (%), by End-user Industry 2025 & 2033
- Figure 30: North America Cysteine Market Volume Share (%), by End-user Industry 2025 & 2033
- Figure 31: North America Cysteine Market Revenue (Million), by Country 2025 & 2033
- Figure 32: North America Cysteine Market Volume (kilotons), by Country 2025 & 2033
- Figure 33: North America Cysteine Market Revenue Share (%), by Country 2025 & 2033
- Figure 34: North America Cysteine Market Volume Share (%), by Country 2025 & 2033
- Figure 35: Europe Cysteine Market Revenue (Million), by Production Process 2025 & 2033
- Figure 36: Europe Cysteine Market Volume (kilotons), by Production Process 2025 & 2033
- Figure 37: Europe Cysteine Market Revenue Share (%), by Production Process 2025 & 2033
- Figure 38: Europe Cysteine Market Volume Share (%), by Production Process 2025 & 2033
- Figure 39: Europe Cysteine Market Revenue (Million), by Application 2025 & 2033
- Figure 40: Europe Cysteine Market Volume (kilotons), by Application 2025 & 2033
- Figure 41: Europe Cysteine Market Revenue Share (%), by Application 2025 & 2033
- Figure 42: Europe Cysteine Market Volume Share (%), by Application 2025 & 2033
- Figure 43: Europe Cysteine Market Revenue (Million), by End-user Industry 2025 & 2033
- Figure 44: Europe Cysteine Market Volume (kilotons), by End-user Industry 2025 & 2033
- Figure 45: Europe Cysteine Market Revenue Share (%), by End-user Industry 2025 & 2033
- Figure 46: Europe Cysteine Market Volume Share (%), by End-user Industry 2025 & 2033
- Figure 47: Europe Cysteine Market Revenue (Million), by Country 2025 & 2033
- Figure 48: Europe Cysteine Market Volume (kilotons), by Country 2025 & 2033
- Figure 49: Europe Cysteine Market Revenue Share (%), by Country 2025 & 2033
- Figure 50: Europe Cysteine Market Volume Share (%), by Country 2025 & 2033
- Figure 51: South America Cysteine Market Revenue (Million), by Production Process 2025 & 2033
- Figure 52: South America Cysteine Market Volume (kilotons), by Production Process 2025 & 2033
- Figure 53: South America Cysteine Market Revenue Share (%), by Production Process 2025 & 2033
- Figure 54: South America Cysteine Market Volume Share (%), by Production Process 2025 & 2033
- Figure 55: South America Cysteine Market Revenue (Million), by Application 2025 & 2033
- Figure 56: South America Cysteine Market Volume (kilotons), by Application 2025 & 2033
- Figure 57: South America Cysteine Market Revenue Share (%), by Application 2025 & 2033
- Figure 58: South America Cysteine Market Volume Share (%), by Application 2025 & 2033
- Figure 59: South America Cysteine Market Revenue (Million), by End-user Industry 2025 & 2033
- Figure 60: South America Cysteine Market Volume (kilotons), by End-user Industry 2025 & 2033
- Figure 61: South America Cysteine Market Revenue Share (%), by End-user Industry 2025 & 2033
- Figure 62: South America Cysteine Market Volume Share (%), by End-user Industry 2025 & 2033
- Figure 63: South America Cysteine Market Revenue (Million), by Country 2025 & 2033
- Figure 64: South America Cysteine Market Volume (kilotons), by Country 2025 & 2033
- Figure 65: South America Cysteine Market Revenue Share (%), by Country 2025 & 2033
- Figure 66: South America Cysteine Market Volume Share (%), by Country 2025 & 2033
- Figure 67: Middle East and Africa Cysteine Market Revenue (Million), by Production Process 2025 & 2033
- Figure 68: Middle East and Africa Cysteine Market Volume (kilotons), by Production Process 2025 & 2033
- Figure 69: Middle East and Africa Cysteine Market Revenue Share (%), by Production Process 2025 & 2033
- Figure 70: Middle East and Africa Cysteine Market Volume Share (%), by Production Process 2025 & 2033
- Figure 71: Middle East and Africa Cysteine Market Revenue (Million), by Application 2025 & 2033
- Figure 72: Middle East and Africa Cysteine Market Volume (kilotons), by Application 2025 & 2033
- Figure 73: Middle East and Africa Cysteine Market Revenue Share (%), by Application 2025 & 2033
- Figure 74: Middle East and Africa Cysteine Market Volume Share (%), by Application 2025 & 2033
- Figure 75: Middle East and Africa Cysteine Market Revenue (Million), by End-user Industry 2025 & 2033
- Figure 76: Middle East and Africa Cysteine Market Volume (kilotons), by End-user Industry 2025 & 2033
- Figure 77: Middle East and Africa Cysteine Market Revenue Share (%), by End-user Industry 2025 & 2033
- Figure 78: Middle East and Africa Cysteine Market Volume Share (%), by End-user Industry 2025 & 2033
- Figure 79: Middle East and Africa Cysteine Market Revenue (Million), by Country 2025 & 2033
- Figure 80: Middle East and Africa Cysteine Market Volume (kilotons), by Country 2025 & 2033
- Figure 81: Middle East and Africa Cysteine Market Revenue Share (%), by Country 2025 & 2033
- Figure 82: Middle East and Africa Cysteine Market Volume Share (%), by Country 2025 & 2033
List of Tables
- Table 1: Global Cysteine Market Revenue Million Forecast, by Production Process 2020 & 2033
- Table 2: Global Cysteine Market Volume kilotons Forecast, by Production Process 2020 & 2033
- Table 3: Global Cysteine Market Revenue Million Forecast, by Application 2020 & 2033
- Table 4: Global Cysteine Market Volume kilotons Forecast, by Application 2020 & 2033
- Table 5: Global Cysteine Market Revenue Million Forecast, by End-user Industry 2020 & 2033
- Table 6: Global Cysteine Market Volume kilotons Forecast, by End-user Industry 2020 & 2033
- Table 7: Global Cysteine Market Revenue Million Forecast, by Region 2020 & 2033
- Table 8: Global Cysteine Market Volume kilotons Forecast, by Region 2020 & 2033
- Table 9: Global Cysteine Market Revenue Million Forecast, by Production Process 2020 & 2033
- Table 10: Global Cysteine Market Volume kilotons Forecast, by Production Process 2020 & 2033
- Table 11: Global Cysteine Market Revenue Million Forecast, by Application 2020 & 2033
- Table 12: Global Cysteine Market Volume kilotons Forecast, by Application 2020 & 2033
- Table 13: Global Cysteine Market Revenue Million Forecast, by End-user Industry 2020 & 2033
- Table 14: Global Cysteine Market Volume kilotons Forecast, by End-user Industry 2020 & 2033
- Table 15: Global Cysteine Market Revenue Million Forecast, by Country 2020 & 2033
- Table 16: Global Cysteine Market Volume kilotons Forecast, by Country 2020 & 2033
- Table 17: China Cysteine Market Revenue (Million) Forecast, by Application 2020 & 2033
- Table 18: China Cysteine Market Volume (kilotons) Forecast, by Application 2020 & 2033
- Table 19: India Cysteine Market Revenue (Million) Forecast, by Application 2020 & 2033
- Table 20: India Cysteine Market Volume (kilotons) Forecast, by Application 2020 & 2033
- Table 21: Japan Cysteine Market Revenue (Million) Forecast, by Application 2020 & 2033
- Table 22: Japan Cysteine Market Volume (kilotons) Forecast, by Application 2020 & 2033
- Table 23: South Korea Cysteine Market Revenue (Million) Forecast, by Application 2020 & 2033
- Table 24: South Korea Cysteine Market Volume (kilotons) Forecast, by Application 2020 & 2033
- Table 25: ASEAN Countries Cysteine Market Revenue (Million) Forecast, by Application 2020 & 2033
- Table 26: ASEAN Countries Cysteine Market Volume (kilotons) Forecast, by Application 2020 & 2033
- Table 27: Rest of Asia Pacific Cysteine Market Revenue (Million) Forecast, by Application 2020 & 2033
- Table 28: Rest of Asia Pacific Cysteine Market Volume (kilotons) Forecast, by Application 2020 & 2033
- Table 29: Global Cysteine Market Revenue Million Forecast, by Production Process 2020 & 2033
- Table 30: Global Cysteine Market Volume kilotons Forecast, by Production Process 2020 & 2033
- Table 31: Global Cysteine Market Revenue Million Forecast, by Application 2020 & 2033
- Table 32: Global Cysteine Market Volume kilotons Forecast, by Application 2020 & 2033
- Table 33: Global Cysteine Market Revenue Million Forecast, by End-user Industry 2020 & 2033
- Table 34: Global Cysteine Market Volume kilotons Forecast, by End-user Industry 2020 & 2033
- Table 35: Global Cysteine Market Revenue Million Forecast, by Country 2020 & 2033
- Table 36: Global Cysteine Market Volume kilotons Forecast, by Country 2020 & 2033
- Table 37: United States Cysteine Market Revenue (Million) Forecast, by Application 2020 & 2033
- Table 38: United States Cysteine Market Volume (kilotons) Forecast, by Application 2020 & 2033
- Table 39: Canada Cysteine Market Revenue (Million) Forecast, by Application 2020 & 2033
- Table 40: Canada Cysteine Market Volume (kilotons) Forecast, by Application 2020 & 2033
- Table 41: Mexico Cysteine Market Revenue (Million) Forecast, by Application 2020 & 2033
- Table 42: Mexico Cysteine Market Volume (kilotons) Forecast, by Application 2020 & 2033
- Table 43: Global Cysteine Market Revenue Million Forecast, by Production Process 2020 & 2033
- Table 44: Global Cysteine Market Volume kilotons Forecast, by Production Process 2020 & 2033
- Table 45: Global Cysteine Market Revenue Million Forecast, by Application 2020 & 2033
- Table 46: Global Cysteine Market Volume kilotons Forecast, by Application 2020 & 2033
- Table 47: Global Cysteine Market Revenue Million Forecast, by End-user Industry 2020 & 2033
- Table 48: Global Cysteine Market Volume kilotons Forecast, by End-user Industry 2020 & 2033
- Table 49: Global Cysteine Market Revenue Million Forecast, by Country 2020 & 2033
- Table 50: Global Cysteine Market Volume kilotons Forecast, by Country 2020 & 2033
- Table 51: Germany Cysteine Market Revenue (Million) Forecast, by Application 2020 & 2033
- Table 52: Germany Cysteine Market Volume (kilotons) Forecast, by Application 2020 & 2033
- Table 53: United Kingdom Cysteine Market Revenue (Million) Forecast, by Application 2020 & 2033
- Table 54: United Kingdom Cysteine Market Volume (kilotons) Forecast, by Application 2020 & 2033
- Table 55: France Cysteine Market Revenue (Million) Forecast, by Application 2020 & 2033
- Table 56: France Cysteine Market Volume (kilotons) Forecast, by Application 2020 & 2033
- Table 57: Italy Cysteine Market Revenue (Million) Forecast, by Application 2020 & 2033
- Table 58: Italy Cysteine Market Volume (kilotons) Forecast, by Application 2020 & 2033
- Table 59: Russia Cysteine Market Revenue (Million) Forecast, by Application 2020 & 2033
- Table 60: Russia Cysteine Market Volume (kilotons) Forecast, by Application 2020 & 2033
- Table 61: Nordic Countries Cysteine Market Revenue (Million) Forecast, by Application 2020 & 2033
- Table 62: Nordic Countries Cysteine Market Volume (kilotons) Forecast, by Application 2020 & 2033
- Table 63: Rest of Europe Cysteine Market Revenue (Million) Forecast, by Application 2020 & 2033
- Table 64: Rest of Europe Cysteine Market Volume (kilotons) Forecast, by Application 2020 & 2033
- Table 65: Global Cysteine Market Revenue Million Forecast, by Production Process 2020 & 2033
- Table 66: Global Cysteine Market Volume kilotons Forecast, by Production Process 2020 & 2033
- Table 67: Global Cysteine Market Revenue Million Forecast, by Application 2020 & 2033
- Table 68: Global Cysteine Market Volume kilotons Forecast, by Application 2020 & 2033
- Table 69: Global Cysteine Market Revenue Million Forecast, by End-user Industry 2020 & 2033
- Table 70: Global Cysteine Market Volume kilotons Forecast, by End-user Industry 2020 & 2033
- Table 71: Global Cysteine Market Revenue Million Forecast, by Country 2020 & 2033
- Table 72: Global Cysteine Market Volume kilotons Forecast, by Country 2020 & 2033
- Table 73: Brazil Cysteine Market Revenue (Million) Forecast, by Application 2020 & 2033
- Table 74: Brazil Cysteine Market Volume (kilotons) Forecast, by Application 2020 & 2033
- Table 75: Argentina Cysteine Market Revenue (Million) Forecast, by Application 2020 & 2033
- Table 76: Argentina Cysteine Market Volume (kilotons) Forecast, by Application 2020 & 2033
- Table 77: Rest of South America Cysteine Market Revenue (Million) Forecast, by Application 2020 & 2033
- Table 78: Rest of South America Cysteine Market Volume (kilotons) Forecast, by Application 2020 & 2033
- Table 79: Global Cysteine Market Revenue Million Forecast, by Production Process 2020 & 2033
- Table 80: Global Cysteine Market Volume kilotons Forecast, by Production Process 2020 & 2033
- Table 81: Global Cysteine Market Revenue Million Forecast, by Application 2020 & 2033
- Table 82: Global Cysteine Market Volume kilotons Forecast, by Application 2020 & 2033
- Table 83: Global Cysteine Market Revenue Million Forecast, by End-user Industry 2020 & 2033
- Table 84: Global Cysteine Market Volume kilotons Forecast, by End-user Industry 2020 & 2033
- Table 85: Global Cysteine Market Revenue Million Forecast, by Country 2020 & 2033
- Table 86: Global Cysteine Market Volume kilotons Forecast, by Country 2020 & 2033
- Table 87: GCC Countries Cysteine Market Revenue (Million) Forecast, by Application 2020 & 2033
- Table 88: GCC Countries Cysteine Market Volume (kilotons) Forecast, by Application 2020 & 2033
- Table 89: South Africa Cysteine Market Revenue (Million) Forecast, by Application 2020 & 2033
- Table 90: South Africa Cysteine Market Volume (kilotons) Forecast, by Application 2020 & 2033
- Table 91: Rest of Middle East and Africa Cysteine Market Revenue (Million) Forecast, by Application 2020 & 2033
- Table 92: Rest of Middle East and Africa Cysteine Market Volume (kilotons) Forecast, by Application 2020 & 2033
Frequently Asked Questions
1. What is the projected Compound Annual Growth Rate (CAGR) of the Cysteine Market?
The projected CAGR is approximately > 5.00%.
2. Which companies are prominent players in the Cysteine Market?
Key companies in the market include Wuxi Bikang Bioengineering Co Ltd *List Not Exhaustive, Merck KGaA, Shanghai Cosroma Biotech Co Ltd, Donboo Amino Acid Co Ltd, NIPPON RIKA Co LTD, Ajinomoto Co Inc, Wuhan Grand Hoyo Co Ltd, Shine Star (Hubei) Biological Engineering Co Ltd, Wacker Chemie AG, CJ CHEILJEDANG CORP.
3. What are the main segments of the Cysteine Market?
The market segments include Production Process, Application, End-user Industry.
4. Can you provide details about the market size?
The market size is estimated to be USD 365.9 Million as of 2022.
5. What are some drivers contributing to market growth?
Increasing Demand from the Bakery Industry; Rising Demand from Pharmaceutical Industry.
6. What are the notable trends driving market growth?
Food Industry to Dominate the Market.
7. Are there any restraints impacting market growth?
Increasing Concerns Related to Animal-sourced Cysteine; Harmful Effects of Cysteine on Human Body.
8. Can you provide examples of recent developments in the market?
2022: Wacker Chemie AG announces plans to expand its cysteine production capacity in China
9. What pricing options are available for accessing the report?
Pricing options include single-user, multi-user, and enterprise licenses priced at USD 4750, USD 5250, and USD 8750 respectively.
10. Is the market size provided in terms of value or volume?
The market size is provided in terms of value, measured in Million and volume, measured in kilotons.
11. Are there any specific market keywords associated with the report?
Yes, the market keyword associated with the report is "Cysteine Market," which aids in identifying and referencing the specific market segment covered.
12. How do I determine which pricing option suits my needs best?
The pricing options vary based on user requirements and access needs. Individual users may opt for single-user licenses, while businesses requiring broader access may choose multi-user or enterprise licenses for cost-effective access to the report.
13. Are there any additional resources or data provided in the Cysteine Market report?
While the report offers comprehensive insights, it's advisable to review the specific contents or supplementary materials provided to ascertain if additional resources or data are available.
14. How can I stay updated on further developments or reports in the Cysteine Market?
To stay informed about further developments, trends, and reports in the Cysteine Market, consider subscribing to industry newsletters, following relevant companies and organizations, or regularly checking reputable industry news sources and publications.
Methodology
Step 1 - Identification of Relevant Samples Size from Population Database


Step 2 - Approaches for Defining Global Market Size (Value, Volume* & Price*)

Note*: In applicable scenarios
Step 3 - Data Sources
Primary Research
- Web Analytics
- Survey Reports
- Research Institute
- Latest Research Reports
- Opinion Leaders
Secondary Research
- Annual Reports
- White Paper
- Latest Press Release
- Industry Association
- Paid Database
- Investor Presentations

Step 4 - Data Triangulation
Involves using different sources of information in order to increase the validity of a study
These sources are likely to be stakeholders in a program - participants, other researchers, program staff, other community members, and so on.
Then we put all data in single framework & apply various statistical tools to find out the dynamic on the market.
During the analysis stage, feedback from the stakeholder groups would be compared to determine areas of agreement as well as areas of divergence