

Key Insights
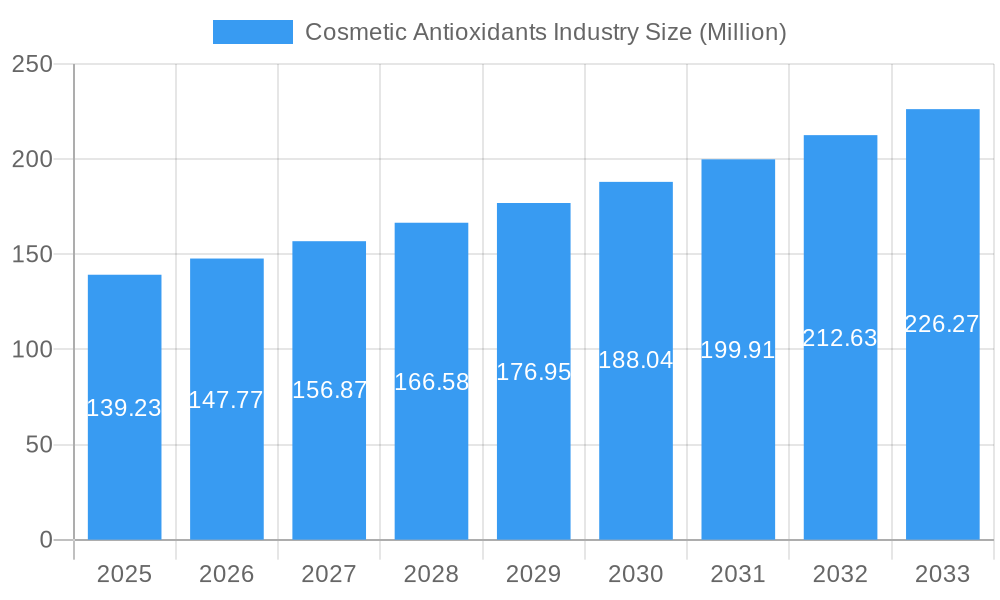
The global cosmetic antioxidants market, valued at $139.23 million in 2025, is projected to experience robust growth, driven by increasing consumer awareness of skincare benefits and the rising prevalence of skin-related issues. A Compound Annual Growth Rate (CAGR) of 5.95% from 2025 to 2033 indicates a significant expansion of this market. Key drivers include the growing demand for natural and organic cosmetic products, a rising preference for anti-aging solutions, and the increasing use of antioxidants in diverse cosmetic applications beyond skincare, encompassing hair care and injectables. The market is segmented by source (natural and chemically derived), type (vitamins, polyphenols, enzymes, carotenoids, and others including flavonoids, synthetic vitamins, and terpenes), and application (skincare, hair care, injectables, and other applications like makeup and body care). Leading players like DSM, Lonza, Kemin Industries, and Evonik are actively shaping market dynamics through innovation and product diversification. Regional variations are expected, with the Asia-Pacific region, particularly China and India, anticipated to exhibit significant growth due to expanding consumer bases and rising disposable incomes. Europe and North America will continue to maintain substantial market shares owing to the established presence of cosmetic manufacturers and high consumer spending on personal care products. The market's future trajectory will hinge on continued research and development leading to the development of novel and effective antioxidant ingredients, alongside regulatory considerations and consumer preferences for sustainable and ethically sourced products.
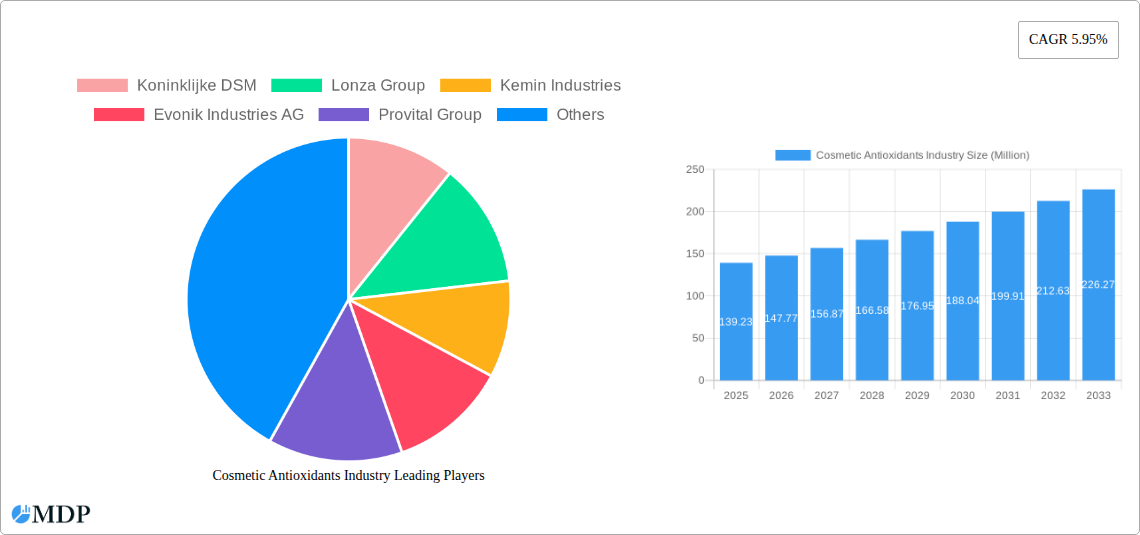
Cosmetic Antioxidants Industry Market Size (In Million)
The market's segmentation presents several opportunities. The growing preference for natural and organic cosmetics is fueling demand for naturally sourced antioxidants. The vitamins and polyphenols segments are likely to remain dominant due to their well-established efficacy and wide applications. Innovation in delivery systems, such as encapsulated antioxidants for enhanced stability and efficacy, will further propel market growth. Competition among major players is intense, characterized by strategic partnerships, mergers and acquisitions, and continuous product development. Companies are focusing on expanding their product portfolios to cater to diverse consumer needs and preferences. While the market's growth is positive, potential restraints could include fluctuating raw material prices and stringent regulatory requirements for cosmetic ingredients in different regions.
Cosmetic Antioxidants Industry Company Market Share
Unlock Explosive Growth: The Comprehensive Cosmetic Antioxidants Market Report (2019-2033)
This in-depth report provides a comprehensive analysis of the global cosmetic antioxidants market, offering invaluable insights for industry stakeholders, investors, and strategic decision-makers. Boasting a detailed examination of market dynamics, leading players, and future trends, this report is your key to navigating the complexities of this rapidly evolving sector. The study period covers 2019-2033, with a base year of 2025 and a forecast period of 2025-2033. The market size is projected to reach xx Million by 2033, presenting significant opportunities for growth.
Cosmetic Antioxidants Industry Market Dynamics & Concentration
The global cosmetic antioxidants market is characterized by a moderately concentrated landscape, with key players such as Koninklijke DSM, Lonza Group, Kemin Industries, and BASF SE holding significant market share. The market's dynamism is driven by several factors, including:
- Innovation: Continuous research and development in antioxidant technologies, leading to the introduction of novel ingredients with enhanced efficacy and safety profiles. This includes advancements in delivery systems and formulation techniques.
- Regulatory landscape: Stringent regulations regarding the safety and efficacy of cosmetic ingredients influence market dynamics, particularly concerning the use of natural vs. chemically derived antioxidants.
- Product Substitutes: The emergence of alternative ingredients with similar antioxidant properties creates competitive pressure, necessitating continuous innovation to maintain market position.
- End-User Trends: Growing consumer awareness of skin health and the harmful effects of free radicals fuels demand for antioxidant-rich cosmetic products. The increasing preference for natural and organic cosmetics also impacts market segments.
- M&A Activity: Consolidation through mergers and acquisitions is a prevalent strategy among major players to expand their product portfolios, geographical reach, and technological capabilities. The number of M&A deals in the industry averaged xx per year during the historical period (2019-2024), with a predicted increase to xx per year during the forecast period (2025-2033). Market share is expected to be concentrated amongst the top 10 players with the top 3 companies holding approximately xx% of market share in 2025.
Cosmetic Antioxidants Industry Industry Trends & Analysis
The cosmetic antioxidants market is experiencing robust growth, driven by a confluence of factors. The market is projected to exhibit a Compound Annual Growth Rate (CAGR) of xx% during the forecast period (2025-2033). Key trends shaping the market include:
- Increased demand for natural and organic cosmetic products: This trend is pushing manufacturers to develop and market naturally-sourced antioxidants, leading to increased market penetration for natural segments.
- Technological advancements: Innovations in encapsulation, delivery systems, and ingredient formulations are enhancing the efficacy and stability of antioxidants in cosmetic products.
- Consumer preferences: The growing demand for products that offer anti-aging, skin brightening, and UV protection benefits is fueling the adoption of antioxidants in cosmetic formulations.
- Competitive landscape: Intense competition among manufacturers is driving innovation and leading to the introduction of new and improved antioxidant products. The market is seeing a significant increase in product differentiation strategies. Market penetration for technologically advanced products is expected to rise from xx% in 2025 to xx% in 2033.
Leading Markets & Segments in Cosmetic Antioxidants Industry
The skin care segment currently dominates the cosmetic antioxidants market, with a projected market share of xx% in 2025. This dominance is attributed to increased consumer awareness regarding the importance of skin health. Within this segment, the demand for natural source antioxidants is outpacing the growth of chemically-derived ones. Other key observations:
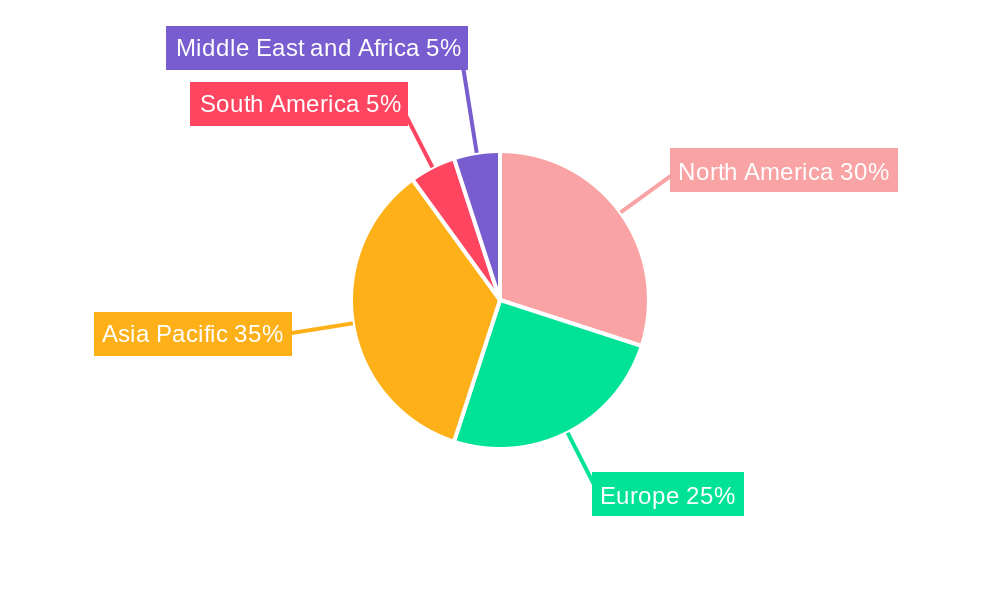
- Regionally: North America and Europe are the leading regions in terms of market size and value.
- Source: The natural segment is experiencing the most rapid growth due to rising consumer preference for naturally sourced ingredients.
- Type: Vitamins and Polyphenols are the most widely used antioxidants, holding significant market share.
- Application: The skincare segment continues to dominate, followed by hair care and injectables.
- Key Drivers (Regional):
- North America: Strong R&D investments, high consumer disposable income, and a mature cosmetic industry.
- Europe: Growing demand for natural and organic cosmetics, stringent regulations promoting product safety.
- Asia-Pacific: Rapid economic growth, rising middle class, and increasing awareness of skincare.
Cosmetic Antioxidants Industry Product Developments
Recent product innovations focus on enhancing the efficacy, stability, and delivery of antioxidants. This includes the development of novel encapsulation technologies, the use of nano-sized particles, and the incorporation of synergistic antioxidant blends. These advancements aim to overcome limitations of traditional antioxidant formulations, improving skin penetration, reducing ingredient degradation, and offering superior consumer benefits. Market fit is enhanced by customizing products to specific skin types and concerns.
Key Drivers of Cosmetic Antioxidants Industry Growth
The growth of the cosmetic antioxidants market is driven by several key factors:
- Technological advancements: Innovations in formulation, encapsulation, and delivery systems are enhancing the efficacy and consumer appeal of antioxidant-based products.
- Economic factors: Rising disposable incomes, particularly in emerging economies, are fueling demand for premium cosmetic products containing antioxidants.
- Regulatory changes: Growing awareness of the safety and efficacy of cosmetic ingredients is leading to stricter regulations, but also fostering innovation to meet these requirements.
Challenges in the Cosmetic Antioxidants Industry Market
The industry faces several challenges:
- Regulatory hurdles: Compliance with stringent regulations in various regions represents a significant challenge for manufacturers.
- Supply chain disruptions: Fluctuations in the supply of raw materials can impact production costs and product availability.
- Competitive pressure: The intense competition necessitates continuous innovation and product differentiation. This competition is expected to reduce profit margins by xx% by 2033.
Emerging Opportunities in Cosmetic Antioxidants Industry
Significant long-term growth opportunities are emerging from:
- Technological breakthroughs: Continued research and development in nanotechnology, personalized cosmetics, and targeted delivery systems will offer novel solutions for enhancing the efficacy of cosmetic antioxidants.
- Strategic partnerships: Collaboration among ingredient suppliers, cosmetic manufacturers, and research institutions will foster innovation and drive market expansion.
- Market expansion: Growing demand in emerging markets presents significant opportunities for expansion and diversification.
Leading Players in the Cosmetic Antioxidants Industry Sector
- Koninklijke DSM
- Lonza Group
- Kemin Industries
- Evonik Industries AG
- Provital Group
- Croda International Plc
- BASF SE
- Eastman Chemical Company
- BTSA Biotecnologias Aplicadas
- Wacker Chemie AG
*List Not Exhaustive
Key Milestones in Cosmetic Antioxidants Industry Industry
- October 2023: BASF's Care Chemicals division invests in a new plant for emollient specialties, boosting its capacity in skin and sun protection product ingredients. This signifies a commitment to the growing market demand.
- June 2023: DKSH's exclusive distribution agreement with Bitop expands the availability of cosmetic ingredients across Australia, New Zealand, Malaysia, and Singapore, potentially increasing market penetration in these regions.
Strategic Outlook for Cosmetic Antioxidants Industry Market
The future of the cosmetic antioxidants market is bright, fueled by continued technological innovation, growing consumer awareness, and expanding market penetration in emerging economies. Strategic opportunities lie in developing sustainable and ethically sourced ingredients, personalized formulations, and leveraging digital marketing strategies to reach target consumers. The market's robust growth trajectory is expected to continue throughout the forecast period, presenting lucrative opportunities for established players and new entrants alike.
Cosmetic Antioxidants Industry Segmentation
-
1. Source
- 1.1. Natural
- 1.2. Chemically Derived
-
2. Type
- 2.1. Vitamins
- 2.2. Polyphenols
- 2.3. Enzymes
- 2.4. Carotenoids
- 2.5. Other Ty
-
3. Application
- 3.1. Skin Care
- 3.2. Hair Care
- 3.3. Injectables
- 3.4. Other Applications (Makeup and Body care)
Cosmetic Antioxidants Industry Segmentation By Geography
-
1. Asia Pacific
- 1.1. China
- 1.2. India
- 1.3. Japan
- 1.4. South Korea
- 1.5. Rest of Asia Pacific
-
2. North America
- 2.1. United States
- 2.2. Canada
- 2.3. Mexico
-
3. Europe
- 3.1. Germany
- 3.2. United Kingdom
- 3.3. Italy
- 3.4. France
- 3.5. Rest of Europe
-
4. South America
- 4.1. Brazil
- 4.2. Argentina
- 4.3. Rest of South America
-
5. Middle East and Africa
- 5.1. Saudi Arabia
- 5.2. South Africa
- 5.3. Rest of Middle East and Africa
Cosmetic Antioxidants Industry Regional Market Share
Geographic Coverage of Cosmetic Antioxidants Industry
Cosmetic Antioxidants Industry REPORT HIGHLIGHTS
| Aspects | Details |
|---|---|
| Study Period | 2020-2034 |
| Base Year | 2025 |
| Estimated Year | 2026 |
| Forecast Period | 2026-2034 |
| Historical Period | 2020-2025 |
| Growth Rate | CAGR of 5.95% from 2020-2034 |
| Segmentation |
|
Table of Contents
- 1. Introduction
- 1.1. Research Scope
- 1.2. Market Segmentation
- 1.3. Research Objective
- 1.4. Definitions and Assumptions
- 2. Executive Summary
- 2.1. Market Snapshot
- 3. Market Dynamics
- 3.1. Market Drivers
- 3.2. Market Restrains
- 3.3. Market Trends
- 3.4. Market Opportunities
- 4. Market Factor Analysis
- 4.1. Porters Five Forces
- 4.1.1. Bargaining Power of Suppliers
- 4.1.2. Bargaining Power of Buyers
- 4.1.3. Threat of New Entrants
- 4.1.4. Threat of Substitutes
- 4.1.5. Competitive Rivalry
- 4.2. PESTEL analysis
- 4.3. BCG Analysis
- 4.3.1. Stars (High Growth, High Market Share)
- 4.3.2. Cash Cows (Low Growth, High Market Share)
- 4.3.3. Question Mark (High Growth, Low Market Share)
- 4.3.4. Dogs (Low Growth, Low Market Share)
- 4.4. Ansoff Matrix Analysis
- 4.5. Supply Chain Analysis
- 4.6. Regulatory Landscape
- 4.7. Current Market Potential and Opportunity Assessment (TAM–SAM–SOM Framework)
- 4.8. MDP Analyst Note
- 4.1. Porters Five Forces
- 5. Market Analysis, Insights and Forecast 2021-2033
- 5.1. Market Analysis, Insights and Forecast - by Source
- 5.1.1. Natural
- 5.1.2. Chemically Derived
- 5.2. Market Analysis, Insights and Forecast - by Type
- 5.2.1. Vitamins
- 5.2.2. Polyphenols
- 5.2.3. Enzymes
- 5.2.4. Carotenoids
- 5.2.5. Other Ty
- 5.3. Market Analysis, Insights and Forecast - by Application
- 5.3.1. Skin Care
- 5.3.2. Hair Care
- 5.3.3. Injectables
- 5.3.4. Other Applications (Makeup and Body care)
- 5.4. Market Analysis, Insights and Forecast - by Region
- 5.4.1. Asia Pacific
- 5.4.2. North America
- 5.4.3. Europe
- 5.4.4. South America
- 5.4.5. Middle East and Africa
- 5.1. Market Analysis, Insights and Forecast - by Source
- 6. Global Cosmetic Antioxidants Industry Analysis, Insights and Forecast, 2021-2033
- 6.1. Market Analysis, Insights and Forecast - by Source
- 6.1.1. Natural
- 6.1.2. Chemically Derived
- 6.2. Market Analysis, Insights and Forecast - by Type
- 6.2.1. Vitamins
- 6.2.2. Polyphenols
- 6.2.3. Enzymes
- 6.2.4. Carotenoids
- 6.2.5. Other Ty
- 6.3. Market Analysis, Insights and Forecast - by Application
- 6.3.1. Skin Care
- 6.3.2. Hair Care
- 6.3.3. Injectables
- 6.3.4. Other Applications (Makeup and Body care)
- 6.1. Market Analysis, Insights and Forecast - by Source
- 7. Asia Pacific Cosmetic Antioxidants Industry Analysis, Insights and Forecast, 2020-2032
- 7.1. Market Analysis, Insights and Forecast - by Source
- 7.1.1. Natural
- 7.1.2. Chemically Derived
- 7.2. Market Analysis, Insights and Forecast - by Type
- 7.2.1. Vitamins
- 7.2.2. Polyphenols
- 7.2.3. Enzymes
- 7.2.4. Carotenoids
- 7.2.5. Other Ty
- 7.3. Market Analysis, Insights and Forecast - by Application
- 7.3.1. Skin Care
- 7.3.2. Hair Care
- 7.3.3. Injectables
- 7.3.4. Other Applications (Makeup and Body care)
- 7.1. Market Analysis, Insights and Forecast - by Source
- 8. North America Cosmetic Antioxidants Industry Analysis, Insights and Forecast, 2020-2032
- 8.1. Market Analysis, Insights and Forecast - by Source
- 8.1.1. Natural
- 8.1.2. Chemically Derived
- 8.2. Market Analysis, Insights and Forecast - by Type
- 8.2.1. Vitamins
- 8.2.2. Polyphenols
- 8.2.3. Enzymes
- 8.2.4. Carotenoids
- 8.2.5. Other Ty
- 8.3. Market Analysis, Insights and Forecast - by Application
- 8.3.1. Skin Care
- 8.3.2. Hair Care
- 8.3.3. Injectables
- 8.3.4. Other Applications (Makeup and Body care)
- 8.1. Market Analysis, Insights and Forecast - by Source
- 9. Europe Cosmetic Antioxidants Industry Analysis, Insights and Forecast, 2020-2032
- 9.1. Market Analysis, Insights and Forecast - by Source
- 9.1.1. Natural
- 9.1.2. Chemically Derived
- 9.2. Market Analysis, Insights and Forecast - by Type
- 9.2.1. Vitamins
- 9.2.2. Polyphenols
- 9.2.3. Enzymes
- 9.2.4. Carotenoids
- 9.2.5. Other Ty
- 9.3. Market Analysis, Insights and Forecast - by Application
- 9.3.1. Skin Care
- 9.3.2. Hair Care
- 9.3.3. Injectables
- 9.3.4. Other Applications (Makeup and Body care)
- 9.1. Market Analysis, Insights and Forecast - by Source
- 10. South America Cosmetic Antioxidants Industry Analysis, Insights and Forecast, 2020-2032
- 10.1. Market Analysis, Insights and Forecast - by Source
- 10.1.1. Natural
- 10.1.2. Chemically Derived
- 10.2. Market Analysis, Insights and Forecast - by Type
- 10.2.1. Vitamins
- 10.2.2. Polyphenols
- 10.2.3. Enzymes
- 10.2.4. Carotenoids
- 10.2.5. Other Ty
- 10.3. Market Analysis, Insights and Forecast - by Application
- 10.3.1. Skin Care
- 10.3.2. Hair Care
- 10.3.3. Injectables
- 10.3.4. Other Applications (Makeup and Body care)
- 10.1. Market Analysis, Insights and Forecast - by Source
- 11. Middle East and Africa Cosmetic Antioxidants Industry Analysis, Insights and Forecast, 2020-2032
- 11.1. Market Analysis, Insights and Forecast - by Source
- 11.1.1. Natural
- 11.1.2. Chemically Derived
- 11.2. Market Analysis, Insights and Forecast - by Type
- 11.2.1. Vitamins
- 11.2.2. Polyphenols
- 11.2.3. Enzymes
- 11.2.4. Carotenoids
- 11.2.5. Other Ty
- 11.3. Market Analysis, Insights and Forecast - by Application
- 11.3.1. Skin Care
- 11.3.2. Hair Care
- 11.3.3. Injectables
- 11.3.4. Other Applications (Makeup and Body care)
- 11.1. Market Analysis, Insights and Forecast - by Source
- 12. Competitive Analysis
- 12.1. Company Profiles
- 12.1.1 Koninklijke DSM
- 12.1.1.1. Company Overview
- 12.1.1.2. Products
- 12.1.1.3. Company Financials
- 12.1.1.4. SWOT Analysis
- 12.1.2 Lonza Group
- 12.1.2.1. Company Overview
- 12.1.2.2. Products
- 12.1.2.3. Company Financials
- 12.1.2.4. SWOT Analysis
- 12.1.3 Kemin Industries
- 12.1.3.1. Company Overview
- 12.1.3.2. Products
- 12.1.3.3. Company Financials
- 12.1.3.4. SWOT Analysis
- 12.1.4 Evonik Industries AG
- 12.1.4.1. Company Overview
- 12.1.4.2. Products
- 12.1.4.3. Company Financials
- 12.1.4.4. SWOT Analysis
- 12.1.5 Provital Group
- 12.1.5.1. Company Overview
- 12.1.5.2. Products
- 12.1.5.3. Company Financials
- 12.1.5.4. SWOT Analysis
- 12.1.6 Croda International Plc
- 12.1.6.1. Company Overview
- 12.1.6.2. Products
- 12.1.6.3. Company Financials
- 12.1.6.4. SWOT Analysis
- 12.1.7 BASF SE
- 12.1.7.1. Company Overview
- 12.1.7.2. Products
- 12.1.7.3. Company Financials
- 12.1.7.4. SWOT Analysis
- 12.1.8 Eastman Chemical Company
- 12.1.8.1. Company Overview
- 12.1.8.2. Products
- 12.1.8.3. Company Financials
- 12.1.8.4. SWOT Analysis
- 12.1.9 BTSA Biotecnologias Aplicadas
- 12.1.9.1. Company Overview
- 12.1.9.2. Products
- 12.1.9.3. Company Financials
- 12.1.9.4. SWOT Analysis
- 12.1.10 Wacker Chemie AG*List Not Exhaustive
- 12.1.10.1. Company Overview
- 12.1.10.2. Products
- 12.1.10.3. Company Financials
- 12.1.10.4. SWOT Analysis
- 12.1.1 Koninklijke DSM
- 12.2. Market Entropy
- 12.2.1 Company's Key Areas Served
- 12.2.2 Recent Developments
- 12.3. Company Market Share Analysis 2025
- 12.3.1 Top 5 Companies Market Share Analysis
- 12.3.2 Top 3 Companies Market Share Analysis
- 12.4. List of Potential Customers
- 13. Research Methodology
List of Figures
- Figure 1: Global Cosmetic Antioxidants Industry Revenue Breakdown (Million, %) by Region 2025 & 2033
- Figure 2: Asia Pacific Cosmetic Antioxidants Industry Revenue (Million), by Source 2025 & 2033
- Figure 3: Asia Pacific Cosmetic Antioxidants Industry Revenue Share (%), by Source 2025 & 2033
- Figure 4: Asia Pacific Cosmetic Antioxidants Industry Revenue (Million), by Type 2025 & 2033
- Figure 5: Asia Pacific Cosmetic Antioxidants Industry Revenue Share (%), by Type 2025 & 2033
- Figure 6: Asia Pacific Cosmetic Antioxidants Industry Revenue (Million), by Application 2025 & 2033
- Figure 7: Asia Pacific Cosmetic Antioxidants Industry Revenue Share (%), by Application 2025 & 2033
- Figure 8: Asia Pacific Cosmetic Antioxidants Industry Revenue (Million), by Country 2025 & 2033
- Figure 9: Asia Pacific Cosmetic Antioxidants Industry Revenue Share (%), by Country 2025 & 2033
- Figure 10: North America Cosmetic Antioxidants Industry Revenue (Million), by Source 2025 & 2033
- Figure 11: North America Cosmetic Antioxidants Industry Revenue Share (%), by Source 2025 & 2033
- Figure 12: North America Cosmetic Antioxidants Industry Revenue (Million), by Type 2025 & 2033
- Figure 13: North America Cosmetic Antioxidants Industry Revenue Share (%), by Type 2025 & 2033
- Figure 14: North America Cosmetic Antioxidants Industry Revenue (Million), by Application 2025 & 2033
- Figure 15: North America Cosmetic Antioxidants Industry Revenue Share (%), by Application 2025 & 2033
- Figure 16: North America Cosmetic Antioxidants Industry Revenue (Million), by Country 2025 & 2033
- Figure 17: North America Cosmetic Antioxidants Industry Revenue Share (%), by Country 2025 & 2033
- Figure 18: Europe Cosmetic Antioxidants Industry Revenue (Million), by Source 2025 & 2033
- Figure 19: Europe Cosmetic Antioxidants Industry Revenue Share (%), by Source 2025 & 2033
- Figure 20: Europe Cosmetic Antioxidants Industry Revenue (Million), by Type 2025 & 2033
- Figure 21: Europe Cosmetic Antioxidants Industry Revenue Share (%), by Type 2025 & 2033
- Figure 22: Europe Cosmetic Antioxidants Industry Revenue (Million), by Application 2025 & 2033
- Figure 23: Europe Cosmetic Antioxidants Industry Revenue Share (%), by Application 2025 & 2033
- Figure 24: Europe Cosmetic Antioxidants Industry Revenue (Million), by Country 2025 & 2033
- Figure 25: Europe Cosmetic Antioxidants Industry Revenue Share (%), by Country 2025 & 2033
- Figure 26: South America Cosmetic Antioxidants Industry Revenue (Million), by Source 2025 & 2033
- Figure 27: South America Cosmetic Antioxidants Industry Revenue Share (%), by Source 2025 & 2033
- Figure 28: South America Cosmetic Antioxidants Industry Revenue (Million), by Type 2025 & 2033
- Figure 29: South America Cosmetic Antioxidants Industry Revenue Share (%), by Type 2025 & 2033
- Figure 30: South America Cosmetic Antioxidants Industry Revenue (Million), by Application 2025 & 2033
- Figure 31: South America Cosmetic Antioxidants Industry Revenue Share (%), by Application 2025 & 2033
- Figure 32: South America Cosmetic Antioxidants Industry Revenue (Million), by Country 2025 & 2033
- Figure 33: South America Cosmetic Antioxidants Industry Revenue Share (%), by Country 2025 & 2033
- Figure 34: Middle East and Africa Cosmetic Antioxidants Industry Revenue (Million), by Source 2025 & 2033
- Figure 35: Middle East and Africa Cosmetic Antioxidants Industry Revenue Share (%), by Source 2025 & 2033
- Figure 36: Middle East and Africa Cosmetic Antioxidants Industry Revenue (Million), by Type 2025 & 2033
- Figure 37: Middle East and Africa Cosmetic Antioxidants Industry Revenue Share (%), by Type 2025 & 2033
- Figure 38: Middle East and Africa Cosmetic Antioxidants Industry Revenue (Million), by Application 2025 & 2033
- Figure 39: Middle East and Africa Cosmetic Antioxidants Industry Revenue Share (%), by Application 2025 & 2033
- Figure 40: Middle East and Africa Cosmetic Antioxidants Industry Revenue (Million), by Country 2025 & 2033
- Figure 41: Middle East and Africa Cosmetic Antioxidants Industry Revenue Share (%), by Country 2025 & 2033
List of Tables
- Table 1: Global Cosmetic Antioxidants Industry Revenue Million Forecast, by Source 2020 & 2033
- Table 2: Global Cosmetic Antioxidants Industry Revenue Million Forecast, by Type 2020 & 2033
- Table 3: Global Cosmetic Antioxidants Industry Revenue Million Forecast, by Application 2020 & 2033
- Table 4: Global Cosmetic Antioxidants Industry Revenue Million Forecast, by Region 2020 & 2033
- Table 5: Global Cosmetic Antioxidants Industry Revenue Million Forecast, by Source 2020 & 2033
- Table 6: Global Cosmetic Antioxidants Industry Revenue Million Forecast, by Type 2020 & 2033
- Table 7: Global Cosmetic Antioxidants Industry Revenue Million Forecast, by Application 2020 & 2033
- Table 8: Global Cosmetic Antioxidants Industry Revenue Million Forecast, by Country 2020 & 2033
- Table 9: China Cosmetic Antioxidants Industry Revenue (Million) Forecast, by Application 2020 & 2033
- Table 10: India Cosmetic Antioxidants Industry Revenue (Million) Forecast, by Application 2020 & 2033
- Table 11: Japan Cosmetic Antioxidants Industry Revenue (Million) Forecast, by Application 2020 & 2033
- Table 12: South Korea Cosmetic Antioxidants Industry Revenue (Million) Forecast, by Application 2020 & 2033
- Table 13: Rest of Asia Pacific Cosmetic Antioxidants Industry Revenue (Million) Forecast, by Application 2020 & 2033
- Table 14: Global Cosmetic Antioxidants Industry Revenue Million Forecast, by Source 2020 & 2033
- Table 15: Global Cosmetic Antioxidants Industry Revenue Million Forecast, by Type 2020 & 2033
- Table 16: Global Cosmetic Antioxidants Industry Revenue Million Forecast, by Application 2020 & 2033
- Table 17: Global Cosmetic Antioxidants Industry Revenue Million Forecast, by Country 2020 & 2033
- Table 18: United States Cosmetic Antioxidants Industry Revenue (Million) Forecast, by Application 2020 & 2033
- Table 19: Canada Cosmetic Antioxidants Industry Revenue (Million) Forecast, by Application 2020 & 2033
- Table 20: Mexico Cosmetic Antioxidants Industry Revenue (Million) Forecast, by Application 2020 & 2033
- Table 21: Global Cosmetic Antioxidants Industry Revenue Million Forecast, by Source 2020 & 2033
- Table 22: Global Cosmetic Antioxidants Industry Revenue Million Forecast, by Type 2020 & 2033
- Table 23: Global Cosmetic Antioxidants Industry Revenue Million Forecast, by Application 2020 & 2033
- Table 24: Global Cosmetic Antioxidants Industry Revenue Million Forecast, by Country 2020 & 2033
- Table 25: Germany Cosmetic Antioxidants Industry Revenue (Million) Forecast, by Application 2020 & 2033
- Table 26: United Kingdom Cosmetic Antioxidants Industry Revenue (Million) Forecast, by Application 2020 & 2033
- Table 27: Italy Cosmetic Antioxidants Industry Revenue (Million) Forecast, by Application 2020 & 2033
- Table 28: France Cosmetic Antioxidants Industry Revenue (Million) Forecast, by Application 2020 & 2033
- Table 29: Rest of Europe Cosmetic Antioxidants Industry Revenue (Million) Forecast, by Application 2020 & 2033
- Table 30: Global Cosmetic Antioxidants Industry Revenue Million Forecast, by Source 2020 & 2033
- Table 31: Global Cosmetic Antioxidants Industry Revenue Million Forecast, by Type 2020 & 2033
- Table 32: Global Cosmetic Antioxidants Industry Revenue Million Forecast, by Application 2020 & 2033
- Table 33: Global Cosmetic Antioxidants Industry Revenue Million Forecast, by Country 2020 & 2033
- Table 34: Brazil Cosmetic Antioxidants Industry Revenue (Million) Forecast, by Application 2020 & 2033
- Table 35: Argentina Cosmetic Antioxidants Industry Revenue (Million) Forecast, by Application 2020 & 2033
- Table 36: Rest of South America Cosmetic Antioxidants Industry Revenue (Million) Forecast, by Application 2020 & 2033
- Table 37: Global Cosmetic Antioxidants Industry Revenue Million Forecast, by Source 2020 & 2033
- Table 38: Global Cosmetic Antioxidants Industry Revenue Million Forecast, by Type 2020 & 2033
- Table 39: Global Cosmetic Antioxidants Industry Revenue Million Forecast, by Application 2020 & 2033
- Table 40: Global Cosmetic Antioxidants Industry Revenue Million Forecast, by Country 2020 & 2033
- Table 41: Saudi Arabia Cosmetic Antioxidants Industry Revenue (Million) Forecast, by Application 2020 & 2033
- Table 42: South Africa Cosmetic Antioxidants Industry Revenue (Million) Forecast, by Application 2020 & 2033
- Table 43: Rest of Middle East and Africa Cosmetic Antioxidants Industry Revenue (Million) Forecast, by Application 2020 & 2033
Frequently Asked Questions
1. What is the projected Compound Annual Growth Rate (CAGR) of the Cosmetic Antioxidants Industry?
The projected CAGR is approximately 5.95%.
2. Which companies are prominent players in the Cosmetic Antioxidants Industry?
Key companies in the market include Koninklijke DSM, Lonza Group, Kemin Industries, Evonik Industries AG, Provital Group, Croda International Plc, BASF SE, Eastman Chemical Company, BTSA Biotecnologias Aplicadas, Wacker Chemie AG*List Not Exhaustive.
3. What are the main segments of the Cosmetic Antioxidants Industry?
The market segments include Source, Type, Application.
4. Can you provide details about the market size?
The market size is estimated to be USD 139.23 Million as of 2022.
5. What are some drivers contributing to market growth?
Rise in Online Purcahse of Cosmetics; Increasing Use of Beauty Products and Personal Care Products; Other Drivers.
6. What are the notable trends driving market growth?
Increasing Usage of Natural Antioxidants in Cosmetics Products.
7. Are there any restraints impacting market growth?
High Cost of Natural Antioxidants; Other Restraints.
8. Can you provide examples of recent developments in the market?
October 2023: BASF's Care Chemicals division is investing in a new plant to produce emollient specialties at its Düsseldorf site targeted for skin and sun protection products.
9. What pricing options are available for accessing the report?
Pricing options include single-user, multi-user, and enterprise licenses priced at USD 4750, USD 5250, and USD 8750 respectively.
10. Is the market size provided in terms of value or volume?
The market size is provided in terms of value, measured in Million.
11. Are there any specific market keywords associated with the report?
Yes, the market keyword associated with the report is "Cosmetic Antioxidants Industry," which aids in identifying and referencing the specific market segment covered.
12. How do I determine which pricing option suits my needs best?
The pricing options vary based on user requirements and access needs. Individual users may opt for single-user licenses, while businesses requiring broader access may choose multi-user or enterprise licenses for cost-effective access to the report.
13. Are there any additional resources or data provided in the Cosmetic Antioxidants Industry report?
While the report offers comprehensive insights, it's advisable to review the specific contents or supplementary materials provided to ascertain if additional resources or data are available.
14. How can I stay updated on further developments or reports in the Cosmetic Antioxidants Industry?
To stay informed about further developments, trends, and reports in the Cosmetic Antioxidants Industry, consider subscribing to industry newsletters, following relevant companies and organizations, or regularly checking reputable industry news sources and publications.
Methodology
Step 1 - Identification of Relevant Samples Size from Population Database


Step 2 - Approaches for Defining Global Market Size (Value, Volume* & Price*)

Note*: In applicable scenarios
Step 3 - Data Sources
Primary Research
- Web Analytics
- Survey Reports
- Research Institute
- Latest Research Reports
- Opinion Leaders
Secondary Research
- Annual Reports
- White Paper
- Latest Press Release
- Industry Association
- Paid Database
- Investor Presentations

Step 4 - Data Triangulation
Involves using different sources of information in order to increase the validity of a study
These sources are likely to be stakeholders in a program - participants, other researchers, program staff, other community members, and so on.
Then we put all data in single framework & apply various statistical tools to find out the dynamic on the market.
During the analysis stage, feedback from the stakeholder groups would be compared to determine areas of agreement as well as areas of divergence