

Key Insights
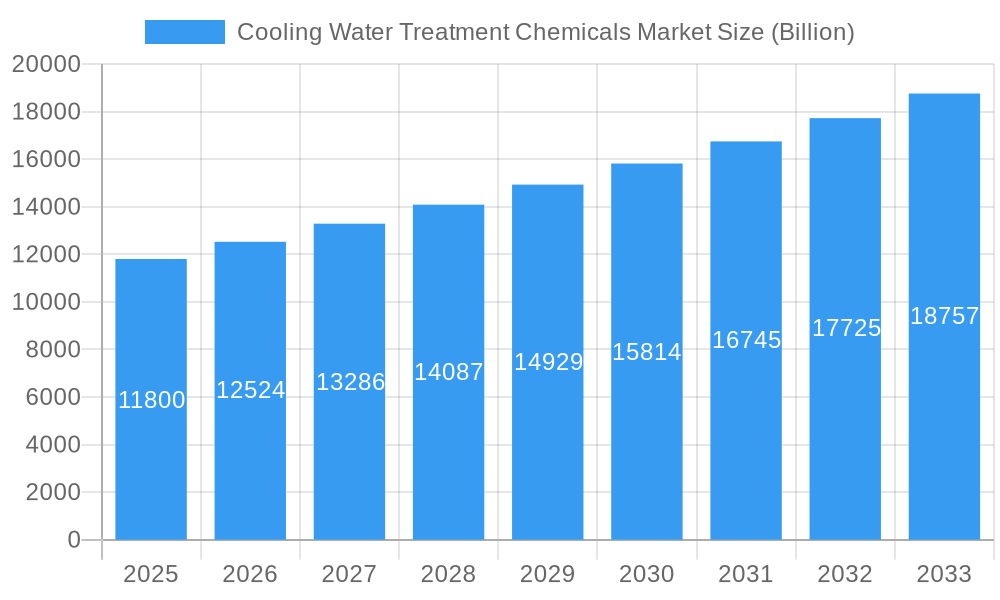
The Cooling Water Treatment Chemicals market, valued at $11.8 billion in 2025, is projected to experience robust growth, driven by increasing industrialization and stringent environmental regulations. A compound annual growth rate (CAGR) of 5.8% from 2025 to 2033 indicates a significant expansion, with the market size expected to surpass $18 billion by 2033. Key drivers include the rising demand for efficient cooling systems across various industries, particularly power generation, petrochemicals, and manufacturing. The need to prevent corrosion, scaling, and microbial growth in cooling water systems is fueling the adoption of advanced chemical treatments. Growing awareness of water conservation and the associated environmental impact further supports market expansion. The market is segmented by chemical type (corrosion inhibitors, scale inhibitors, biocides, and others) and end-user industry, with the power industry, steel, and petrochemicals sectors dominating the demand. Technological advancements in chemical formulations, focusing on enhanced efficiency and eco-friendliness, represent a major trend shaping the market's trajectory. However, factors like fluctuating raw material prices and stringent regulatory compliance requirements pose challenges to market growth. Competitive dynamics are characterized by the presence of both large multinational corporations and specialized chemical manufacturers. Regional growth is expected to be varied, with Asia-Pacific and North America leading due to substantial industrial activity and infrastructure development.
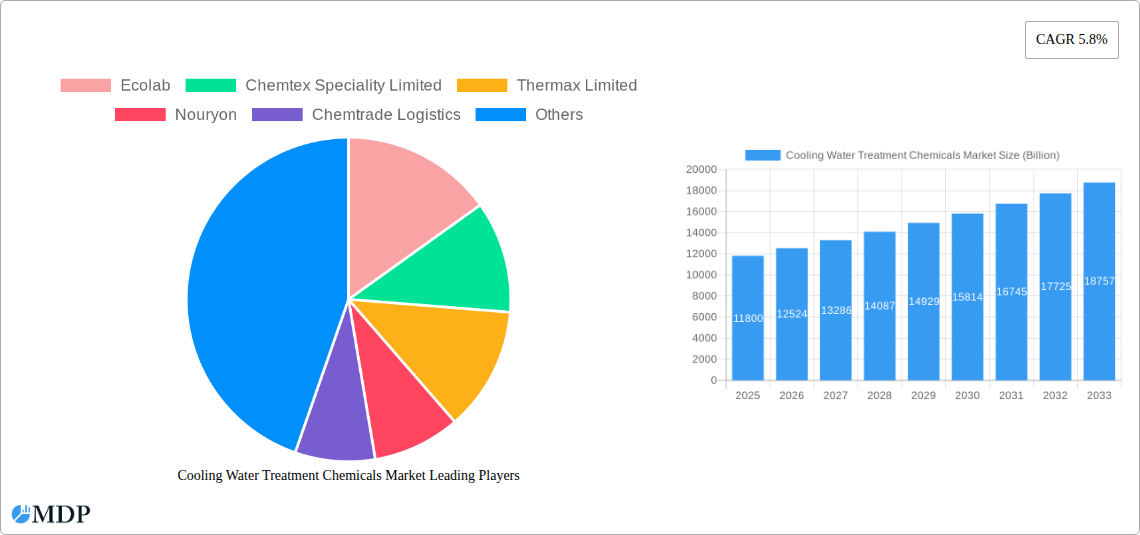
Cooling Water Treatment Chemicals Market Market Size (In Billion)
The competitive landscape is characterized by both large multinational corporations and smaller specialized chemical manufacturers. Ecolab, Chemtex Speciality Limited, Thermax Limited, Nouryon, and other key players are actively engaged in product development, strategic partnerships, and geographical expansion to maintain their market share. The market is expected to witness further consolidation through mergers and acquisitions, as companies seek to enhance their product portfolios and expand their global reach. Future growth will be influenced by factors such as the development of sustainable and environmentally friendly cooling water treatment solutions, increasing investment in renewable energy sources, and stricter regulations concerning water discharge. The continued emphasis on optimizing industrial processes and improving energy efficiency will drive further demand for advanced cooling water treatment chemicals in the coming years.
Cooling Water Treatment Chemicals Market Company Market Share
Cooling Water Treatment Chemicals Market: A Comprehensive Report (2019-2033)
This comprehensive report provides an in-depth analysis of the Cooling Water Treatment Chemicals market, offering invaluable insights for stakeholders across the value chain. Valued at $XX Billion in 2025, the market is poised for significant growth, projected to reach $XX Billion by 2033, exhibiting a CAGR of XX% during the forecast period (2025-2033). The study covers the historical period (2019-2024), with 2025 serving as the base year. This report meticulously examines market dynamics, leading players, emerging trends, and future growth prospects, providing actionable intelligence for strategic decision-making.
Cooling Water Treatment Chemicals Market Dynamics & Concentration
The Cooling Water Treatment Chemicals market is characterized by a moderately concentrated landscape with several key players holding significant market share. Ecolab, Chemtex Speciality Limited, Thermax Limited, and Nouryon are among the leading companies, collectively accounting for approximately XX% of the market in 2025. Market concentration is influenced by factors including economies of scale, technological advancements, and stringent regulatory frameworks governing water treatment chemicals. The market exhibits continuous innovation, driven by the need for environmentally friendly and highly efficient water treatment solutions. This is further propelled by increasing regulations regarding water discharge and stricter environmental protection standards. Mergers and acquisitions (M&A) activity remains a key driver, with XX M&A deals recorded in the past five years, primarily focused on expanding product portfolios and geographical reach. Product substitution is a factor, with the increasing adoption of alternative technologies like membrane filtration systems challenging the traditional chemical-based treatments, although chemical treatments remain the dominant approach for now. End-user trends showcase increasing adoption of advanced treatment solutions in high-growth sectors like petrochemicals and renewable energy, fueling market expansion.
Cooling Water Treatment Chemicals Market Industry Trends & Analysis
The Cooling Water Treatment Chemicals market demonstrates robust growth, primarily driven by the increasing demand for efficient and sustainable water treatment solutions across various end-use industries. The rising global industrialization and urbanization significantly contribute to the market expansion, as industries seek to optimize water usage and minimize environmental impact. Technological advancements, particularly in the development of advanced polymers and biocides, offer improved performance, reduced chemical consumption, and enhanced environmental compatibility. Consumer preference is shifting towards eco-friendly and sustainable solutions, influencing product development and market competition. The competitive landscape is intense, with companies focusing on innovation, strategic partnerships, and geographical expansion to maintain market share. Market penetration of advanced treatment technologies is steadily increasing, particularly in developed regions with stricter environmental regulations. This technological push contributes to a higher market CAGR as seen by several established players increasing their investment in the sector.
Leading Markets & Segments in Cooling Water Treatment Chemicals Market
The Power Industry segment holds the largest market share within the end-user industry category, driven by the extensive usage of cooling water in power generation. Geographically, the North American market dominates, attributed to its robust industrial base, stringent environmental regulations, and significant investment in infrastructure development.
Key Drivers for Power Industry Dominance:
- Stringent environmental regulations concerning water discharge.
- High power generation capacity and cooling water requirements.
- Continuous upgradation of existing power plants.
Key Drivers for North America Dominance:
- Stringent environmental regulations.
- High industrial activity and infrastructure spending.
- Adoption of advanced water treatment technologies.
Within the type segment, Corrosion Inhibitors and Scale Inhibitors exhibit the highest demand due to their crucial role in preventing equipment damage and operational disruptions. The growth of the Petrochemicals and Oil and Gas sector also contributes significantly to the market growth, pushing the demand for specialized biocides and other treatment chemicals.
Cooling Water Treatment Chemicals Market Product Developments
Recent product innovations focus on developing environmentally friendly, high-performance chemicals with enhanced efficacy and reduced environmental impact. This includes the introduction of smart-tagged polymers for improved performance monitoring and optimized chemical dosage. These advancements address the growing need for sustainable and efficient water treatment solutions, catering to the evolving demands of end-user industries, particularly those facing increased scrutiny on environmental impact. Companies are leveraging nanotechnology and advanced analytical tools to improve product effectiveness and reduce reliance on traditional, less environmentally friendly solutions.
Key Drivers of Cooling Water Treatment Chemicals Market Growth
Several factors fuel the market's growth, including:
- Stringent environmental regulations: Governments worldwide are enacting stricter regulations on water discharge, driving the adoption of advanced water treatment solutions.
- Increasing industrialization: Expansion of industries like power generation, petrochemicals, and manufacturing boosts the demand for cooling water treatment chemicals.
- Technological advancements: Development of eco-friendly, high-performance chemicals enhances the market's attractiveness and efficiency.
- Rising energy demands: Increased global energy consumption drives the growth of the power sector and its associated need for effective cooling water treatment.
Challenges in the Cooling Water Treatment Chemicals Market
The market faces several challenges including:
- Fluctuating raw material prices: Price volatility impacts production costs and profitability.
- Stringent regulatory compliance: Meeting environmental regulations adds complexity and cost to operations.
- Intense competition: A large number of established and emerging players create a competitive landscape.
- Supply chain disruptions: Global events can disrupt raw material sourcing and distribution networks. This has a direct correlation with manufacturing and end-user costs, negatively affecting profitability.
Emerging Opportunities in Cooling Water Treatment Chemicals Market
Significant opportunities exist in developing sustainable and smart water treatment solutions, leveraging technological advancements like IoT sensors and data analytics for optimized treatment strategies. Strategic partnerships and collaborations offer expanded market access and technological advancements. Expanding into emerging economies with growing industrialization presents substantial growth potential. The focus on sustainable and environmentally conscious practices within industries provides strong incentives for the adoption of advanced chemical treatments and technologies.
Key Milestones in Cooling Water Treatment Chemicals Market Industry
- October 2022: Italmatch Chemicals launched its Smart-Tagged Polymers brand line for industrial water treatment, enhancing digital performance control in cooling tower applications. This signifies a significant step towards enhanced efficiency and sustainability in the industry.
- February 2022: SUEZ and partners secured a contract for the Wanhua Chemical Group's desalination plant, demonstrating the growing role of water treatment in large-scale infrastructure projects. This highlights the expanding market for specialized water treatment solutions.
Strategic Outlook for Cooling Water Treatment Chemicals Market Market
The Cooling Water Treatment Chemicals market presents substantial growth potential, driven by ongoing industrial expansion, stringent environmental regulations, and the emergence of innovative technologies. Companies focusing on sustainable solutions, strategic partnerships, and technological leadership are poised for success. Investing in R&D to develop eco-friendly, high-performance chemicals and exploring emerging markets will be critical for long-term growth and market share expansion. The continuous improvement of chemical treatment efficiency and the adaptation to the increasing need for sustainability will further drive market growth.
Cooling Water Treatment Chemicals Market Segmentation
-
1. Type
- 1.1. Corrosion Inhibitor
- 1.2. Scale Inhibitor
- 1.3. Biocide
- 1.4. Other Types
-
2. End-user Industry
- 2.1. Power Industry
- 2.2. Steel, Mining & Metallurgy
- 2.3. Petrochemicals and Oil and Gas
- 2.4. Food and Beverage
- 2.5. Textile and Dyes
- 2.6. Other End-user Industries
Cooling Water Treatment Chemicals Market Segmentation By Geography
-
1. Asia Pacific
- 1.1. China
- 1.2. India
- 1.3. Japan
- 1.4. South Korea
- 1.5. Rest of Asia Pacific
-
2. North America
- 2.1. United States
- 2.2. Canada
- 2.3. Mexico
-
3. Europe
- 3.1. Germany
- 3.2. United Kingdom
- 3.3. France
- 3.4. Italy
- 3.5. Rest of Europe
-
4. South America
- 4.1. Brazil
- 4.2. Argentina
- 4.3. Rest of South America
- 5. Middle East
-
6. Saudi Arabia
- 6.1. South Africa
- 6.2. Rest of Middle East
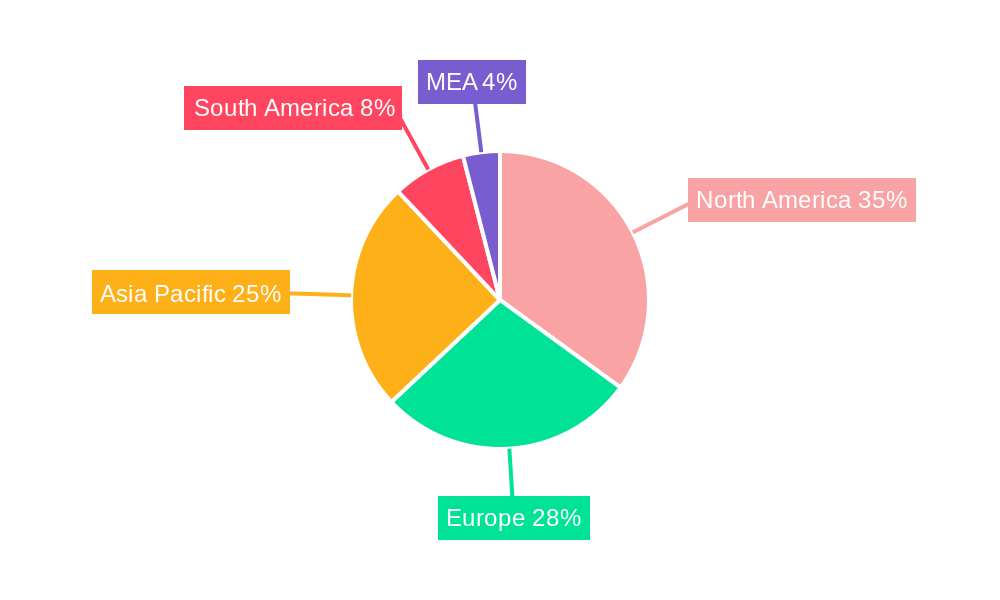
Cooling Water Treatment Chemicals Market Regional Market Share
Geographic Coverage of Cooling Water Treatment Chemicals Market
Cooling Water Treatment Chemicals Market REPORT HIGHLIGHTS
| Aspects | Details |
|---|---|
| Study Period | 2020-2034 |
| Base Year | 2025 |
| Estimated Year | 2026 |
| Forecast Period | 2026-2034 |
| Historical Period | 2020-2025 |
| Growth Rate | CAGR of 5.8% from 2020-2034 |
| Segmentation |
|
Table of Contents
- 1. Introduction
- 1.1. Research Scope
- 1.2. Market Segmentation
- 1.3. Research Objective
- 1.4. Definitions and Assumptions
- 2. Executive Summary
- 2.1. Market Snapshot
- 3. Market Dynamics
- 3.1. Market Drivers
- 3.2. Market Restrains
- 3.3. Market Trends
- 3.4. Market Opportunities
- 4. Market Factor Analysis
- 4.1. Porters Five Forces
- 4.1.1. Bargaining Power of Suppliers
- 4.1.2. Bargaining Power of Buyers
- 4.1.3. Threat of New Entrants
- 4.1.4. Threat of Substitutes
- 4.1.5. Competitive Rivalry
- 4.2. PESTEL analysis
- 4.3. BCG Analysis
- 4.3.1. Stars (High Growth, High Market Share)
- 4.3.2. Cash Cows (Low Growth, High Market Share)
- 4.3.3. Question Mark (High Growth, Low Market Share)
- 4.3.4. Dogs (Low Growth, Low Market Share)
- 4.4. Ansoff Matrix Analysis
- 4.5. Supply Chain Analysis
- 4.6. Regulatory Landscape
- 4.7. Current Market Potential and Opportunity Assessment (TAM–SAM–SOM Framework)
- 4.8. MDP Analyst Note
- 4.1. Porters Five Forces
- 5. Market Analysis, Insights and Forecast 2021-2033
- 5.1. Market Analysis, Insights and Forecast - by Type
- 5.1.1. Corrosion Inhibitor
- 5.1.2. Scale Inhibitor
- 5.1.3. Biocide
- 5.1.4. Other Types
- 5.2. Market Analysis, Insights and Forecast - by End-user Industry
- 5.2.1. Power Industry
- 5.2.2. Steel, Mining & Metallurgy
- 5.2.3. Petrochemicals and Oil and Gas
- 5.2.4. Food and Beverage
- 5.2.5. Textile and Dyes
- 5.2.6. Other End-user Industries
- 5.3. Market Analysis, Insights and Forecast - by Region
- 5.3.1. Asia Pacific
- 5.3.2. North America
- 5.3.3. Europe
- 5.3.4. South America
- 5.3.5. Middle East
- 5.3.6. Saudi Arabia
- 5.1. Market Analysis, Insights and Forecast - by Type
- 6. Global Cooling Water Treatment Chemicals Market Analysis, Insights and Forecast, 2021-2033
- 6.1. Market Analysis, Insights and Forecast - by Type
- 6.1.1. Corrosion Inhibitor
- 6.1.2. Scale Inhibitor
- 6.1.3. Biocide
- 6.1.4. Other Types
- 6.2. Market Analysis, Insights and Forecast - by End-user Industry
- 6.2.1. Power Industry
- 6.2.2. Steel, Mining & Metallurgy
- 6.2.3. Petrochemicals and Oil and Gas
- 6.2.4. Food and Beverage
- 6.2.5. Textile and Dyes
- 6.2.6. Other End-user Industries
- 6.1. Market Analysis, Insights and Forecast - by Type
- 7. Asia Pacific Cooling Water Treatment Chemicals Market Analysis, Insights and Forecast, 2020-2032
- 7.1. Market Analysis, Insights and Forecast - by Type
- 7.1.1. Corrosion Inhibitor
- 7.1.2. Scale Inhibitor
- 7.1.3. Biocide
- 7.1.4. Other Types
- 7.2. Market Analysis, Insights and Forecast - by End-user Industry
- 7.2.1. Power Industry
- 7.2.2. Steel, Mining & Metallurgy
- 7.2.3. Petrochemicals and Oil and Gas
- 7.2.4. Food and Beverage
- 7.2.5. Textile and Dyes
- 7.2.6. Other End-user Industries
- 7.1. Market Analysis, Insights and Forecast - by Type
- 8. North America Cooling Water Treatment Chemicals Market Analysis, Insights and Forecast, 2020-2032
- 8.1. Market Analysis, Insights and Forecast - by Type
- 8.1.1. Corrosion Inhibitor
- 8.1.2. Scale Inhibitor
- 8.1.3. Biocide
- 8.1.4. Other Types
- 8.2. Market Analysis, Insights and Forecast - by End-user Industry
- 8.2.1. Power Industry
- 8.2.2. Steel, Mining & Metallurgy
- 8.2.3. Petrochemicals and Oil and Gas
- 8.2.4. Food and Beverage
- 8.2.5. Textile and Dyes
- 8.2.6. Other End-user Industries
- 8.1. Market Analysis, Insights and Forecast - by Type
- 9. Europe Cooling Water Treatment Chemicals Market Analysis, Insights and Forecast, 2020-2032
- 9.1. Market Analysis, Insights and Forecast - by Type
- 9.1.1. Corrosion Inhibitor
- 9.1.2. Scale Inhibitor
- 9.1.3. Biocide
- 9.1.4. Other Types
- 9.2. Market Analysis, Insights and Forecast - by End-user Industry
- 9.2.1. Power Industry
- 9.2.2. Steel, Mining & Metallurgy
- 9.2.3. Petrochemicals and Oil and Gas
- 9.2.4. Food and Beverage
- 9.2.5. Textile and Dyes
- 9.2.6. Other End-user Industries
- 9.1. Market Analysis, Insights and Forecast - by Type
- 10. South America Cooling Water Treatment Chemicals Market Analysis, Insights and Forecast, 2020-2032
- 10.1. Market Analysis, Insights and Forecast - by Type
- 10.1.1. Corrosion Inhibitor
- 10.1.2. Scale Inhibitor
- 10.1.3. Biocide
- 10.1.4. Other Types
- 10.2. Market Analysis, Insights and Forecast - by End-user Industry
- 10.2.1. Power Industry
- 10.2.2. Steel, Mining & Metallurgy
- 10.2.3. Petrochemicals and Oil and Gas
- 10.2.4. Food and Beverage
- 10.2.5. Textile and Dyes
- 10.2.6. Other End-user Industries
- 10.1. Market Analysis, Insights and Forecast - by Type
- 11. Middle East Cooling Water Treatment Chemicals Market Analysis, Insights and Forecast, 2020-2032
- 11.1. Market Analysis, Insights and Forecast - by Type
- 11.1.1. Corrosion Inhibitor
- 11.1.2. Scale Inhibitor
- 11.1.3. Biocide
- 11.1.4. Other Types
- 11.2. Market Analysis, Insights and Forecast - by End-user Industry
- 11.2.1. Power Industry
- 11.2.2. Steel, Mining & Metallurgy
- 11.2.3. Petrochemicals and Oil and Gas
- 11.2.4. Food and Beverage
- 11.2.5. Textile and Dyes
- 11.2.6. Other End-user Industries
- 11.1. Market Analysis, Insights and Forecast - by Type
- 12. Saudi Arabia Cooling Water Treatment Chemicals Market Analysis, Insights and Forecast, 2020-2032
- 12.1. Market Analysis, Insights and Forecast - by Type
- 12.1.1. Corrosion Inhibitor
- 12.1.2. Scale Inhibitor
- 12.1.3. Biocide
- 12.1.4. Other Types
- 12.2. Market Analysis, Insights and Forecast - by End-user Industry
- 12.2.1. Power Industry
- 12.2.2. Steel, Mining & Metallurgy
- 12.2.3. Petrochemicals and Oil and Gas
- 12.2.4. Food and Beverage
- 12.2.5. Textile and Dyes
- 12.2.6. Other End-user Industries
- 12.1. Market Analysis, Insights and Forecast - by Type
- 13. Competitive Analysis
- 13.1. Company Profiles
- 13.1.1 Ecolab
- 13.1.1.1. Company Overview
- 13.1.1.2. Products
- 13.1.1.3. Company Financials
- 13.1.1.4. SWOT Analysis
- 13.1.2 Chemtex Speciality Limited
- 13.1.2.1. Company Overview
- 13.1.2.2. Products
- 13.1.2.3. Company Financials
- 13.1.2.4. SWOT Analysis
- 13.1.3 Thermax Limited
- 13.1.3.1. Company Overview
- 13.1.3.2. Products
- 13.1.3.3. Company Financials
- 13.1.3.4. SWOT Analysis
- 13.1.4 Nouryon
- 13.1.4.1. Company Overview
- 13.1.4.2. Products
- 13.1.4.3. Company Financials
- 13.1.4.4. SWOT Analysis
- 13.1.5 Chemtrade Logistics
- 13.1.5.1. Company Overview
- 13.1.5.2. Products
- 13.1.5.3. Company Financials
- 13.1.5.4. SWOT Analysis
- 13.1.6 Buckman
- 13.1.6.1. Company Overview
- 13.1.6.2. Products
- 13.1.6.3. Company Financials
- 13.1.6.4. SWOT Analysis
- 13.1.7 Kemira
- 13.1.7.1. Company Overview
- 13.1.7.2. Products
- 13.1.7.3. Company Financials
- 13.1.7.4. SWOT Analysis
- 13.1.8 DuPont
- 13.1.8.1. Company Overview
- 13.1.8.2. Products
- 13.1.8.3. Company Financials
- 13.1.8.4. SWOT Analysis
- 13.1.9 Solenis
- 13.1.9.1. Company Overview
- 13.1.9.2. Products
- 13.1.9.3. Company Financials
- 13.1.9.4. SWOT Analysis
- 13.1.10 Italmatch Chemicals
- 13.1.10.1. Company Overview
- 13.1.10.2. Products
- 13.1.10.3. Company Financials
- 13.1.10.4. SWOT Analysis
- 13.1.11 Suez
- 13.1.11.1. Company Overview
- 13.1.11.2. Products
- 13.1.11.3. Company Financials
- 13.1.11.4. SWOT Analysis
- 13.1.12 Veolia
- 13.1.12.1. Company Overview
- 13.1.12.2. Products
- 13.1.12.3. Company Financials
- 13.1.12.4. SWOT Analysis
- 13.1.13 Albemarle Corporation
- 13.1.13.1. Company Overview
- 13.1.13.2. Products
- 13.1.13.3. Company Financials
- 13.1.13.4. SWOT Analysis
- 13.1.14 DuBois Chemicals
- 13.1.14.1. Company Overview
- 13.1.14.2. Products
- 13.1.14.3. Company Financials
- 13.1.14.4. SWOT Analysis
- 13.1.1 Ecolab
- 13.2. Market Entropy
- 13.2.1 Company's Key Areas Served
- 13.2.2 Recent Developments
- 13.3. Company Market Share Analysis 2025
- 13.3.1 Top 5 Companies Market Share Analysis
- 13.3.2 Top 3 Companies Market Share Analysis
- 13.4. List of Potential Customers
- 14. Research Methodology
List of Figures
- Figure 1: Global Cooling Water Treatment Chemicals Market Revenue Breakdown (Billion, %) by Region 2025 & 2033
- Figure 2: Global Cooling Water Treatment Chemicals Market Volume Breakdown (K Tons, %) by Region 2025 & 2033
- Figure 3: Asia Pacific Cooling Water Treatment Chemicals Market Revenue (Billion), by Type 2025 & 2033
- Figure 4: Asia Pacific Cooling Water Treatment Chemicals Market Volume (K Tons), by Type 2025 & 2033
- Figure 5: Asia Pacific Cooling Water Treatment Chemicals Market Revenue Share (%), by Type 2025 & 2033
- Figure 6: Asia Pacific Cooling Water Treatment Chemicals Market Volume Share (%), by Type 2025 & 2033
- Figure 7: Asia Pacific Cooling Water Treatment Chemicals Market Revenue (Billion), by End-user Industry 2025 & 2033
- Figure 8: Asia Pacific Cooling Water Treatment Chemicals Market Volume (K Tons), by End-user Industry 2025 & 2033
- Figure 9: Asia Pacific Cooling Water Treatment Chemicals Market Revenue Share (%), by End-user Industry 2025 & 2033
- Figure 10: Asia Pacific Cooling Water Treatment Chemicals Market Volume Share (%), by End-user Industry 2025 & 2033
- Figure 11: Asia Pacific Cooling Water Treatment Chemicals Market Revenue (Billion), by Country 2025 & 2033
- Figure 12: Asia Pacific Cooling Water Treatment Chemicals Market Volume (K Tons), by Country 2025 & 2033
- Figure 13: Asia Pacific Cooling Water Treatment Chemicals Market Revenue Share (%), by Country 2025 & 2033
- Figure 14: Asia Pacific Cooling Water Treatment Chemicals Market Volume Share (%), by Country 2025 & 2033
- Figure 15: North America Cooling Water Treatment Chemicals Market Revenue (Billion), by Type 2025 & 2033
- Figure 16: North America Cooling Water Treatment Chemicals Market Volume (K Tons), by Type 2025 & 2033
- Figure 17: North America Cooling Water Treatment Chemicals Market Revenue Share (%), by Type 2025 & 2033
- Figure 18: North America Cooling Water Treatment Chemicals Market Volume Share (%), by Type 2025 & 2033
- Figure 19: North America Cooling Water Treatment Chemicals Market Revenue (Billion), by End-user Industry 2025 & 2033
- Figure 20: North America Cooling Water Treatment Chemicals Market Volume (K Tons), by End-user Industry 2025 & 2033
- Figure 21: North America Cooling Water Treatment Chemicals Market Revenue Share (%), by End-user Industry 2025 & 2033
- Figure 22: North America Cooling Water Treatment Chemicals Market Volume Share (%), by End-user Industry 2025 & 2033
- Figure 23: North America Cooling Water Treatment Chemicals Market Revenue (Billion), by Country 2025 & 2033
- Figure 24: North America Cooling Water Treatment Chemicals Market Volume (K Tons), by Country 2025 & 2033
- Figure 25: North America Cooling Water Treatment Chemicals Market Revenue Share (%), by Country 2025 & 2033
- Figure 26: North America Cooling Water Treatment Chemicals Market Volume Share (%), by Country 2025 & 2033
- Figure 27: Europe Cooling Water Treatment Chemicals Market Revenue (Billion), by Type 2025 & 2033
- Figure 28: Europe Cooling Water Treatment Chemicals Market Volume (K Tons), by Type 2025 & 2033
- Figure 29: Europe Cooling Water Treatment Chemicals Market Revenue Share (%), by Type 2025 & 2033
- Figure 30: Europe Cooling Water Treatment Chemicals Market Volume Share (%), by Type 2025 & 2033
- Figure 31: Europe Cooling Water Treatment Chemicals Market Revenue (Billion), by End-user Industry 2025 & 2033
- Figure 32: Europe Cooling Water Treatment Chemicals Market Volume (K Tons), by End-user Industry 2025 & 2033
- Figure 33: Europe Cooling Water Treatment Chemicals Market Revenue Share (%), by End-user Industry 2025 & 2033
- Figure 34: Europe Cooling Water Treatment Chemicals Market Volume Share (%), by End-user Industry 2025 & 2033
- Figure 35: Europe Cooling Water Treatment Chemicals Market Revenue (Billion), by Country 2025 & 2033
- Figure 36: Europe Cooling Water Treatment Chemicals Market Volume (K Tons), by Country 2025 & 2033
- Figure 37: Europe Cooling Water Treatment Chemicals Market Revenue Share (%), by Country 2025 & 2033
- Figure 38: Europe Cooling Water Treatment Chemicals Market Volume Share (%), by Country 2025 & 2033
- Figure 39: South America Cooling Water Treatment Chemicals Market Revenue (Billion), by Type 2025 & 2033
- Figure 40: South America Cooling Water Treatment Chemicals Market Volume (K Tons), by Type 2025 & 2033
- Figure 41: South America Cooling Water Treatment Chemicals Market Revenue Share (%), by Type 2025 & 2033
- Figure 42: South America Cooling Water Treatment Chemicals Market Volume Share (%), by Type 2025 & 2033
- Figure 43: South America Cooling Water Treatment Chemicals Market Revenue (Billion), by End-user Industry 2025 & 2033
- Figure 44: South America Cooling Water Treatment Chemicals Market Volume (K Tons), by End-user Industry 2025 & 2033
- Figure 45: South America Cooling Water Treatment Chemicals Market Revenue Share (%), by End-user Industry 2025 & 2033
- Figure 46: South America Cooling Water Treatment Chemicals Market Volume Share (%), by End-user Industry 2025 & 2033
- Figure 47: South America Cooling Water Treatment Chemicals Market Revenue (Billion), by Country 2025 & 2033
- Figure 48: South America Cooling Water Treatment Chemicals Market Volume (K Tons), by Country 2025 & 2033
- Figure 49: South America Cooling Water Treatment Chemicals Market Revenue Share (%), by Country 2025 & 2033
- Figure 50: South America Cooling Water Treatment Chemicals Market Volume Share (%), by Country 2025 & 2033
- Figure 51: Middle East Cooling Water Treatment Chemicals Market Revenue (Billion), by Type 2025 & 2033
- Figure 52: Middle East Cooling Water Treatment Chemicals Market Volume (K Tons), by Type 2025 & 2033
- Figure 53: Middle East Cooling Water Treatment Chemicals Market Revenue Share (%), by Type 2025 & 2033
- Figure 54: Middle East Cooling Water Treatment Chemicals Market Volume Share (%), by Type 2025 & 2033
- Figure 55: Middle East Cooling Water Treatment Chemicals Market Revenue (Billion), by End-user Industry 2025 & 2033
- Figure 56: Middle East Cooling Water Treatment Chemicals Market Volume (K Tons), by End-user Industry 2025 & 2033
- Figure 57: Middle East Cooling Water Treatment Chemicals Market Revenue Share (%), by End-user Industry 2025 & 2033
- Figure 58: Middle East Cooling Water Treatment Chemicals Market Volume Share (%), by End-user Industry 2025 & 2033
- Figure 59: Middle East Cooling Water Treatment Chemicals Market Revenue (Billion), by Country 2025 & 2033
- Figure 60: Middle East Cooling Water Treatment Chemicals Market Volume (K Tons), by Country 2025 & 2033
- Figure 61: Middle East Cooling Water Treatment Chemicals Market Revenue Share (%), by Country 2025 & 2033
- Figure 62: Middle East Cooling Water Treatment Chemicals Market Volume Share (%), by Country 2025 & 2033
- Figure 63: Saudi Arabia Cooling Water Treatment Chemicals Market Revenue (Billion), by Type 2025 & 2033
- Figure 64: Saudi Arabia Cooling Water Treatment Chemicals Market Volume (K Tons), by Type 2025 & 2033
- Figure 65: Saudi Arabia Cooling Water Treatment Chemicals Market Revenue Share (%), by Type 2025 & 2033
- Figure 66: Saudi Arabia Cooling Water Treatment Chemicals Market Volume Share (%), by Type 2025 & 2033
- Figure 67: Saudi Arabia Cooling Water Treatment Chemicals Market Revenue (Billion), by End-user Industry 2025 & 2033
- Figure 68: Saudi Arabia Cooling Water Treatment Chemicals Market Volume (K Tons), by End-user Industry 2025 & 2033
- Figure 69: Saudi Arabia Cooling Water Treatment Chemicals Market Revenue Share (%), by End-user Industry 2025 & 2033
- Figure 70: Saudi Arabia Cooling Water Treatment Chemicals Market Volume Share (%), by End-user Industry 2025 & 2033
- Figure 71: Saudi Arabia Cooling Water Treatment Chemicals Market Revenue (Billion), by Country 2025 & 2033
- Figure 72: Saudi Arabia Cooling Water Treatment Chemicals Market Volume (K Tons), by Country 2025 & 2033
- Figure 73: Saudi Arabia Cooling Water Treatment Chemicals Market Revenue Share (%), by Country 2025 & 2033
- Figure 74: Saudi Arabia Cooling Water Treatment Chemicals Market Volume Share (%), by Country 2025 & 2033
List of Tables
- Table 1: Global Cooling Water Treatment Chemicals Market Revenue Billion Forecast, by Type 2020 & 2033
- Table 2: Global Cooling Water Treatment Chemicals Market Volume K Tons Forecast, by Type 2020 & 2033
- Table 3: Global Cooling Water Treatment Chemicals Market Revenue Billion Forecast, by End-user Industry 2020 & 2033
- Table 4: Global Cooling Water Treatment Chemicals Market Volume K Tons Forecast, by End-user Industry 2020 & 2033
- Table 5: Global Cooling Water Treatment Chemicals Market Revenue Billion Forecast, by Region 2020 & 2033
- Table 6: Global Cooling Water Treatment Chemicals Market Volume K Tons Forecast, by Region 2020 & 2033
- Table 7: Global Cooling Water Treatment Chemicals Market Revenue Billion Forecast, by Type 2020 & 2033
- Table 8: Global Cooling Water Treatment Chemicals Market Volume K Tons Forecast, by Type 2020 & 2033
- Table 9: Global Cooling Water Treatment Chemicals Market Revenue Billion Forecast, by End-user Industry 2020 & 2033
- Table 10: Global Cooling Water Treatment Chemicals Market Volume K Tons Forecast, by End-user Industry 2020 & 2033
- Table 11: Global Cooling Water Treatment Chemicals Market Revenue Billion Forecast, by Country 2020 & 2033
- Table 12: Global Cooling Water Treatment Chemicals Market Volume K Tons Forecast, by Country 2020 & 2033
- Table 13: China Cooling Water Treatment Chemicals Market Revenue (Billion) Forecast, by Application 2020 & 2033
- Table 14: China Cooling Water Treatment Chemicals Market Volume (K Tons) Forecast, by Application 2020 & 2033
- Table 15: India Cooling Water Treatment Chemicals Market Revenue (Billion) Forecast, by Application 2020 & 2033
- Table 16: India Cooling Water Treatment Chemicals Market Volume (K Tons) Forecast, by Application 2020 & 2033
- Table 17: Japan Cooling Water Treatment Chemicals Market Revenue (Billion) Forecast, by Application 2020 & 2033
- Table 18: Japan Cooling Water Treatment Chemicals Market Volume (K Tons) Forecast, by Application 2020 & 2033
- Table 19: South Korea Cooling Water Treatment Chemicals Market Revenue (Billion) Forecast, by Application 2020 & 2033
- Table 20: South Korea Cooling Water Treatment Chemicals Market Volume (K Tons) Forecast, by Application 2020 & 2033
- Table 21: Rest of Asia Pacific Cooling Water Treatment Chemicals Market Revenue (Billion) Forecast, by Application 2020 & 2033
- Table 22: Rest of Asia Pacific Cooling Water Treatment Chemicals Market Volume (K Tons) Forecast, by Application 2020 & 2033
- Table 23: Global Cooling Water Treatment Chemicals Market Revenue Billion Forecast, by Type 2020 & 2033
- Table 24: Global Cooling Water Treatment Chemicals Market Volume K Tons Forecast, by Type 2020 & 2033
- Table 25: Global Cooling Water Treatment Chemicals Market Revenue Billion Forecast, by End-user Industry 2020 & 2033
- Table 26: Global Cooling Water Treatment Chemicals Market Volume K Tons Forecast, by End-user Industry 2020 & 2033
- Table 27: Global Cooling Water Treatment Chemicals Market Revenue Billion Forecast, by Country 2020 & 2033
- Table 28: Global Cooling Water Treatment Chemicals Market Volume K Tons Forecast, by Country 2020 & 2033
- Table 29: United States Cooling Water Treatment Chemicals Market Revenue (Billion) Forecast, by Application 2020 & 2033
- Table 30: United States Cooling Water Treatment Chemicals Market Volume (K Tons) Forecast, by Application 2020 & 2033
- Table 31: Canada Cooling Water Treatment Chemicals Market Revenue (Billion) Forecast, by Application 2020 & 2033
- Table 32: Canada Cooling Water Treatment Chemicals Market Volume (K Tons) Forecast, by Application 2020 & 2033
- Table 33: Mexico Cooling Water Treatment Chemicals Market Revenue (Billion) Forecast, by Application 2020 & 2033
- Table 34: Mexico Cooling Water Treatment Chemicals Market Volume (K Tons) Forecast, by Application 2020 & 2033
- Table 35: Global Cooling Water Treatment Chemicals Market Revenue Billion Forecast, by Type 2020 & 2033
- Table 36: Global Cooling Water Treatment Chemicals Market Volume K Tons Forecast, by Type 2020 & 2033
- Table 37: Global Cooling Water Treatment Chemicals Market Revenue Billion Forecast, by End-user Industry 2020 & 2033
- Table 38: Global Cooling Water Treatment Chemicals Market Volume K Tons Forecast, by End-user Industry 2020 & 2033
- Table 39: Global Cooling Water Treatment Chemicals Market Revenue Billion Forecast, by Country 2020 & 2033
- Table 40: Global Cooling Water Treatment Chemicals Market Volume K Tons Forecast, by Country 2020 & 2033
- Table 41: Germany Cooling Water Treatment Chemicals Market Revenue (Billion) Forecast, by Application 2020 & 2033
- Table 42: Germany Cooling Water Treatment Chemicals Market Volume (K Tons) Forecast, by Application 2020 & 2033
- Table 43: United Kingdom Cooling Water Treatment Chemicals Market Revenue (Billion) Forecast, by Application 2020 & 2033
- Table 44: United Kingdom Cooling Water Treatment Chemicals Market Volume (K Tons) Forecast, by Application 2020 & 2033
- Table 45: France Cooling Water Treatment Chemicals Market Revenue (Billion) Forecast, by Application 2020 & 2033
- Table 46: France Cooling Water Treatment Chemicals Market Volume (K Tons) Forecast, by Application 2020 & 2033
- Table 47: Italy Cooling Water Treatment Chemicals Market Revenue (Billion) Forecast, by Application 2020 & 2033
- Table 48: Italy Cooling Water Treatment Chemicals Market Volume (K Tons) Forecast, by Application 2020 & 2033
- Table 49: Rest of Europe Cooling Water Treatment Chemicals Market Revenue (Billion) Forecast, by Application 2020 & 2033
- Table 50: Rest of Europe Cooling Water Treatment Chemicals Market Volume (K Tons) Forecast, by Application 2020 & 2033
- Table 51: Global Cooling Water Treatment Chemicals Market Revenue Billion Forecast, by Type 2020 & 2033
- Table 52: Global Cooling Water Treatment Chemicals Market Volume K Tons Forecast, by Type 2020 & 2033
- Table 53: Global Cooling Water Treatment Chemicals Market Revenue Billion Forecast, by End-user Industry 2020 & 2033
- Table 54: Global Cooling Water Treatment Chemicals Market Volume K Tons Forecast, by End-user Industry 2020 & 2033
- Table 55: Global Cooling Water Treatment Chemicals Market Revenue Billion Forecast, by Country 2020 & 2033
- Table 56: Global Cooling Water Treatment Chemicals Market Volume K Tons Forecast, by Country 2020 & 2033
- Table 57: Brazil Cooling Water Treatment Chemicals Market Revenue (Billion) Forecast, by Application 2020 & 2033
- Table 58: Brazil Cooling Water Treatment Chemicals Market Volume (K Tons) Forecast, by Application 2020 & 2033
- Table 59: Argentina Cooling Water Treatment Chemicals Market Revenue (Billion) Forecast, by Application 2020 & 2033
- Table 60: Argentina Cooling Water Treatment Chemicals Market Volume (K Tons) Forecast, by Application 2020 & 2033
- Table 61: Rest of South America Cooling Water Treatment Chemicals Market Revenue (Billion) Forecast, by Application 2020 & 2033
- Table 62: Rest of South America Cooling Water Treatment Chemicals Market Volume (K Tons) Forecast, by Application 2020 & 2033
- Table 63: Global Cooling Water Treatment Chemicals Market Revenue Billion Forecast, by Type 2020 & 2033
- Table 64: Global Cooling Water Treatment Chemicals Market Volume K Tons Forecast, by Type 2020 & 2033
- Table 65: Global Cooling Water Treatment Chemicals Market Revenue Billion Forecast, by End-user Industry 2020 & 2033
- Table 66: Global Cooling Water Treatment Chemicals Market Volume K Tons Forecast, by End-user Industry 2020 & 2033
- Table 67: Global Cooling Water Treatment Chemicals Market Revenue Billion Forecast, by Country 2020 & 2033
- Table 68: Global Cooling Water Treatment Chemicals Market Volume K Tons Forecast, by Country 2020 & 2033
- Table 69: Global Cooling Water Treatment Chemicals Market Revenue Billion Forecast, by Type 2020 & 2033
- Table 70: Global Cooling Water Treatment Chemicals Market Volume K Tons Forecast, by Type 2020 & 2033
- Table 71: Global Cooling Water Treatment Chemicals Market Revenue Billion Forecast, by End-user Industry 2020 & 2033
- Table 72: Global Cooling Water Treatment Chemicals Market Volume K Tons Forecast, by End-user Industry 2020 & 2033
- Table 73: Global Cooling Water Treatment Chemicals Market Revenue Billion Forecast, by Country 2020 & 2033
- Table 74: Global Cooling Water Treatment Chemicals Market Volume K Tons Forecast, by Country 2020 & 2033
- Table 75: South Africa Cooling Water Treatment Chemicals Market Revenue (Billion) Forecast, by Application 2020 & 2033
- Table 76: South Africa Cooling Water Treatment Chemicals Market Volume (K Tons) Forecast, by Application 2020 & 2033
- Table 77: Rest of Middle East Cooling Water Treatment Chemicals Market Revenue (Billion) Forecast, by Application 2020 & 2033
- Table 78: Rest of Middle East Cooling Water Treatment Chemicals Market Volume (K Tons) Forecast, by Application 2020 & 2033
Frequently Asked Questions
1. What is the projected Compound Annual Growth Rate (CAGR) of the Cooling Water Treatment Chemicals Market?
The projected CAGR is approximately 5.8%.
2. Which companies are prominent players in the Cooling Water Treatment Chemicals Market?
Key companies in the market include Ecolab, Chemtex Speciality Limited, Thermax Limited, Nouryon, Chemtrade Logistics, Buckman, Kemira, DuPont, Solenis, Italmatch Chemicals, Suez, Veolia, Albemarle Corporation, DuBois Chemicals.
3. What are the main segments of the Cooling Water Treatment Chemicals Market?
The market segments include Type, End-user Industry.
4. Can you provide details about the market size?
The market size is estimated to be USD 11.8 Billion as of 2022.
5. What are some drivers contributing to market growth?
Accelerating Growth of the Power Industry; Growing Popularity of Zero-liquid Blowdown.
6. What are the notable trends driving market growth?
Power Industry to Dominate the Market.
7. Are there any restraints impacting market growth?
Lack of Awareness about Cooling Water Treatment; Increasing Popularity of Chlorine Alternatives.
8. Can you provide examples of recent developments in the market?
October 2022: Italmatch Chemicals company introduced a new Smart-Tagged Polymers brand line specialized for Industrial Water Treatment solutions. It is a cutting-edge smart solution for Cooling Tower applications and a significant step forward in digitalizing chemical treatment performance control.
9. What pricing options are available for accessing the report?
Pricing options include single-user, multi-user, and enterprise licenses priced at USD 3,950, USD 4,950, and USD 6,950 respectively.
10. Is the market size provided in terms of value or volume?
The market size is provided in terms of value, measured in Billion and volume, measured in K Tons.
11. Are there any specific market keywords associated with the report?
Yes, the market keyword associated with the report is "Cooling Water Treatment Chemicals Market," which aids in identifying and referencing the specific market segment covered.
12. How do I determine which pricing option suits my needs best?
The pricing options vary based on user requirements and access needs. Individual users may opt for single-user licenses, while businesses requiring broader access may choose multi-user or enterprise licenses for cost-effective access to the report.
13. Are there any additional resources or data provided in the Cooling Water Treatment Chemicals Market report?
While the report offers comprehensive insights, it's advisable to review the specific contents or supplementary materials provided to ascertain if additional resources or data are available.
14. How can I stay updated on further developments or reports in the Cooling Water Treatment Chemicals Market?
To stay informed about further developments, trends, and reports in the Cooling Water Treatment Chemicals Market, consider subscribing to industry newsletters, following relevant companies and organizations, or regularly checking reputable industry news sources and publications.
Methodology
Step 1 - Identification of Relevant Samples Size from Population Database


Step 2 - Approaches for Defining Global Market Size (Value, Volume* & Price*)

Note*: In applicable scenarios
Step 3 - Data Sources
Primary Research
- Web Analytics
- Survey Reports
- Research Institute
- Latest Research Reports
- Opinion Leaders
Secondary Research
- Annual Reports
- White Paper
- Latest Press Release
- Industry Association
- Paid Database
- Investor Presentations

Step 4 - Data Triangulation
Involves using different sources of information in order to increase the validity of a study
These sources are likely to be stakeholders in a program - participants, other researchers, program staff, other community members, and so on.
Then we put all data in single framework & apply various statistical tools to find out the dynamic on the market.
During the analysis stage, feedback from the stakeholder groups would be compared to determine areas of agreement as well as areas of divergence