

Key Insights
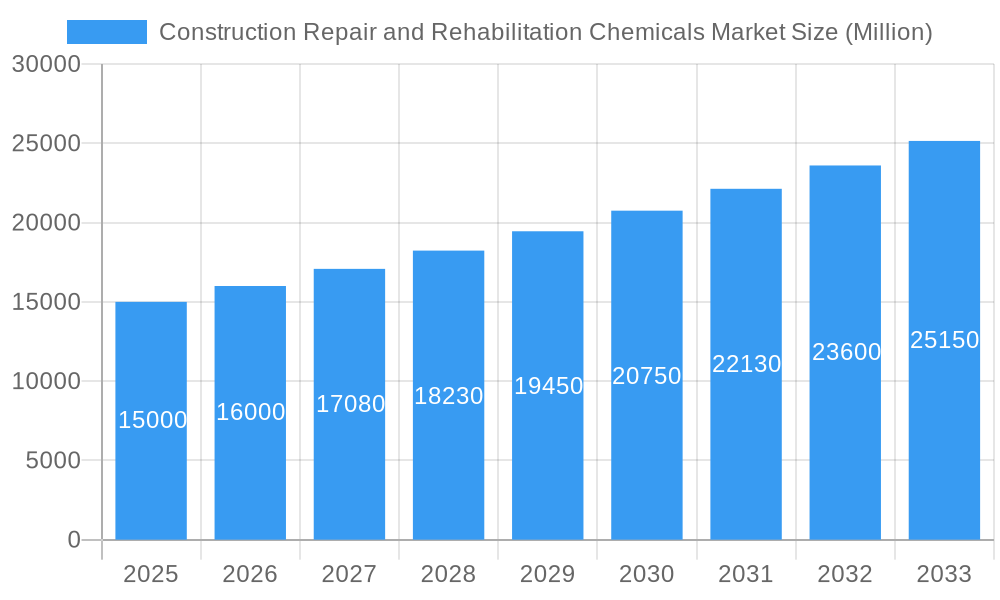
The Construction Repair and Rehabilitation Chemicals market is experiencing robust growth, projected to reach a significant value by 2033, driven by a CAGR of 6.6%. This expansion is fueled by several key factors. The increasing age of infrastructure globally necessitates extensive repair and rehabilitation efforts, creating a substantial demand for these specialized chemicals. Furthermore, the rising focus on sustainable construction practices and extending the lifespan of existing buildings is bolstering market growth. Growing urbanization and population density in many regions further contribute to the demand for efficient and durable repair solutions. The market is segmented by end-use sector (commercial, industrial, residential, and infrastructure) and sub-product (fiber wrapping systems, injection grouting materials, micro-concrete mortars, modified mortars, and rebar protectors). While the residential sector currently holds a considerable share, the infrastructure segment is poised for substantial growth due to large-scale public works projects and increasing government investments in infrastructure modernization. Leading players like Remmers Gruppe AG, Saint-Gobain, and Sika AG are leveraging technological advancements and strategic acquisitions to strengthen their market positions and cater to the evolving needs of the construction industry. Competitive pressures and pricing strategies also play a significant role in shaping market dynamics. Challenges such as fluctuating raw material prices and stringent environmental regulations represent potential restraints, but ongoing innovation in chemical formulations and sustainable solutions are mitigating these concerns.
Construction Repair and Rehabilitation Chemicals Market Market Size (In Billion)
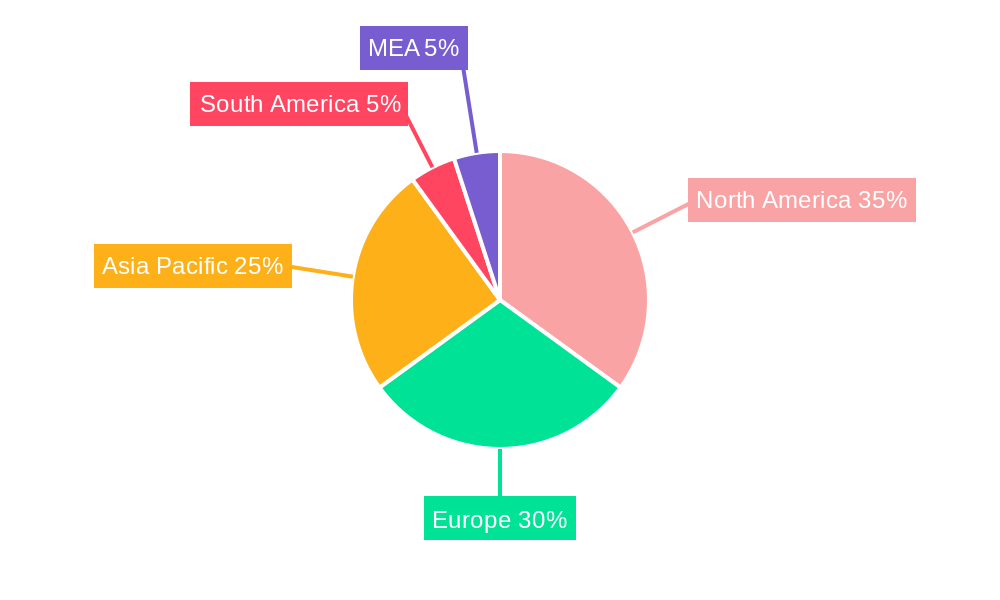
The market's geographic distribution reflects global construction activity. North America and Europe currently hold substantial market shares due to established infrastructure and high construction activity. However, the Asia-Pacific region is expected to witness the most significant growth in the coming years, driven by rapid urbanization and infrastructure development in countries like China and India. This presents lucrative opportunities for market participants willing to capitalize on these emerging markets. The continued focus on enhancing building durability, improving energy efficiency, and addressing climate change resilience will further propel the growth of this market in the long term. The strategic partnerships and mergers and acquisitions within the industry are shaping the competitive landscape, leading to product innovation and expansion into new geographical territories.
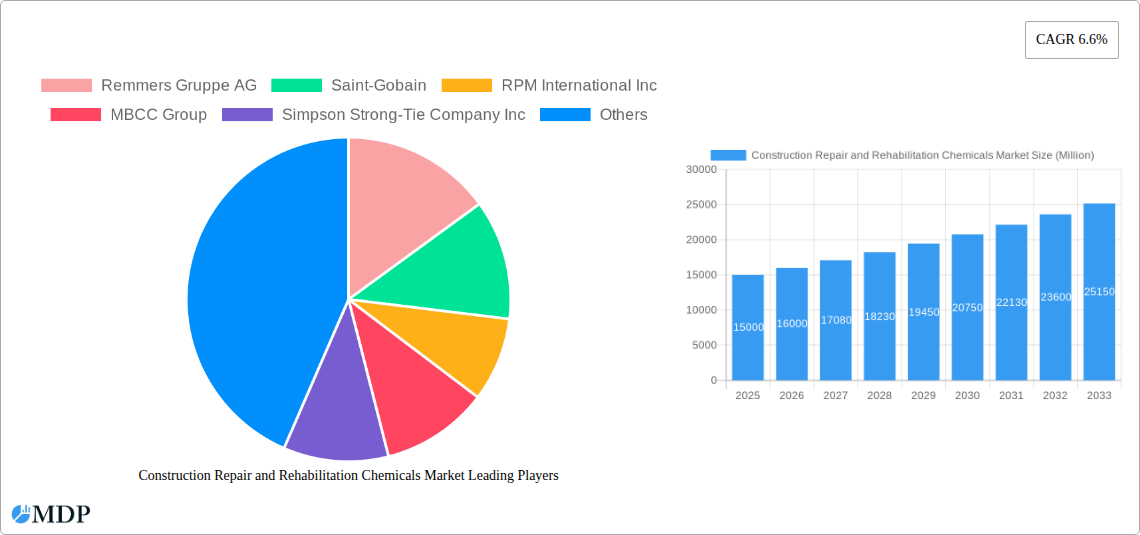
Construction Repair and Rehabilitation Chemicals Market Company Market Share
Construction Repair and Rehabilitation Chemicals Market: A Comprehensive Report (2019-2033)
This comprehensive report provides a detailed analysis of the global Construction Repair and Rehabilitation Chemicals market, offering valuable insights for industry stakeholders, investors, and strategic decision-makers. The study period covers 2019-2033, with 2025 serving as the base and estimated year. The report projects market growth from 2025 to 2033, building upon historical data from 2019-2024. The market is segmented by end-use sector (Commercial, Industrial and Institutional, Infrastructure, Residential) and sub-product (Fiber Wrapping Systems, Injection Grouting Materials, Micro-concrete Mortars, Modified Mortars, Rebar Protectors). Key players like Remmers Gruppe AG, Saint-Gobain, RPM International Inc, MBCC Group, Simpson Strong-Tie Company Inc, Fosroc Inc, Ardex Group, MAPEI S p A, Sika AG, and MC-Bauchemie are profiled, providing a competitive landscape analysis. The report projects a market value of xx Million by 2033.
Construction Repair and Rehabilitation Chemicals Market Market Dynamics & Concentration
The Construction Repair and Rehabilitation Chemicals market is characterized by moderate concentration, with several major players holding significant market share. Market dynamics are influenced by several key factors:
- Innovation Drivers: Continuous research and development efforts drive the introduction of high-performance, sustainable, and user-friendly products, catering to the evolving needs of the construction industry. This includes advancements in material science leading to improved durability, strength, and ease of application.
- Regulatory Frameworks: Stringent environmental regulations and building codes influence product formulation and manufacturing processes, pushing companies towards eco-friendly and sustainable solutions. Variations in these regulations across different geographies also influence market dynamics.
- Product Substitutes: The availability of alternative repair and rehabilitation methods and materials (e.g., traditional methods) presents a degree of competitive pressure. However, the advantages offered by chemical solutions in terms of efficiency and durability often outweigh these alternatives.
- End-User Trends: Growing urbanization, infrastructure development projects, and the increasing need for building renovation and maintenance contribute to market expansion. The demand for energy-efficient and sustainable construction practices also plays a crucial role.
- M&A Activities: The market has witnessed significant mergers and acquisitions (M&A) activity in recent years, exemplified by Sika's acquisition of MBCC Group in May 2023. This consolidation trend impacts market share distribution and competitive dynamics. We estimate approximately xx M&A deals occurred within the study period, with a significant increase in the last three years. The average deal value is estimated at xx Million. Market share held by the top 5 players is approximately xx%.
Construction Repair and Rehabilitation Chemicals Market Industry Trends & Analysis
The global Construction Repair and Rehabilitation Chemicals market is experiencing robust growth, driven by several key factors. The compound annual growth rate (CAGR) during the forecast period (2025-2033) is projected to be xx%. This growth is fueled by increasing infrastructure development and renovation activities worldwide, particularly in developing economies. Technological advancements are leading to the development of innovative and high-performance products, further stimulating market growth. Consumer preferences are shifting towards sustainable and eco-friendly construction materials, creating new opportunities for manufacturers. The market displays intense competitive rivalry, with leading players focusing on product innovation, expansion into new markets, and strategic partnerships to maintain their market position. Market penetration is highest within the developed regions, but rapid growth is expected within emerging markets due to rising infrastructure spending and government initiatives. Specific market segments demonstrate varying growth rates, with the residential sector currently exhibiting a comparatively slower CAGR (xx%) compared to the infrastructure sector (xx%), which is predicted to lead in market share increase over the coming decade.
Leading Markets & Segments in Construction Repair and Rehabilitation Chemicals Market
The Infrastructure segment currently dominates the Construction Repair and Rehabilitation Chemicals market globally, driven by large-scale infrastructure projects undertaken by governments and private entities. Regional dominance shifts slightly between regions depending on the specific sub-product, however, North America and Europe continue to hold the largest market share globally.
- Key Drivers for Infrastructure Segment:
- Extensive government investments in infrastructure development and modernization.
- Growing demand for durable and long-lasting infrastructure solutions.
- Stringent safety and environmental regulations for infrastructure projects.
- Increasing urbanization and population growth necessitating robust infrastructure.
- Key Drivers for Residential Segment:
- Growing demand for home renovations and improvements.
- Rising disposable incomes and improved living standards.
- Increasing preference for energy-efficient and sustainable housing.
- Sub-product Dominance: Injection grouting materials currently hold a significant market share due to their versatility and wide range of applications in various construction projects, followed closely by modified mortars.
Construction Repair and Rehabilitation Chemicals Market Product Developments
Recent advancements in construction repair and rehabilitation chemicals focus on improving performance characteristics such as strength, durability, and sustainability. Manufacturers are introducing innovative products like self-leveling mortars, rapid-setting repair compounds, and fiber-reinforced repair materials to address specific construction challenges. These innovations improve efficiency, reduce construction time, and enhance the overall quality of repair and rehabilitation work. The focus on eco-friendly and low-VOC (volatile organic compounds) products is also gaining traction, in line with increasing environmental awareness within the construction industry.
Key Drivers of Construction Repair and Rehabilitation Chemicals Market Growth
The growth of the Construction Repair and Rehabilitation Chemicals market is driven by several factors: increasing urbanization and infrastructure development leading to a higher demand for construction and repair activities; the rising need for building maintenance and renovation; growing adoption of sustainable and eco-friendly construction practices; stringent building codes and regulations necessitate the use of high-performance materials. Technological advancements are also a key factor, resulting in the development of innovative products with improved performance characteristics. For example, the development of self-healing concrete is expected to increase the need for specific repair and rehabilitation chemicals.
Challenges in the Construction Repair and Rehabilitation Chemicals Market Market
Several factors hinder the growth of the Construction Repair and Rehabilitation Chemicals market: fluctuations in raw material prices, impacting production costs and market profitability; supply chain disruptions can lead to delays in project completion and increased costs; intense competition among manufacturers necessitates ongoing product innovation and cost optimization. Strict environmental regulations may increase compliance costs for manufacturers. These challenges, which are expected to be persistent through at least 2033, negatively impact market growth by an estimated xx% annually.
Emerging Opportunities in Construction Repair and Rehabilitation Chemicals Market
The Construction Repair and Rehabilitation Chemicals market presents several promising opportunities. The growing adoption of Building Information Modeling (BIM) creates opportunities for chemical manufacturers to integrate their products into digital design and construction workflows. Strategic partnerships and collaborations with construction companies, architects, and engineers can expand market reach and create new business opportunities. Focus on developing innovative, sustainable, and high-performance products can attract environmentally conscious consumers. Market expansion into developing economies and regions undergoing significant infrastructure development projects offers substantial growth potential.
Leading Players in the Construction Repair and Rehabilitation Chemicals Market Sector
Key Milestones in Construction Repair and Rehabilitation Chemicals Market Industry
- June 2022: MAPEI commissioned a new manufacturing facility in Houston, Texas, to meet the growing demand for construction products, including repair & rehabilitation chemicals. This expansion demonstrates the company's commitment to meeting increasing market demand in North America.
- December 2022: Sika AG expanded its production capacity in China with a new facility in Chongqing, focusing on liquid waterproofing membranes and mortars. This signifies the company's strategic expansion in a key growth market for construction chemicals.
- May 2023: Sika acquired the MBCC Group, significantly expanding its portfolio of repair and rehabilitation chemicals and strengthening its market position. This acquisition significantly altered the competitive landscape of the market, making Sika a dominant player.
Strategic Outlook for Construction Repair and Rehabilitation Chemicals Market Market
The future of the Construction Repair and Rehabilitation Chemicals market looks bright, driven by continuous urbanization, infrastructure development, and growing demand for sustainable construction solutions. Strategic partnerships, technological innovations focusing on high-performance, eco-friendly products, and expansion into emerging markets will play a pivotal role in shaping future growth. Companies focusing on research and development, specifically in the area of self-healing materials and sustainable solutions, are expected to see significant growth opportunities.
Construction Repair and Rehabilitation Chemicals Market Segmentation
-
1. End Use Sector
- 1.1. Commercial
- 1.2. Industrial and Institutional
- 1.3. Infrastructure
- 1.4. Residential
-
2. Sub Product
- 2.1. Fiber Wrapping Systems
- 2.2. Injection Grouting Materials
- 2.3. Micro-concrete Mortars
- 2.4. Modified Mortars
- 2.5. Rebar Protectors
Construction Repair and Rehabilitation Chemicals Market Segmentation By Geography
-
1. North America
- 1.1. United States
- 1.2. Canada
- 1.3. Mexico
-
2. South America
- 2.1. Brazil
- 2.2. Argentina
- 2.3. Rest of South America
-
3. Europe
- 3.1. United Kingdom
- 3.2. Germany
- 3.3. France
- 3.4. Italy
- 3.5. Spain
- 3.6. Russia
- 3.7. Benelux
- 3.8. Nordics
- 3.9. Rest of Europe
-
4. Middle East & Africa
- 4.1. Turkey
- 4.2. Israel
- 4.3. GCC
- 4.4. North Africa
- 4.5. South Africa
- 4.6. Rest of Middle East & Africa
-
5. Asia Pacific
- 5.1. China
- 5.2. India
- 5.3. Japan
- 5.4. South Korea
- 5.5. ASEAN
- 5.6. Oceania
- 5.7. Rest of Asia Pacific
Construction Repair and Rehabilitation Chemicals Market Regional Market Share
Geographic Coverage of Construction Repair and Rehabilitation Chemicals Market
Construction Repair and Rehabilitation Chemicals Market REPORT HIGHLIGHTS
| Aspects | Details |
|---|---|
| Study Period | 2020-2034 |
| Base Year | 2025 |
| Estimated Year | 2026 |
| Forecast Period | 2026-2034 |
| Historical Period | 2020-2025 |
| Growth Rate | CAGR of 7.9% from 2020-2034 |
| Segmentation |
|
Table of Contents
- 1. Introduction
- 1.1. Research Scope
- 1.2. Market Segmentation
- 1.3. Research Objective
- 1.4. Definitions and Assumptions
- 2. Executive Summary
- 2.1. Market Snapshot
- 3. Market Dynamics
- 3.1. Market Drivers
- 3.2. Market Restrains
- 3.3. Market Trends
- 3.4. Market Opportunities
- 4. Market Factor Analysis
- 4.1. Porters Five Forces
- 4.1.1. Bargaining Power of Suppliers
- 4.1.2. Bargaining Power of Buyers
- 4.1.3. Threat of New Entrants
- 4.1.4. Threat of Substitutes
- 4.1.5. Competitive Rivalry
- 4.2. PESTEL analysis
- 4.3. BCG Analysis
- 4.3.1. Stars (High Growth, High Market Share)
- 4.3.2. Cash Cows (Low Growth, High Market Share)
- 4.3.3. Question Mark (High Growth, Low Market Share)
- 4.3.4. Dogs (Low Growth, Low Market Share)
- 4.4. Ansoff Matrix Analysis
- 4.5. Supply Chain Analysis
- 4.6. Regulatory Landscape
- 4.7. Current Market Potential and Opportunity Assessment (TAM–SAM–SOM Framework)
- 4.8. MDP Analyst Note
- 4.1. Porters Five Forces
- 5. Market Analysis, Insights and Forecast 2021-2033
- 5.1. Market Analysis, Insights and Forecast - by End Use Sector
- 5.1.1. Commercial
- 5.1.2. Industrial and Institutional
- 5.1.3. Infrastructure
- 5.1.4. Residential
- 5.2. Market Analysis, Insights and Forecast - by Sub Product
- 5.2.1. Fiber Wrapping Systems
- 5.2.2. Injection Grouting Materials
- 5.2.3. Micro-concrete Mortars
- 5.2.4. Modified Mortars
- 5.2.5. Rebar Protectors
- 5.3. Market Analysis, Insights and Forecast - by Region
- 5.3.1. North America
- 5.3.2. South America
- 5.3.3. Europe
- 5.3.4. Middle East & Africa
- 5.3.5. Asia Pacific
- 5.1. Market Analysis, Insights and Forecast - by End Use Sector
- 6. Global Construction Repair and Rehabilitation Chemicals Market Analysis, Insights and Forecast, 2021-2033
- 6.1. Market Analysis, Insights and Forecast - by End Use Sector
- 6.1.1. Commercial
- 6.1.2. Industrial and Institutional
- 6.1.3. Infrastructure
- 6.1.4. Residential
- 6.2. Market Analysis, Insights and Forecast - by Sub Product
- 6.2.1. Fiber Wrapping Systems
- 6.2.2. Injection Grouting Materials
- 6.2.3. Micro-concrete Mortars
- 6.2.4. Modified Mortars
- 6.2.5. Rebar Protectors
- 6.1. Market Analysis, Insights and Forecast - by End Use Sector
- 7. North America Construction Repair and Rehabilitation Chemicals Market Analysis, Insights and Forecast, 2020-2032
- 7.1. Market Analysis, Insights and Forecast - by End Use Sector
- 7.1.1. Commercial
- 7.1.2. Industrial and Institutional
- 7.1.3. Infrastructure
- 7.1.4. Residential
- 7.2. Market Analysis, Insights and Forecast - by Sub Product
- 7.2.1. Fiber Wrapping Systems
- 7.2.2. Injection Grouting Materials
- 7.2.3. Micro-concrete Mortars
- 7.2.4. Modified Mortars
- 7.2.5. Rebar Protectors
- 7.1. Market Analysis, Insights and Forecast - by End Use Sector
- 8. South America Construction Repair and Rehabilitation Chemicals Market Analysis, Insights and Forecast, 2020-2032
- 8.1. Market Analysis, Insights and Forecast - by End Use Sector
- 8.1.1. Commercial
- 8.1.2. Industrial and Institutional
- 8.1.3. Infrastructure
- 8.1.4. Residential
- 8.2. Market Analysis, Insights and Forecast - by Sub Product
- 8.2.1. Fiber Wrapping Systems
- 8.2.2. Injection Grouting Materials
- 8.2.3. Micro-concrete Mortars
- 8.2.4. Modified Mortars
- 8.2.5. Rebar Protectors
- 8.1. Market Analysis, Insights and Forecast - by End Use Sector
- 9. Europe Construction Repair and Rehabilitation Chemicals Market Analysis, Insights and Forecast, 2020-2032
- 9.1. Market Analysis, Insights and Forecast - by End Use Sector
- 9.1.1. Commercial
- 9.1.2. Industrial and Institutional
- 9.1.3. Infrastructure
- 9.1.4. Residential
- 9.2. Market Analysis, Insights and Forecast - by Sub Product
- 9.2.1. Fiber Wrapping Systems
- 9.2.2. Injection Grouting Materials
- 9.2.3. Micro-concrete Mortars
- 9.2.4. Modified Mortars
- 9.2.5. Rebar Protectors
- 9.1. Market Analysis, Insights and Forecast - by End Use Sector
- 10. Middle East & Africa Construction Repair and Rehabilitation Chemicals Market Analysis, Insights and Forecast, 2020-2032
- 10.1. Market Analysis, Insights and Forecast - by End Use Sector
- 10.1.1. Commercial
- 10.1.2. Industrial and Institutional
- 10.1.3. Infrastructure
- 10.1.4. Residential
- 10.2. Market Analysis, Insights and Forecast - by Sub Product
- 10.2.1. Fiber Wrapping Systems
- 10.2.2. Injection Grouting Materials
- 10.2.3. Micro-concrete Mortars
- 10.2.4. Modified Mortars
- 10.2.5. Rebar Protectors
- 10.1. Market Analysis, Insights and Forecast - by End Use Sector
- 11. Asia Pacific Construction Repair and Rehabilitation Chemicals Market Analysis, Insights and Forecast, 2020-2032
- 11.1. Market Analysis, Insights and Forecast - by End Use Sector
- 11.1.1. Commercial
- 11.1.2. Industrial and Institutional
- 11.1.3. Infrastructure
- 11.1.4. Residential
- 11.2. Market Analysis, Insights and Forecast - by Sub Product
- 11.2.1. Fiber Wrapping Systems
- 11.2.2. Injection Grouting Materials
- 11.2.3. Micro-concrete Mortars
- 11.2.4. Modified Mortars
- 11.2.5. Rebar Protectors
- 11.1. Market Analysis, Insights and Forecast - by End Use Sector
- 12. Competitive Analysis
- 12.1. Company Profiles
- 12.1.1 Remmers Gruppe AG
- 12.1.1.1. Company Overview
- 12.1.1.2. Products
- 12.1.1.3. Company Financials
- 12.1.1.4. SWOT Analysis
- 12.1.2 Saint-Gobain
- 12.1.2.1. Company Overview
- 12.1.2.2. Products
- 12.1.2.3. Company Financials
- 12.1.2.4. SWOT Analysis
- 12.1.3 RPM International Inc
- 12.1.3.1. Company Overview
- 12.1.3.2. Products
- 12.1.3.3. Company Financials
- 12.1.3.4. SWOT Analysis
- 12.1.4 MBCC Group
- 12.1.4.1. Company Overview
- 12.1.4.2. Products
- 12.1.4.3. Company Financials
- 12.1.4.4. SWOT Analysis
- 12.1.5 Simpson Strong-Tie Company Inc
- 12.1.5.1. Company Overview
- 12.1.5.2. Products
- 12.1.5.3. Company Financials
- 12.1.5.4. SWOT Analysis
- 12.1.6 Fosroc Inc
- 12.1.6.1. Company Overview
- 12.1.6.2. Products
- 12.1.6.3. Company Financials
- 12.1.6.4. SWOT Analysis
- 12.1.7 Ardex Group
- 12.1.7.1. Company Overview
- 12.1.7.2. Products
- 12.1.7.3. Company Financials
- 12.1.7.4. SWOT Analysis
- 12.1.8 MAPEI S p A
- 12.1.8.1. Company Overview
- 12.1.8.2. Products
- 12.1.8.3. Company Financials
- 12.1.8.4. SWOT Analysis
- 12.1.9 Sika AG
- 12.1.9.1. Company Overview
- 12.1.9.2. Products
- 12.1.9.3. Company Financials
- 12.1.9.4. SWOT Analysis
- 12.1.10 MC-Bauchemie
- 12.1.10.1. Company Overview
- 12.1.10.2. Products
- 12.1.10.3. Company Financials
- 12.1.10.4. SWOT Analysis
- 12.1.1 Remmers Gruppe AG
- 12.2. Market Entropy
- 12.2.1 Company's Key Areas Served
- 12.2.2 Recent Developments
- 12.3. Company Market Share Analysis 2025
- 12.3.1 Top 5 Companies Market Share Analysis
- 12.3.2 Top 3 Companies Market Share Analysis
- 12.4. List of Potential Customers
- 13. Research Methodology
List of Figures
- Figure 1: Global Construction Repair and Rehabilitation Chemicals Market Revenue Breakdown (billion, %) by Region 2025 & 2033
- Figure 2: Global Construction Repair and Rehabilitation Chemicals Market Volume Breakdown (K Tons, %) by Region 2025 & 2033
- Figure 3: North America Construction Repair and Rehabilitation Chemicals Market Revenue (billion), by End Use Sector 2025 & 2033
- Figure 4: North America Construction Repair and Rehabilitation Chemicals Market Volume (K Tons), by End Use Sector 2025 & 2033
- Figure 5: North America Construction Repair and Rehabilitation Chemicals Market Revenue Share (%), by End Use Sector 2025 & 2033
- Figure 6: North America Construction Repair and Rehabilitation Chemicals Market Volume Share (%), by End Use Sector 2025 & 2033
- Figure 7: North America Construction Repair and Rehabilitation Chemicals Market Revenue (billion), by Sub Product 2025 & 2033
- Figure 8: North America Construction Repair and Rehabilitation Chemicals Market Volume (K Tons), by Sub Product 2025 & 2033
- Figure 9: North America Construction Repair and Rehabilitation Chemicals Market Revenue Share (%), by Sub Product 2025 & 2033
- Figure 10: North America Construction Repair and Rehabilitation Chemicals Market Volume Share (%), by Sub Product 2025 & 2033
- Figure 11: North America Construction Repair and Rehabilitation Chemicals Market Revenue (billion), by Country 2025 & 2033
- Figure 12: North America Construction Repair and Rehabilitation Chemicals Market Volume (K Tons), by Country 2025 & 2033
- Figure 13: North America Construction Repair and Rehabilitation Chemicals Market Revenue Share (%), by Country 2025 & 2033
- Figure 14: North America Construction Repair and Rehabilitation Chemicals Market Volume Share (%), by Country 2025 & 2033
- Figure 15: South America Construction Repair and Rehabilitation Chemicals Market Revenue (billion), by End Use Sector 2025 & 2033
- Figure 16: South America Construction Repair and Rehabilitation Chemicals Market Volume (K Tons), by End Use Sector 2025 & 2033
- Figure 17: South America Construction Repair and Rehabilitation Chemicals Market Revenue Share (%), by End Use Sector 2025 & 2033
- Figure 18: South America Construction Repair and Rehabilitation Chemicals Market Volume Share (%), by End Use Sector 2025 & 2033
- Figure 19: South America Construction Repair and Rehabilitation Chemicals Market Revenue (billion), by Sub Product 2025 & 2033
- Figure 20: South America Construction Repair and Rehabilitation Chemicals Market Volume (K Tons), by Sub Product 2025 & 2033
- Figure 21: South America Construction Repair and Rehabilitation Chemicals Market Revenue Share (%), by Sub Product 2025 & 2033
- Figure 22: South America Construction Repair and Rehabilitation Chemicals Market Volume Share (%), by Sub Product 2025 & 2033
- Figure 23: South America Construction Repair and Rehabilitation Chemicals Market Revenue (billion), by Country 2025 & 2033
- Figure 24: South America Construction Repair and Rehabilitation Chemicals Market Volume (K Tons), by Country 2025 & 2033
- Figure 25: South America Construction Repair and Rehabilitation Chemicals Market Revenue Share (%), by Country 2025 & 2033
- Figure 26: South America Construction Repair and Rehabilitation Chemicals Market Volume Share (%), by Country 2025 & 2033
- Figure 27: Europe Construction Repair and Rehabilitation Chemicals Market Revenue (billion), by End Use Sector 2025 & 2033
- Figure 28: Europe Construction Repair and Rehabilitation Chemicals Market Volume (K Tons), by End Use Sector 2025 & 2033
- Figure 29: Europe Construction Repair and Rehabilitation Chemicals Market Revenue Share (%), by End Use Sector 2025 & 2033
- Figure 30: Europe Construction Repair and Rehabilitation Chemicals Market Volume Share (%), by End Use Sector 2025 & 2033
- Figure 31: Europe Construction Repair and Rehabilitation Chemicals Market Revenue (billion), by Sub Product 2025 & 2033
- Figure 32: Europe Construction Repair and Rehabilitation Chemicals Market Volume (K Tons), by Sub Product 2025 & 2033
- Figure 33: Europe Construction Repair and Rehabilitation Chemicals Market Revenue Share (%), by Sub Product 2025 & 2033
- Figure 34: Europe Construction Repair and Rehabilitation Chemicals Market Volume Share (%), by Sub Product 2025 & 2033
- Figure 35: Europe Construction Repair and Rehabilitation Chemicals Market Revenue (billion), by Country 2025 & 2033
- Figure 36: Europe Construction Repair and Rehabilitation Chemicals Market Volume (K Tons), by Country 2025 & 2033
- Figure 37: Europe Construction Repair and Rehabilitation Chemicals Market Revenue Share (%), by Country 2025 & 2033
- Figure 38: Europe Construction Repair and Rehabilitation Chemicals Market Volume Share (%), by Country 2025 & 2033
- Figure 39: Middle East & Africa Construction Repair and Rehabilitation Chemicals Market Revenue (billion), by End Use Sector 2025 & 2033
- Figure 40: Middle East & Africa Construction Repair and Rehabilitation Chemicals Market Volume (K Tons), by End Use Sector 2025 & 2033
- Figure 41: Middle East & Africa Construction Repair and Rehabilitation Chemicals Market Revenue Share (%), by End Use Sector 2025 & 2033
- Figure 42: Middle East & Africa Construction Repair and Rehabilitation Chemicals Market Volume Share (%), by End Use Sector 2025 & 2033
- Figure 43: Middle East & Africa Construction Repair and Rehabilitation Chemicals Market Revenue (billion), by Sub Product 2025 & 2033
- Figure 44: Middle East & Africa Construction Repair and Rehabilitation Chemicals Market Volume (K Tons), by Sub Product 2025 & 2033
- Figure 45: Middle East & Africa Construction Repair and Rehabilitation Chemicals Market Revenue Share (%), by Sub Product 2025 & 2033
- Figure 46: Middle East & Africa Construction Repair and Rehabilitation Chemicals Market Volume Share (%), by Sub Product 2025 & 2033
- Figure 47: Middle East & Africa Construction Repair and Rehabilitation Chemicals Market Revenue (billion), by Country 2025 & 2033
- Figure 48: Middle East & Africa Construction Repair and Rehabilitation Chemicals Market Volume (K Tons), by Country 2025 & 2033
- Figure 49: Middle East & Africa Construction Repair and Rehabilitation Chemicals Market Revenue Share (%), by Country 2025 & 2033
- Figure 50: Middle East & Africa Construction Repair and Rehabilitation Chemicals Market Volume Share (%), by Country 2025 & 2033
- Figure 51: Asia Pacific Construction Repair and Rehabilitation Chemicals Market Revenue (billion), by End Use Sector 2025 & 2033
- Figure 52: Asia Pacific Construction Repair and Rehabilitation Chemicals Market Volume (K Tons), by End Use Sector 2025 & 2033
- Figure 53: Asia Pacific Construction Repair and Rehabilitation Chemicals Market Revenue Share (%), by End Use Sector 2025 & 2033
- Figure 54: Asia Pacific Construction Repair and Rehabilitation Chemicals Market Volume Share (%), by End Use Sector 2025 & 2033
- Figure 55: Asia Pacific Construction Repair and Rehabilitation Chemicals Market Revenue (billion), by Sub Product 2025 & 2033
- Figure 56: Asia Pacific Construction Repair and Rehabilitation Chemicals Market Volume (K Tons), by Sub Product 2025 & 2033
- Figure 57: Asia Pacific Construction Repair and Rehabilitation Chemicals Market Revenue Share (%), by Sub Product 2025 & 2033
- Figure 58: Asia Pacific Construction Repair and Rehabilitation Chemicals Market Volume Share (%), by Sub Product 2025 & 2033
- Figure 59: Asia Pacific Construction Repair and Rehabilitation Chemicals Market Revenue (billion), by Country 2025 & 2033
- Figure 60: Asia Pacific Construction Repair and Rehabilitation Chemicals Market Volume (K Tons), by Country 2025 & 2033
- Figure 61: Asia Pacific Construction Repair and Rehabilitation Chemicals Market Revenue Share (%), by Country 2025 & 2033
- Figure 62: Asia Pacific Construction Repair and Rehabilitation Chemicals Market Volume Share (%), by Country 2025 & 2033
List of Tables
- Table 1: Global Construction Repair and Rehabilitation Chemicals Market Revenue billion Forecast, by End Use Sector 2020 & 2033
- Table 2: Global Construction Repair and Rehabilitation Chemicals Market Volume K Tons Forecast, by End Use Sector 2020 & 2033
- Table 3: Global Construction Repair and Rehabilitation Chemicals Market Revenue billion Forecast, by Sub Product 2020 & 2033
- Table 4: Global Construction Repair and Rehabilitation Chemicals Market Volume K Tons Forecast, by Sub Product 2020 & 2033
- Table 5: Global Construction Repair and Rehabilitation Chemicals Market Revenue billion Forecast, by Region 2020 & 2033
- Table 6: Global Construction Repair and Rehabilitation Chemicals Market Volume K Tons Forecast, by Region 2020 & 2033
- Table 7: Global Construction Repair and Rehabilitation Chemicals Market Revenue billion Forecast, by End Use Sector 2020 & 2033
- Table 8: Global Construction Repair and Rehabilitation Chemicals Market Volume K Tons Forecast, by End Use Sector 2020 & 2033
- Table 9: Global Construction Repair and Rehabilitation Chemicals Market Revenue billion Forecast, by Sub Product 2020 & 2033
- Table 10: Global Construction Repair and Rehabilitation Chemicals Market Volume K Tons Forecast, by Sub Product 2020 & 2033
- Table 11: Global Construction Repair and Rehabilitation Chemicals Market Revenue billion Forecast, by Country 2020 & 2033
- Table 12: Global Construction Repair and Rehabilitation Chemicals Market Volume K Tons Forecast, by Country 2020 & 2033
- Table 13: United States Construction Repair and Rehabilitation Chemicals Market Revenue (billion) Forecast, by Application 2020 & 2033
- Table 14: United States Construction Repair and Rehabilitation Chemicals Market Volume (K Tons) Forecast, by Application 2020 & 2033
- Table 15: Canada Construction Repair and Rehabilitation Chemicals Market Revenue (billion) Forecast, by Application 2020 & 2033
- Table 16: Canada Construction Repair and Rehabilitation Chemicals Market Volume (K Tons) Forecast, by Application 2020 & 2033
- Table 17: Mexico Construction Repair and Rehabilitation Chemicals Market Revenue (billion) Forecast, by Application 2020 & 2033
- Table 18: Mexico Construction Repair and Rehabilitation Chemicals Market Volume (K Tons) Forecast, by Application 2020 & 2033
- Table 19: Global Construction Repair and Rehabilitation Chemicals Market Revenue billion Forecast, by End Use Sector 2020 & 2033
- Table 20: Global Construction Repair and Rehabilitation Chemicals Market Volume K Tons Forecast, by End Use Sector 2020 & 2033
- Table 21: Global Construction Repair and Rehabilitation Chemicals Market Revenue billion Forecast, by Sub Product 2020 & 2033
- Table 22: Global Construction Repair and Rehabilitation Chemicals Market Volume K Tons Forecast, by Sub Product 2020 & 2033
- Table 23: Global Construction Repair and Rehabilitation Chemicals Market Revenue billion Forecast, by Country 2020 & 2033
- Table 24: Global Construction Repair and Rehabilitation Chemicals Market Volume K Tons Forecast, by Country 2020 & 2033
- Table 25: Brazil Construction Repair and Rehabilitation Chemicals Market Revenue (billion) Forecast, by Application 2020 & 2033
- Table 26: Brazil Construction Repair and Rehabilitation Chemicals Market Volume (K Tons) Forecast, by Application 2020 & 2033
- Table 27: Argentina Construction Repair and Rehabilitation Chemicals Market Revenue (billion) Forecast, by Application 2020 & 2033
- Table 28: Argentina Construction Repair and Rehabilitation Chemicals Market Volume (K Tons) Forecast, by Application 2020 & 2033
- Table 29: Rest of South America Construction Repair and Rehabilitation Chemicals Market Revenue (billion) Forecast, by Application 2020 & 2033
- Table 30: Rest of South America Construction Repair and Rehabilitation Chemicals Market Volume (K Tons) Forecast, by Application 2020 & 2033
- Table 31: Global Construction Repair and Rehabilitation Chemicals Market Revenue billion Forecast, by End Use Sector 2020 & 2033
- Table 32: Global Construction Repair and Rehabilitation Chemicals Market Volume K Tons Forecast, by End Use Sector 2020 & 2033
- Table 33: Global Construction Repair and Rehabilitation Chemicals Market Revenue billion Forecast, by Sub Product 2020 & 2033
- Table 34: Global Construction Repair and Rehabilitation Chemicals Market Volume K Tons Forecast, by Sub Product 2020 & 2033
- Table 35: Global Construction Repair and Rehabilitation Chemicals Market Revenue billion Forecast, by Country 2020 & 2033
- Table 36: Global Construction Repair and Rehabilitation Chemicals Market Volume K Tons Forecast, by Country 2020 & 2033
- Table 37: United Kingdom Construction Repair and Rehabilitation Chemicals Market Revenue (billion) Forecast, by Application 2020 & 2033
- Table 38: United Kingdom Construction Repair and Rehabilitation Chemicals Market Volume (K Tons) Forecast, by Application 2020 & 2033
- Table 39: Germany Construction Repair and Rehabilitation Chemicals Market Revenue (billion) Forecast, by Application 2020 & 2033
- Table 40: Germany Construction Repair and Rehabilitation Chemicals Market Volume (K Tons) Forecast, by Application 2020 & 2033
- Table 41: France Construction Repair and Rehabilitation Chemicals Market Revenue (billion) Forecast, by Application 2020 & 2033
- Table 42: France Construction Repair and Rehabilitation Chemicals Market Volume (K Tons) Forecast, by Application 2020 & 2033
- Table 43: Italy Construction Repair and Rehabilitation Chemicals Market Revenue (billion) Forecast, by Application 2020 & 2033
- Table 44: Italy Construction Repair and Rehabilitation Chemicals Market Volume (K Tons) Forecast, by Application 2020 & 2033
- Table 45: Spain Construction Repair and Rehabilitation Chemicals Market Revenue (billion) Forecast, by Application 2020 & 2033
- Table 46: Spain Construction Repair and Rehabilitation Chemicals Market Volume (K Tons) Forecast, by Application 2020 & 2033
- Table 47: Russia Construction Repair and Rehabilitation Chemicals Market Revenue (billion) Forecast, by Application 2020 & 2033
- Table 48: Russia Construction Repair and Rehabilitation Chemicals Market Volume (K Tons) Forecast, by Application 2020 & 2033
- Table 49: Benelux Construction Repair and Rehabilitation Chemicals Market Revenue (billion) Forecast, by Application 2020 & 2033
- Table 50: Benelux Construction Repair and Rehabilitation Chemicals Market Volume (K Tons) Forecast, by Application 2020 & 2033
- Table 51: Nordics Construction Repair and Rehabilitation Chemicals Market Revenue (billion) Forecast, by Application 2020 & 2033
- Table 52: Nordics Construction Repair and Rehabilitation Chemicals Market Volume (K Tons) Forecast, by Application 2020 & 2033
- Table 53: Rest of Europe Construction Repair and Rehabilitation Chemicals Market Revenue (billion) Forecast, by Application 2020 & 2033
- Table 54: Rest of Europe Construction Repair and Rehabilitation Chemicals Market Volume (K Tons) Forecast, by Application 2020 & 2033
- Table 55: Global Construction Repair and Rehabilitation Chemicals Market Revenue billion Forecast, by End Use Sector 2020 & 2033
- Table 56: Global Construction Repair and Rehabilitation Chemicals Market Volume K Tons Forecast, by End Use Sector 2020 & 2033
- Table 57: Global Construction Repair and Rehabilitation Chemicals Market Revenue billion Forecast, by Sub Product 2020 & 2033
- Table 58: Global Construction Repair and Rehabilitation Chemicals Market Volume K Tons Forecast, by Sub Product 2020 & 2033
- Table 59: Global Construction Repair and Rehabilitation Chemicals Market Revenue billion Forecast, by Country 2020 & 2033
- Table 60: Global Construction Repair and Rehabilitation Chemicals Market Volume K Tons Forecast, by Country 2020 & 2033
- Table 61: Turkey Construction Repair and Rehabilitation Chemicals Market Revenue (billion) Forecast, by Application 2020 & 2033
- Table 62: Turkey Construction Repair and Rehabilitation Chemicals Market Volume (K Tons) Forecast, by Application 2020 & 2033
- Table 63: Israel Construction Repair and Rehabilitation Chemicals Market Revenue (billion) Forecast, by Application 2020 & 2033
- Table 64: Israel Construction Repair and Rehabilitation Chemicals Market Volume (K Tons) Forecast, by Application 2020 & 2033
- Table 65: GCC Construction Repair and Rehabilitation Chemicals Market Revenue (billion) Forecast, by Application 2020 & 2033
- Table 66: GCC Construction Repair and Rehabilitation Chemicals Market Volume (K Tons) Forecast, by Application 2020 & 2033
- Table 67: North Africa Construction Repair and Rehabilitation Chemicals Market Revenue (billion) Forecast, by Application 2020 & 2033
- Table 68: North Africa Construction Repair and Rehabilitation Chemicals Market Volume (K Tons) Forecast, by Application 2020 & 2033
- Table 69: South Africa Construction Repair and Rehabilitation Chemicals Market Revenue (billion) Forecast, by Application 2020 & 2033
- Table 70: South Africa Construction Repair and Rehabilitation Chemicals Market Volume (K Tons) Forecast, by Application 2020 & 2033
- Table 71: Rest of Middle East & Africa Construction Repair and Rehabilitation Chemicals Market Revenue (billion) Forecast, by Application 2020 & 2033
- Table 72: Rest of Middle East & Africa Construction Repair and Rehabilitation Chemicals Market Volume (K Tons) Forecast, by Application 2020 & 2033
- Table 73: Global Construction Repair and Rehabilitation Chemicals Market Revenue billion Forecast, by End Use Sector 2020 & 2033
- Table 74: Global Construction Repair and Rehabilitation Chemicals Market Volume K Tons Forecast, by End Use Sector 2020 & 2033
- Table 75: Global Construction Repair and Rehabilitation Chemicals Market Revenue billion Forecast, by Sub Product 2020 & 2033
- Table 76: Global Construction Repair and Rehabilitation Chemicals Market Volume K Tons Forecast, by Sub Product 2020 & 2033
- Table 77: Global Construction Repair and Rehabilitation Chemicals Market Revenue billion Forecast, by Country 2020 & 2033
- Table 78: Global Construction Repair and Rehabilitation Chemicals Market Volume K Tons Forecast, by Country 2020 & 2033
- Table 79: China Construction Repair and Rehabilitation Chemicals Market Revenue (billion) Forecast, by Application 2020 & 2033
- Table 80: China Construction Repair and Rehabilitation Chemicals Market Volume (K Tons) Forecast, by Application 2020 & 2033
- Table 81: India Construction Repair and Rehabilitation Chemicals Market Revenue (billion) Forecast, by Application 2020 & 2033
- Table 82: India Construction Repair and Rehabilitation Chemicals Market Volume (K Tons) Forecast, by Application 2020 & 2033
- Table 83: Japan Construction Repair and Rehabilitation Chemicals Market Revenue (billion) Forecast, by Application 2020 & 2033
- Table 84: Japan Construction Repair and Rehabilitation Chemicals Market Volume (K Tons) Forecast, by Application 2020 & 2033
- Table 85: South Korea Construction Repair and Rehabilitation Chemicals Market Revenue (billion) Forecast, by Application 2020 & 2033
- Table 86: South Korea Construction Repair and Rehabilitation Chemicals Market Volume (K Tons) Forecast, by Application 2020 & 2033
- Table 87: ASEAN Construction Repair and Rehabilitation Chemicals Market Revenue (billion) Forecast, by Application 2020 & 2033
- Table 88: ASEAN Construction Repair and Rehabilitation Chemicals Market Volume (K Tons) Forecast, by Application 2020 & 2033
- Table 89: Oceania Construction Repair and Rehabilitation Chemicals Market Revenue (billion) Forecast, by Application 2020 & 2033
- Table 90: Oceania Construction Repair and Rehabilitation Chemicals Market Volume (K Tons) Forecast, by Application 2020 & 2033
- Table 91: Rest of Asia Pacific Construction Repair and Rehabilitation Chemicals Market Revenue (billion) Forecast, by Application 2020 & 2033
- Table 92: Rest of Asia Pacific Construction Repair and Rehabilitation Chemicals Market Volume (K Tons) Forecast, by Application 2020 & 2033
Frequently Asked Questions
1. What is the projected Compound Annual Growth Rate (CAGR) of the Construction Repair and Rehabilitation Chemicals Market?
The projected CAGR is approximately 7.9%.
2. Which companies are prominent players in the Construction Repair and Rehabilitation Chemicals Market?
Key companies in the market include Remmers Gruppe AG, Saint-Gobain, RPM International Inc, MBCC Group, Simpson Strong-Tie Company Inc, Fosroc Inc, Ardex Group, MAPEI S p A, Sika AG, MC-Bauchemie.
3. What are the main segments of the Construction Repair and Rehabilitation Chemicals Market?
The market segments include End Use Sector, Sub Product.
4. Can you provide details about the market size?
The market size is estimated to be USD 68.5 billion as of 2022.
5. What are some drivers contributing to market growth?
; Banning/ Limiting Use of Plastics used in packaging applications.
6. What are the notable trends driving market growth?
OTHER KEY INDUSTRY TRENDS COVERED IN THE REPORT.
7. Are there any restraints impacting market growth?
; Harmful Amines in Dyes; Paperless Green Initiatives.
8. Can you provide examples of recent developments in the market?
May 2023: Sika, a global leader in construction chemicals, acquired the MBCC Group, including its waterproofing solutions, anchors & grouts, flooring resins, repair & rehabilitation chemicals, and other businesses, with the exception of its concrete admixture operations in Europe, North America, Australia, and New Zealand.December 2022: Sika AG expanded its production capabilities in China with the establishment of a new manufacturing facility in Chongqing, located in the southwestern region of the country. This facility will focus on producing liquid waterproofing membranes and mortars.June 2022: To meet the growing demand for construction products like concrete admixtures, anchors & grouts, dry-mix mortars, and repair & rehabilitation chemicals, MAPEI commissioned the construction of a new manufacturing facility in Houston, Texas.
9. What pricing options are available for accessing the report?
Pricing options include single-user, multi-user, and enterprise licenses priced at USD 3800, USD 4500, and USD 5800 respectively.
10. Is the market size provided in terms of value or volume?
The market size is provided in terms of value, measured in billion and volume, measured in K Tons.
11. Are there any specific market keywords associated with the report?
Yes, the market keyword associated with the report is "Construction Repair and Rehabilitation Chemicals Market," which aids in identifying and referencing the specific market segment covered.
12. How do I determine which pricing option suits my needs best?
The pricing options vary based on user requirements and access needs. Individual users may opt for single-user licenses, while businesses requiring broader access may choose multi-user or enterprise licenses for cost-effective access to the report.
13. Are there any additional resources or data provided in the Construction Repair and Rehabilitation Chemicals Market report?
While the report offers comprehensive insights, it's advisable to review the specific contents or supplementary materials provided to ascertain if additional resources or data are available.
14. How can I stay updated on further developments or reports in the Construction Repair and Rehabilitation Chemicals Market?
To stay informed about further developments, trends, and reports in the Construction Repair and Rehabilitation Chemicals Market, consider subscribing to industry newsletters, following relevant companies and organizations, or regularly checking reputable industry news sources and publications.
Methodology
Step 1 - Identification of Relevant Samples Size from Population Database


Step 2 - Approaches for Defining Global Market Size (Value, Volume* & Price*)

Note*: In applicable scenarios
Step 3 - Data Sources
Primary Research
- Web Analytics
- Survey Reports
- Research Institute
- Latest Research Reports
- Opinion Leaders
Secondary Research
- Annual Reports
- White Paper
- Latest Press Release
- Industry Association
- Paid Database
- Investor Presentations

Step 4 - Data Triangulation
Involves using different sources of information in order to increase the validity of a study
These sources are likely to be stakeholders in a program - participants, other researchers, program staff, other community members, and so on.
Then we put all data in single framework & apply various statistical tools to find out the dynamic on the market.
During the analysis stage, feedback from the stakeholder groups would be compared to determine areas of agreement as well as areas of divergence