

Key Insights
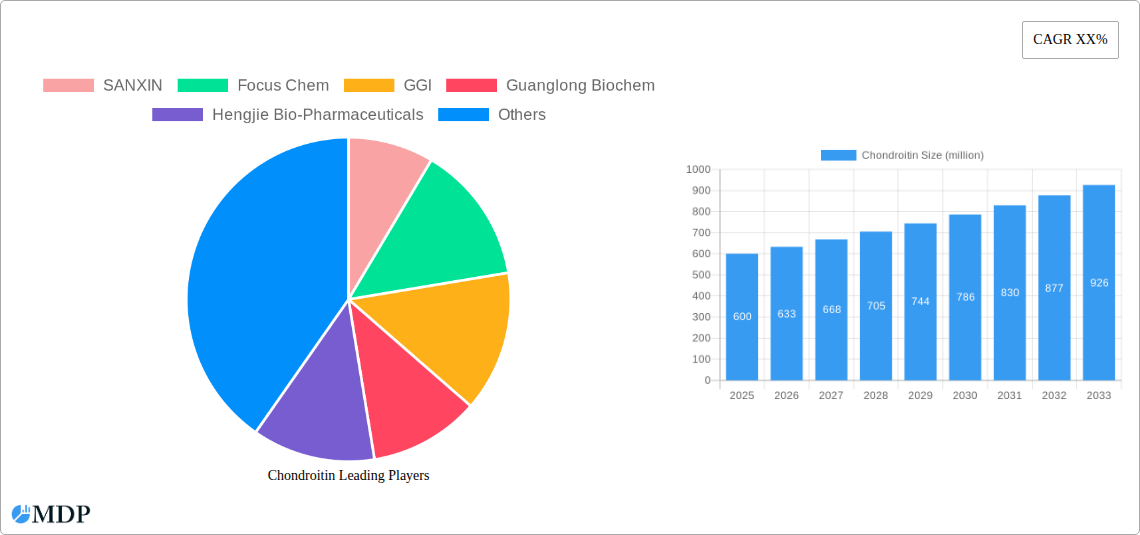
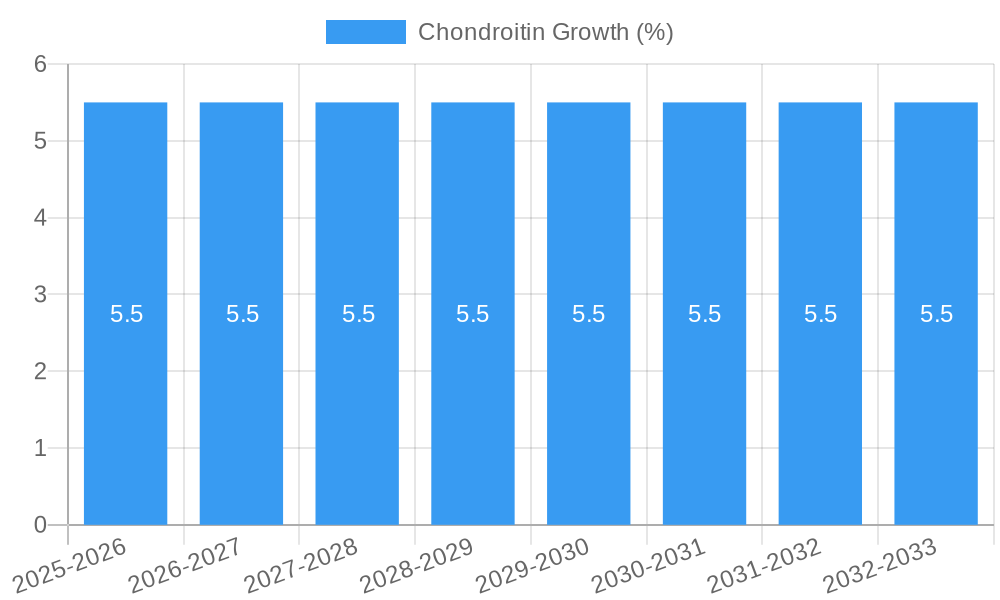
The global Chondroitin market is poised for significant expansion, projected to reach a substantial market size of approximately $600 million by 2025, with a robust Compound Annual Growth Rate (CAGR) of around 5.5% through 2033. This growth is primarily fueled by the escalating demand for dietary supplements and nutraceuticals, driven by increasing consumer awareness regarding joint health and the aging global population. The growing prevalence of osteoarthritis and other joint-related ailments further amplifies the need for chondroitin, a key component in cartilage. The pharmaceutical grade segment, in particular, is expected to witness strong traction due to its application in prescription medications and advanced therapeutic formulations. Key drivers include the rising disposable incomes, a more proactive approach to health and wellness, and continuous research and development efforts leading to novel product applications.
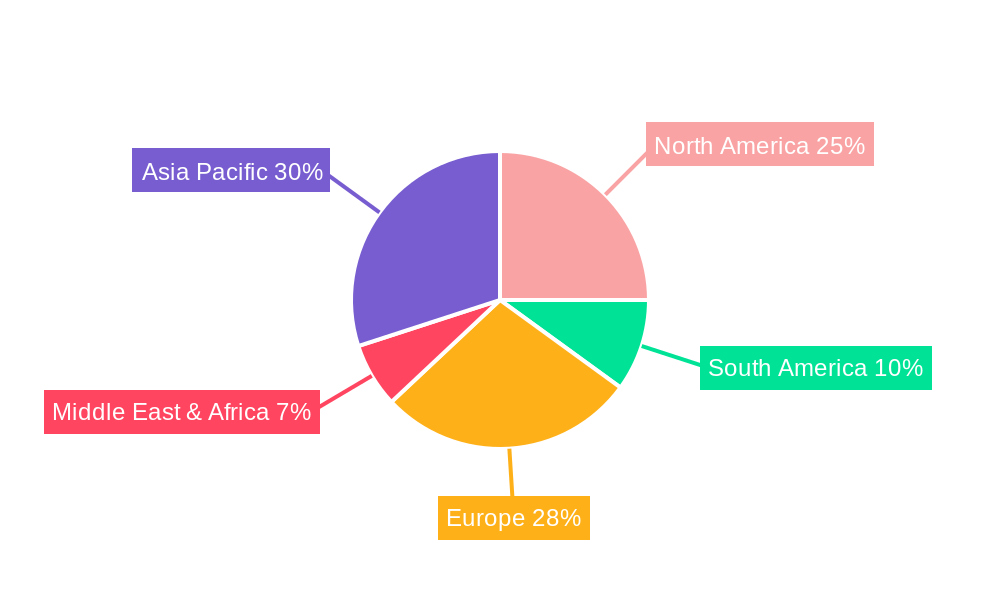
Despite the optimistic outlook, the market faces certain restraints, including fluctuating raw material prices, particularly for sourcing from animal cartilage, and stringent regulatory hurdles in certain regions for the approval of health claims associated with chondroitin supplements. However, advancements in biotechnology and the exploration of alternative, sustainable sourcing methods are anticipated to mitigate these challenges. The market is characterized by a competitive landscape with numerous players, ranging from established global corporations to specialized regional manufacturers. Innovations in product formulation, such as improved bioavailability and combination therapies, along with strategic partnerships and mergers, will be crucial for market participants to maintain and enhance their competitive edge. Asia Pacific, led by China, is expected to remain a dominant region due to its large manufacturing base and growing domestic consumption, while North America and Europe will continue to represent substantial markets driven by high healthcare spending and a mature consumer base for health supplements.
Chondroitin Market: Comprehensive Analysis & Forecast (2019-2033)
This in-depth report provides a definitive analysis of the global Chondroitin market, offering a detailed look at its dynamics, trends, leading players, and future outlook. Spanning a study period from 2019 to 2033, with a base and estimated year of 2025, this report leverages historical data from 2019-2024 and a forecast period of 2025-2033 to deliver actionable insights for industry stakeholders, including manufacturers, suppliers, investors, and researchers.
Chondroitin Market Dynamics & Concentration
The Chondroitin market exhibits a moderate to high concentration, with a few key players dominating production and supply. SANXIN, Focus Chem, and Guanglong Biochem are among the significant entities shaping market share, which is estimated to be in the range of several hundred million dollars. Innovation drivers are primarily fueled by advancements in extraction and purification technologies, enhancing product quality and yield. Regulatory frameworks, particularly concerning pharmaceutical-grade chondroitin and its use in dietary supplements, play a crucial role in market access and product development. The availability of product substitutes, such as glucosamine and hyaluronic acid, influences consumer choice, necessitating a focus on product differentiation and efficacy. End-user trends highlight a growing demand for chondroitin in health products aimed at joint health and arthritis management, alongside its established pharmaceutical applications. Mergers and acquisitions (M&A) activities, though sporadic, are present, with an estimated xx M&A deal count in the historical period, aimed at consolidating market positions and expanding product portfolios.
Chondroitin Industry Trends & Analysis
The Chondroitin industry is poised for significant growth, driven by an aging global population and a heightened awareness of joint health. Market growth drivers include the increasing prevalence of osteoarthritis and other degenerative joint conditions, which fuels demand for chondroitin supplements. Technological disruptions, such as enhanced purification techniques and novel delivery systems, are improving the bioavailability and efficacy of chondroitin products, further stimulating market penetration. Consumer preferences are shifting towards natural and scientifically validated health supplements, making chondroitin a popular choice. The competitive dynamics are characterized by intense price competition among manufacturers, alongside a growing emphasis on product quality and certifications, such as GMP compliance. The compound annual growth rate (CAGR) for the Chondroitin market is projected to be in the range of xx% over the forecast period. Market penetration is expected to expand, particularly in emerging economies, as disposable incomes rise and health consciousness increases. The estimated market size in 2025 is expected to be in the range of several hundred million dollars.
Leading Markets & Segments in Chondroitin
The Pharmacy segment is a dominant force in the Chondroitin market, largely attributed to its widespread use in prescription and over-the-counter medications for osteoarthritis and joint pain management. The Health Products segment, encompassing dietary supplements and functional foods, is experiencing rapid expansion due to growing consumer interest in preventative health and wellness. Within the Types classification, Pharmaceutical Grade chondroitin commands a premium due to its stringent quality control and regulatory approval for medicinal use. Food Grade chondroitin, while less regulated, is gaining traction in fortified food and beverage products targeting joint health.
Geographically, North America and Europe represent leading markets, driven by well-established healthcare systems, high disposable incomes, and a significant aging demographic prone to joint issues. Economic policies supporting the pharmaceutical and nutraceutical industries, coupled with robust research and development infrastructure, further bolster market dominance in these regions. Asia Pacific, particularly China and India, is emerging as a high-growth region due to increasing healthcare expenditure, a burgeoning middle class, and a rising awareness of dietary supplements. Infrastructure development in terms of manufacturing capabilities and distribution networks is crucial for unlocking the full potential of these emerging markets.
Chondroitin Product Developments
Chondroitin product developments are primarily focused on enhancing bioavailability and efficacy through advanced formulations and delivery systems. Innovations include microencapsulation techniques, combination therapies with glucosamine and other joint health ingredients, and the development of higher purity chondroitin sulfate extracts. These advancements offer competitive advantages by addressing consumer demand for more effective and targeted joint health solutions, catering to both pharmaceutical and health product applications.
Key Drivers of Chondroitin Growth
Several key factors are propelling the growth of the Chondroitin market. The rising incidence of age-related joint disorders, such as osteoarthritis, is a primary driver, creating a consistent demand for chondroitin as a therapeutic agent. Technological advancements in extraction and purification processes are leading to higher quality and more potent chondroitin products. Furthermore, increasing consumer awareness regarding the benefits of dietary supplements for joint health and overall well-being is significantly boosting demand. Favorable regulatory approvals for chondroitin in various health applications also contribute to market expansion.
Challenges in the Chondroitin Market
Despite its growth potential, the Chondroitin market faces several challenges. Regulatory hurdles and varying standards for product approval across different countries can impede market access. Supply chain disruptions, particularly related to sourcing raw materials, can impact production costs and availability. Intense competition among manufacturers leads to price pressures, affecting profit margins. Moreover, the presence of alternative joint health supplements and ongoing research into their comparative efficacy can create market uncertainties. The estimated financial impact of these challenges is in the range of several million dollars annually.
Emerging Opportunities in Chondroitin
Emerging opportunities in the Chondroitin market are driven by several catalysts. Technological breakthroughs in areas like cell-based chondroitin production could offer sustainable and scalable alternatives to traditional sourcing. Strategic partnerships between raw material suppliers and finished product manufacturers can streamline the supply chain and foster innovation. Market expansion into underdeveloped regions with a growing aging population and increasing healthcare spending presents significant growth potential. Furthermore, research into novel applications of chondroitin beyond joint health, such as in ophthalmic solutions and wound healing, could unlock new revenue streams.
Leading Players in the Chondroitin Sector
- SANXIN
- Focus Chem
- GGI
- Guanglong Biochem
- Hengjie Bio-Pharmaceuticals
- Huiwen
- ISBA
- Jiaixng Hengjie
- Meitek
- Nippon Zoki
- Pacific Rainbow
- Qingdao Green-Extract
- QJBCHINA
- Runxin Biotechnology
- SANXIN GROUP
- Shandong Dongcheng
- Sioux Pharm
- Summit Nutritionals
- TSI Group
- WanTuMing Biological
- Yantai Dongcheng
- YBCC
- Yibao Group
Key Milestones in Chondroitin Industry
- 2019: Increased research into non-animal sourced chondroitin production.
- 2020: Emergence of advanced purification techniques for higher purity chondroitin sulfate.
- 2021: Growing consumer demand for combination supplements targeting joint health.
- 2022: Expansion of chondroitin applications in functional foods and beverages.
- 2023: Enhanced regulatory scrutiny and quality control measures for pharmaceutical-grade chondroitin.
- 2024: Increased investment in research for novel delivery systems to improve chondroitin bioavailability.
Strategic Outlook for Chondroitin Market
The strategic outlook for the Chondroitin market is characterized by robust growth accelerators, primarily driven by an expanding global geriatric population and a persistent demand for effective joint health solutions. Manufacturers will increasingly focus on product differentiation through enhanced purity, bioavailability, and targeted formulations. Strategic partnerships and collaborations across the value chain, from raw material sourcing to distribution, will be crucial for market players to navigate competitive landscapes and capitalize on emerging opportunities. Continued investment in research and development for innovative applications and sustainable production methods will further solidify the market's trajectory towards long-term expansion.
Chondroitin Segmentation
-
1. Application
- 1.1. Pharmacy
- 1.2. Health Products
-
2. Types
- 2.1. Food Grade
- 2.2. Pharmaceutical Grade
Chondroitin Segmentation By Geography
-
1. North America
- 1.1. United States
- 1.2. Canada
- 1.3. Mexico
-
2. South America
- 2.1. Brazil
- 2.2. Argentina
- 2.3. Rest of South America
-
3. Europe
- 3.1. United Kingdom
- 3.2. Germany
- 3.3. France
- 3.4. Italy
- 3.5. Spain
- 3.6. Russia
- 3.7. Benelux
- 3.8. Nordics
- 3.9. Rest of Europe
-
4. Middle East & Africa
- 4.1. Turkey
- 4.2. Israel
- 4.3. GCC
- 4.4. North Africa
- 4.5. South Africa
- 4.6. Rest of Middle East & Africa
-
5. Asia Pacific
- 5.1. China
- 5.2. India
- 5.3. Japan
- 5.4. South Korea
- 5.5. ASEAN
- 5.6. Oceania
- 5.7. Rest of Asia Pacific
Chondroitin REPORT HIGHLIGHTS
| Aspects | Details |
|---|---|
| Study Period | 2019-2033 |
| Base Year | 2024 |
| Estimated Year | 2025 |
| Forecast Period | 2025-2033 |
| Historical Period | 2019-2024 |
| Growth Rate | CAGR of XX% from 2019-2033 |
| Segmentation |
|
Table of Contents
- 1. Introduction
- 1.1. Research Scope
- 1.2. Market Segmentation
- 1.3. Research Methodology
- 1.4. Definitions and Assumptions
- 2. Executive Summary
- 2.1. Introduction
- 3. Market Dynamics
- 3.1. Introduction
- 3.2. Market Drivers
- 3.3. Market Restrains
- 3.4. Market Trends
- 4. Market Factor Analysis
- 4.1. Porters Five Forces
- 4.2. Supply/Value Chain
- 4.3. PESTEL analysis
- 4.4. Market Entropy
- 4.5. Patent/Trademark Analysis
- 5. Global Chondroitin Analysis, Insights and Forecast, 2019-2031
- 5.1. Market Analysis, Insights and Forecast - by Application
- 5.1.1. Pharmacy
- 5.1.2. Health Products
- 5.2. Market Analysis, Insights and Forecast - by Types
- 5.2.1. Food Grade
- 5.2.2. Pharmaceutical Grade
- 5.3. Market Analysis, Insights and Forecast - by Region
- 5.3.1. North America
- 5.3.2. South America
- 5.3.3. Europe
- 5.3.4. Middle East & Africa
- 5.3.5. Asia Pacific
- 5.1. Market Analysis, Insights and Forecast - by Application
- 6. North America Chondroitin Analysis, Insights and Forecast, 2019-2031
- 6.1. Market Analysis, Insights and Forecast - by Application
- 6.1.1. Pharmacy
- 6.1.2. Health Products
- 6.2. Market Analysis, Insights and Forecast - by Types
- 6.2.1. Food Grade
- 6.2.2. Pharmaceutical Grade
- 6.1. Market Analysis, Insights and Forecast - by Application
- 7. South America Chondroitin Analysis, Insights and Forecast, 2019-2031
- 7.1. Market Analysis, Insights and Forecast - by Application
- 7.1.1. Pharmacy
- 7.1.2. Health Products
- 7.2. Market Analysis, Insights and Forecast - by Types
- 7.2.1. Food Grade
- 7.2.2. Pharmaceutical Grade
- 7.1. Market Analysis, Insights and Forecast - by Application
- 8. Europe Chondroitin Analysis, Insights and Forecast, 2019-2031
- 8.1. Market Analysis, Insights and Forecast - by Application
- 8.1.1. Pharmacy
- 8.1.2. Health Products
- 8.2. Market Analysis, Insights and Forecast - by Types
- 8.2.1. Food Grade
- 8.2.2. Pharmaceutical Grade
- 8.1. Market Analysis, Insights and Forecast - by Application
- 9. Middle East & Africa Chondroitin Analysis, Insights and Forecast, 2019-2031
- 9.1. Market Analysis, Insights and Forecast - by Application
- 9.1.1. Pharmacy
- 9.1.2. Health Products
- 9.2. Market Analysis, Insights and Forecast - by Types
- 9.2.1. Food Grade
- 9.2.2. Pharmaceutical Grade
- 9.1. Market Analysis, Insights and Forecast - by Application
- 10. Asia Pacific Chondroitin Analysis, Insights and Forecast, 2019-2031
- 10.1. Market Analysis, Insights and Forecast - by Application
- 10.1.1. Pharmacy
- 10.1.2. Health Products
- 10.2. Market Analysis, Insights and Forecast - by Types
- 10.2.1. Food Grade
- 10.2.2. Pharmaceutical Grade
- 10.1. Market Analysis, Insights and Forecast - by Application
- 11. Competitive Analysis
- 11.1. Global Market Share Analysis 2024
- 11.2. Company Profiles
- 11.2.1 SANXIN
- 11.2.1.1. Overview
- 11.2.1.2. Products
- 11.2.1.3. SWOT Analysis
- 11.2.1.4. Recent Developments
- 11.2.1.5. Financials (Based on Availability)
- 11.2.2 Focus Chem
- 11.2.2.1. Overview
- 11.2.2.2. Products
- 11.2.2.3. SWOT Analysis
- 11.2.2.4. Recent Developments
- 11.2.2.5. Financials (Based on Availability)
- 11.2.3 GGI
- 11.2.3.1. Overview
- 11.2.3.2. Products
- 11.2.3.3. SWOT Analysis
- 11.2.3.4. Recent Developments
- 11.2.3.5. Financials (Based on Availability)
- 11.2.4 Guanglong Biochem
- 11.2.4.1. Overview
- 11.2.4.2. Products
- 11.2.4.3. SWOT Analysis
- 11.2.4.4. Recent Developments
- 11.2.4.5. Financials (Based on Availability)
- 11.2.5 Hengjie Bio-Pharmaceuticals
- 11.2.5.1. Overview
- 11.2.5.2. Products
- 11.2.5.3. SWOT Analysis
- 11.2.5.4. Recent Developments
- 11.2.5.5. Financials (Based on Availability)
- 11.2.6 Huiwen
- 11.2.6.1. Overview
- 11.2.6.2. Products
- 11.2.6.3. SWOT Analysis
- 11.2.6.4. Recent Developments
- 11.2.6.5. Financials (Based on Availability)
- 11.2.7 ISBA
- 11.2.7.1. Overview
- 11.2.7.2. Products
- 11.2.7.3. SWOT Analysis
- 11.2.7.4. Recent Developments
- 11.2.7.5. Financials (Based on Availability)
- 11.2.8 Jiaixng Hengjie
- 11.2.8.1. Overview
- 11.2.8.2. Products
- 11.2.8.3. SWOT Analysis
- 11.2.8.4. Recent Developments
- 11.2.8.5. Financials (Based on Availability)
- 11.2.9 Meitek
- 11.2.9.1. Overview
- 11.2.9.2. Products
- 11.2.9.3. SWOT Analysis
- 11.2.9.4. Recent Developments
- 11.2.9.5. Financials (Based on Availability)
- 11.2.10 Nippon Zoki
- 11.2.10.1. Overview
- 11.2.10.2. Products
- 11.2.10.3. SWOT Analysis
- 11.2.10.4. Recent Developments
- 11.2.10.5. Financials (Based on Availability)
- 11.2.11 Pacific Rainbow
- 11.2.11.1. Overview
- 11.2.11.2. Products
- 11.2.11.3. SWOT Analysis
- 11.2.11.4. Recent Developments
- 11.2.11.5. Financials (Based on Availability)
- 11.2.12 Qingdao Green-Extract
- 11.2.12.1. Overview
- 11.2.12.2. Products
- 11.2.12.3. SWOT Analysis
- 11.2.12.4. Recent Developments
- 11.2.12.5. Financials (Based on Availability)
- 11.2.13 QJBCHINA
- 11.2.13.1. Overview
- 11.2.13.2. Products
- 11.2.13.3. SWOT Analysis
- 11.2.13.4. Recent Developments
- 11.2.13.5. Financials (Based on Availability)
- 11.2.14 Runxin Biotechnology
- 11.2.14.1. Overview
- 11.2.14.2. Products
- 11.2.14.3. SWOT Analysis
- 11.2.14.4. Recent Developments
- 11.2.14.5. Financials (Based on Availability)
- 11.2.15 SANXIN GROUP
- 11.2.15.1. Overview
- 11.2.15.2. Products
- 11.2.15.3. SWOT Analysis
- 11.2.15.4. Recent Developments
- 11.2.15.5. Financials (Based on Availability)
- 11.2.16 Shandong Dongcheng
- 11.2.16.1. Overview
- 11.2.16.2. Products
- 11.2.16.3. SWOT Analysis
- 11.2.16.4. Recent Developments
- 11.2.16.5. Financials (Based on Availability)
- 11.2.17 Sioux Pharm
- 11.2.17.1. Overview
- 11.2.17.2. Products
- 11.2.17.3. SWOT Analysis
- 11.2.17.4. Recent Developments
- 11.2.17.5. Financials (Based on Availability)
- 11.2.18 Summit Nutritionals
- 11.2.18.1. Overview
- 11.2.18.2. Products
- 11.2.18.3. SWOT Analysis
- 11.2.18.4. Recent Developments
- 11.2.18.5. Financials (Based on Availability)
- 11.2.19 TSI Group
- 11.2.19.1. Overview
- 11.2.19.2. Products
- 11.2.19.3. SWOT Analysis
- 11.2.19.4. Recent Developments
- 11.2.19.5. Financials (Based on Availability)
- 11.2.20 WanTuMing Biological
- 11.2.20.1. Overview
- 11.2.20.2. Products
- 11.2.20.3. SWOT Analysis
- 11.2.20.4. Recent Developments
- 11.2.20.5. Financials (Based on Availability)
- 11.2.21 Yantai Dongcheng
- 11.2.21.1. Overview
- 11.2.21.2. Products
- 11.2.21.3. SWOT Analysis
- 11.2.21.4. Recent Developments
- 11.2.21.5. Financials (Based on Availability)
- 11.2.22 YBCC
- 11.2.22.1. Overview
- 11.2.22.2. Products
- 11.2.22.3. SWOT Analysis
- 11.2.22.4. Recent Developments
- 11.2.22.5. Financials (Based on Availability)
- 11.2.23 Yibao Group
- 11.2.23.1. Overview
- 11.2.23.2. Products
- 11.2.23.3. SWOT Analysis
- 11.2.23.4. Recent Developments
- 11.2.23.5. Financials (Based on Availability)
- 11.2.1 SANXIN
List of Figures
- Figure 1: Global Chondroitin Revenue Breakdown (million, %) by Region 2024 & 2032
- Figure 2: North America Chondroitin Revenue (million), by Application 2024 & 2032
- Figure 3: North America Chondroitin Revenue Share (%), by Application 2024 & 2032
- Figure 4: North America Chondroitin Revenue (million), by Types 2024 & 2032
- Figure 5: North America Chondroitin Revenue Share (%), by Types 2024 & 2032
- Figure 6: North America Chondroitin Revenue (million), by Country 2024 & 2032
- Figure 7: North America Chondroitin Revenue Share (%), by Country 2024 & 2032
- Figure 8: South America Chondroitin Revenue (million), by Application 2024 & 2032
- Figure 9: South America Chondroitin Revenue Share (%), by Application 2024 & 2032
- Figure 10: South America Chondroitin Revenue (million), by Types 2024 & 2032
- Figure 11: South America Chondroitin Revenue Share (%), by Types 2024 & 2032
- Figure 12: South America Chondroitin Revenue (million), by Country 2024 & 2032
- Figure 13: South America Chondroitin Revenue Share (%), by Country 2024 & 2032
- Figure 14: Europe Chondroitin Revenue (million), by Application 2024 & 2032
- Figure 15: Europe Chondroitin Revenue Share (%), by Application 2024 & 2032
- Figure 16: Europe Chondroitin Revenue (million), by Types 2024 & 2032
- Figure 17: Europe Chondroitin Revenue Share (%), by Types 2024 & 2032
- Figure 18: Europe Chondroitin Revenue (million), by Country 2024 & 2032
- Figure 19: Europe Chondroitin Revenue Share (%), by Country 2024 & 2032
- Figure 20: Middle East & Africa Chondroitin Revenue (million), by Application 2024 & 2032
- Figure 21: Middle East & Africa Chondroitin Revenue Share (%), by Application 2024 & 2032
- Figure 22: Middle East & Africa Chondroitin Revenue (million), by Types 2024 & 2032
- Figure 23: Middle East & Africa Chondroitin Revenue Share (%), by Types 2024 & 2032
- Figure 24: Middle East & Africa Chondroitin Revenue (million), by Country 2024 & 2032
- Figure 25: Middle East & Africa Chondroitin Revenue Share (%), by Country 2024 & 2032
- Figure 26: Asia Pacific Chondroitin Revenue (million), by Application 2024 & 2032
- Figure 27: Asia Pacific Chondroitin Revenue Share (%), by Application 2024 & 2032
- Figure 28: Asia Pacific Chondroitin Revenue (million), by Types 2024 & 2032
- Figure 29: Asia Pacific Chondroitin Revenue Share (%), by Types 2024 & 2032
- Figure 30: Asia Pacific Chondroitin Revenue (million), by Country 2024 & 2032
- Figure 31: Asia Pacific Chondroitin Revenue Share (%), by Country 2024 & 2032
List of Tables
- Table 1: Global Chondroitin Revenue million Forecast, by Region 2019 & 2032
- Table 2: Global Chondroitin Revenue million Forecast, by Application 2019 & 2032
- Table 3: Global Chondroitin Revenue million Forecast, by Types 2019 & 2032
- Table 4: Global Chondroitin Revenue million Forecast, by Region 2019 & 2032
- Table 5: Global Chondroitin Revenue million Forecast, by Application 2019 & 2032
- Table 6: Global Chondroitin Revenue million Forecast, by Types 2019 & 2032
- Table 7: Global Chondroitin Revenue million Forecast, by Country 2019 & 2032
- Table 8: United States Chondroitin Revenue (million) Forecast, by Application 2019 & 2032
- Table 9: Canada Chondroitin Revenue (million) Forecast, by Application 2019 & 2032
- Table 10: Mexico Chondroitin Revenue (million) Forecast, by Application 2019 & 2032
- Table 11: Global Chondroitin Revenue million Forecast, by Application 2019 & 2032
- Table 12: Global Chondroitin Revenue million Forecast, by Types 2019 & 2032
- Table 13: Global Chondroitin Revenue million Forecast, by Country 2019 & 2032
- Table 14: Brazil Chondroitin Revenue (million) Forecast, by Application 2019 & 2032
- Table 15: Argentina Chondroitin Revenue (million) Forecast, by Application 2019 & 2032
- Table 16: Rest of South America Chondroitin Revenue (million) Forecast, by Application 2019 & 2032
- Table 17: Global Chondroitin Revenue million Forecast, by Application 2019 & 2032
- Table 18: Global Chondroitin Revenue million Forecast, by Types 2019 & 2032
- Table 19: Global Chondroitin Revenue million Forecast, by Country 2019 & 2032
- Table 20: United Kingdom Chondroitin Revenue (million) Forecast, by Application 2019 & 2032
- Table 21: Germany Chondroitin Revenue (million) Forecast, by Application 2019 & 2032
- Table 22: France Chondroitin Revenue (million) Forecast, by Application 2019 & 2032
- Table 23: Italy Chondroitin Revenue (million) Forecast, by Application 2019 & 2032
- Table 24: Spain Chondroitin Revenue (million) Forecast, by Application 2019 & 2032
- Table 25: Russia Chondroitin Revenue (million) Forecast, by Application 2019 & 2032
- Table 26: Benelux Chondroitin Revenue (million) Forecast, by Application 2019 & 2032
- Table 27: Nordics Chondroitin Revenue (million) Forecast, by Application 2019 & 2032
- Table 28: Rest of Europe Chondroitin Revenue (million) Forecast, by Application 2019 & 2032
- Table 29: Global Chondroitin Revenue million Forecast, by Application 2019 & 2032
- Table 30: Global Chondroitin Revenue million Forecast, by Types 2019 & 2032
- Table 31: Global Chondroitin Revenue million Forecast, by Country 2019 & 2032
- Table 32: Turkey Chondroitin Revenue (million) Forecast, by Application 2019 & 2032
- Table 33: Israel Chondroitin Revenue (million) Forecast, by Application 2019 & 2032
- Table 34: GCC Chondroitin Revenue (million) Forecast, by Application 2019 & 2032
- Table 35: North Africa Chondroitin Revenue (million) Forecast, by Application 2019 & 2032
- Table 36: South Africa Chondroitin Revenue (million) Forecast, by Application 2019 & 2032
- Table 37: Rest of Middle East & Africa Chondroitin Revenue (million) Forecast, by Application 2019 & 2032
- Table 38: Global Chondroitin Revenue million Forecast, by Application 2019 & 2032
- Table 39: Global Chondroitin Revenue million Forecast, by Types 2019 & 2032
- Table 40: Global Chondroitin Revenue million Forecast, by Country 2019 & 2032
- Table 41: China Chondroitin Revenue (million) Forecast, by Application 2019 & 2032
- Table 42: India Chondroitin Revenue (million) Forecast, by Application 2019 & 2032
- Table 43: Japan Chondroitin Revenue (million) Forecast, by Application 2019 & 2032
- Table 44: South Korea Chondroitin Revenue (million) Forecast, by Application 2019 & 2032
- Table 45: ASEAN Chondroitin Revenue (million) Forecast, by Application 2019 & 2032
- Table 46: Oceania Chondroitin Revenue (million) Forecast, by Application 2019 & 2032
- Table 47: Rest of Asia Pacific Chondroitin Revenue (million) Forecast, by Application 2019 & 2032
Frequently Asked Questions
1. What is the projected Compound Annual Growth Rate (CAGR) of the Chondroitin?
The projected CAGR is approximately XX%.
2. Which companies are prominent players in the Chondroitin?
Key companies in the market include SANXIN, Focus Chem, GGI, Guanglong Biochem, Hengjie Bio-Pharmaceuticals, Huiwen, ISBA, Jiaixng Hengjie, Meitek, Nippon Zoki, Pacific Rainbow, Qingdao Green-Extract, QJBCHINA, Runxin Biotechnology, SANXIN GROUP, Shandong Dongcheng, Sioux Pharm, Summit Nutritionals, TSI Group, WanTuMing Biological, Yantai Dongcheng, YBCC, Yibao Group.
3. What are the main segments of the Chondroitin?
The market segments include Application, Types.
4. Can you provide details about the market size?
The market size is estimated to be USD XXX million as of 2022.
5. What are some drivers contributing to market growth?
N/A
6. What are the notable trends driving market growth?
N/A
7. Are there any restraints impacting market growth?
N/A
8. Can you provide examples of recent developments in the market?
N/A
9. What pricing options are available for accessing the report?
Pricing options include single-user, multi-user, and enterprise licenses priced at USD 5600.00, USD 8400.00, and USD 11200.00 respectively.
10. Is the market size provided in terms of value or volume?
The market size is provided in terms of value, measured in million.
11. Are there any specific market keywords associated with the report?
Yes, the market keyword associated with the report is "Chondroitin," which aids in identifying and referencing the specific market segment covered.
12. How do I determine which pricing option suits my needs best?
The pricing options vary based on user requirements and access needs. Individual users may opt for single-user licenses, while businesses requiring broader access may choose multi-user or enterprise licenses for cost-effective access to the report.
13. Are there any additional resources or data provided in the Chondroitin report?
While the report offers comprehensive insights, it's advisable to review the specific contents or supplementary materials provided to ascertain if additional resources or data are available.
14. How can I stay updated on further developments or reports in the Chondroitin?
To stay informed about further developments, trends, and reports in the Chondroitin, consider subscribing to industry newsletters, following relevant companies and organizations, or regularly checking reputable industry news sources and publications.
Methodology
Step 1 - Identification of Relevant Samples Size from Population Database


Step 2 - Approaches for Defining Global Market Size (Value, Volume* & Price*)

Note*: In applicable scenarios
Step 3 - Data Sources
Primary Research
- Web Analytics
- Survey Reports
- Research Institute
- Latest Research Reports
- Opinion Leaders
Secondary Research
- Annual Reports
- White Paper
- Latest Press Release
- Industry Association
- Paid Database
- Investor Presentations

Step 4 - Data Triangulation
Involves using different sources of information in order to increase the validity of a study
These sources are likely to be stakeholders in a program - participants, other researchers, program staff, other community members, and so on.
Then we put all data in single framework & apply various statistical tools to find out the dynamic on the market.
During the analysis stage, feedback from the stakeholder groups would be compared to determine areas of agreement as well as areas of divergence
