

Key Insights
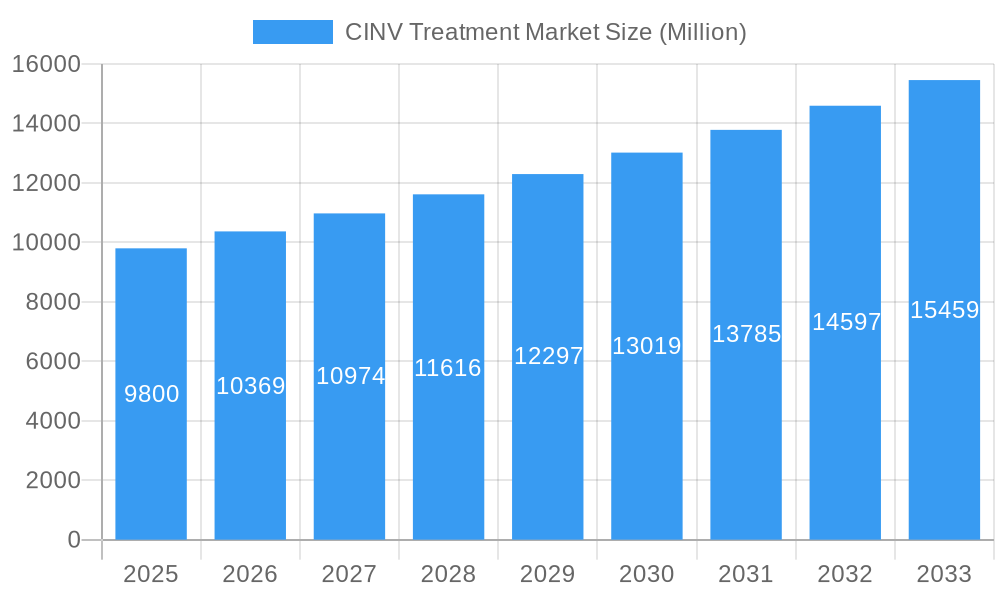
The global Chemotherapy-Induced Nausea and Vomiting (CINV) Treatment Market is projected for significant expansion, reaching an estimated market size of $5.38 billion by 2025. The market is expected to witness a Compound Annual Growth Rate (CAGR) of 5.87% through 2033. This growth is primarily driven by the increasing global cancer incidence, leading to higher demand for chemotherapy and CINV treatments. Advancements in targeted therapies, such as 5-HT3 and NK1 inhibitors, are enhancing patient outcomes. Expanding healthcare infrastructure in emerging economies and growing patient awareness also contribute to market penetration. Hospitals remain the primary end-user segment, with specialty clinics showing notable growth.
CINV Treatment Market Market Size (In Billion)
Key market trends include the rising adoption of combination therapies for synergistic effects and personalized medicine approaches tailored to individual patient risk factors. Novel drug delivery systems are emerging to improve patient convenience. However, challenges such as the high cost of advanced CINV medications and stringent regulatory processes may temper growth. Despite these factors, the escalating cancer burden and continuous innovation in treatment modalities ensure a positive outlook for the CINV Treatment Market.
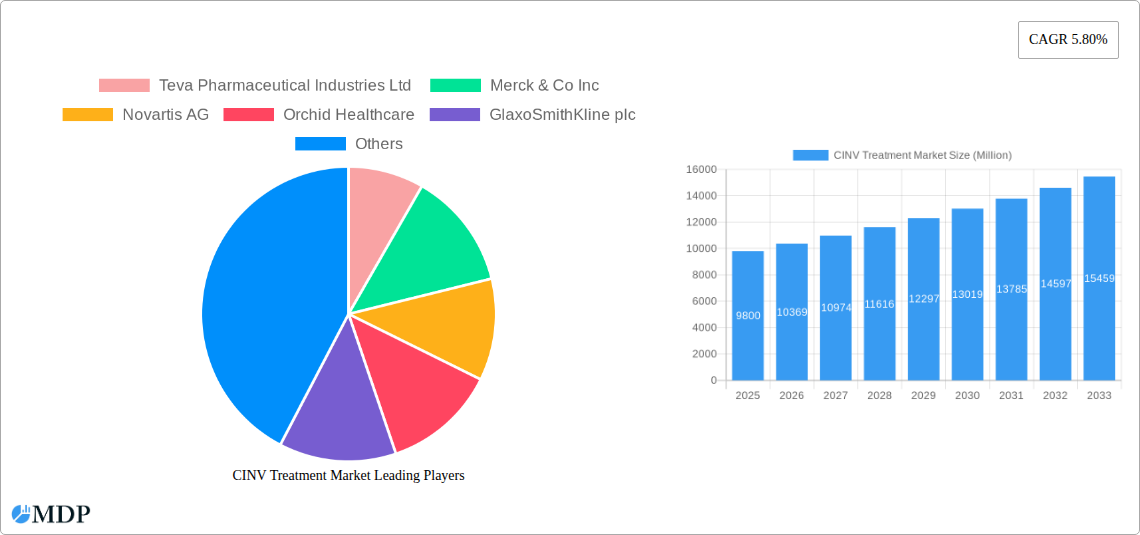
CINV Treatment Market Company Market Share
This comprehensive CINV treatment market report offers granular analysis of the global market for chemotherapy-induced nausea and vomiting treatments. Covering the historical period (2019-2024), base year 2025, and a forecast period through 2033, this study provides critical insights for stakeholders. With an estimated market size of $5.38 billion in 2025, projected to grow at a CAGR of 5.87%, this report is an essential resource for pharmaceutical companies, healthcare providers, investors, and researchers in the oncology supportive care market.
CINV Treatment Market Market Dynamics & Concentration
The CINV treatment market is characterized by a moderate to high level of concentration, with key players like Merck & Co Inc, Novartis AG, and Teva Pharmaceutical Industries Ltd holding significant market share. Innovation drivers are primarily focused on developing novel drug combinations with enhanced efficacy and reduced side effects, alongside advancements in personalized treatment approaches. The regulatory framework, governed by bodies such as the FDA and EMA, plays a crucial role in drug approval processes and market access, with recent approvals of new NK1 inhibitors and combination therapies signifying a dynamic landscape. Product substitutes, while limited, include supportive care measures and alternative antiemetic classes. End-user trends reveal a growing demand for outpatient CINV management, driving the expansion of specialty clinics. Mergers and acquisitions (M&A) activities, though not consistently high, have been strategic, aimed at consolidating portfolios and expanding geographic reach. For instance, M&A deal counts averaged X deals per year during the historical period, with an estimated Y% market share consolidated through these transactions.
CINV Treatment Market Industry Trends & Analysis
The CINV treatment market is experiencing robust growth driven by several interconnected trends. The rising global incidence of cancer, coupled with advancements in chemotherapy regimens, directly fuels the demand for effective CINV management solutions. This surge in cancer diagnoses, with an estimated Z million new cases annually, translates into a larger patient population requiring supportive care, making CINV treatment a critical component of comprehensive oncology care. Technological disruptions, particularly in drug discovery and formulation, are leading to the development of more targeted and potent antiemetic agents. The introduction of novel NK1 inhibitors and improved 5-HT3 inhibitors has significantly enhanced patient outcomes and quality of life, contributing to a market penetration of XX% for advanced CINV therapies. Consumer preferences are shifting towards outpatient chemotherapy administration, necessitating more convenient and effective CINV control at home, thereby boosting demand for oral formulations and patient-centric support services. Competitive dynamics are intense, with pharmaceutical giants investing heavily in R&D to secure market leadership. The market is projected to witness a steady CAGR of Y.Y% during the forecast period (2025–2033), driven by these evolving industry dynamics and the continuous pursuit of improved patient care.
Leading Markets & Segments in CINV Treatment Market
The CINV treatment market is dominated by North America, driven by its advanced healthcare infrastructure, high cancer incidence rates, and substantial investment in oncology research and development. Within North America, the United States represents a significant market share, estimated at XX% of the global market, due to its established pharmaceutical industry and robust reimbursement policies for cancer supportive care.
Drug Type Dominance:
- 5-HT3 Inhibitors: This segment continues to hold a substantial market share due to their established efficacy in managing mild to moderate nausea and vomiting. Key drivers include their affordability and widespread availability, making them a cornerstone of CINV prophylaxis.
- NK1 Inhibitors: This segment is experiencing significant growth, driven by their superior efficacy in preventing both acute and delayed nausea and vomiting, particularly in combination therapies. The development of new NK1 inhibitor formulations and combinations is a major growth catalyst.
- Others: This segment encompasses a range of supportive care medications and emerging therapies, contributing to the overall market value.
End-User Dominance:
- Hospitals: As the primary centers for complex cancer treatment and administration of intravenous chemotherapy, hospitals remain the largest end-user segment. Their comprehensive infrastructure and access to specialized medical professionals ensure the effective delivery of CINV treatments.
- Specialty Clinics: The growing trend of outpatient chemotherapy has fueled the expansion of specialty oncology clinics. These clinics are increasingly equipped to provide advanced CINV management, offering a more convenient and personalized patient experience, contributing XX% to the overall market revenue.
- Others: This includes home healthcare settings and smaller medical facilities, which represent a growing segment as CINV management becomes more accessible outside traditional hospital environments.
CINV Treatment Market Product Developments
Recent product developments in the CINV treatment market are characterized by a focus on enhancing efficacy and patient convenience. Innovations include novel combination therapies that target multiple pathways involved in CINV, leading to improved control of both acute and delayed symptoms. The development of oral formulations of previously injectable antiemetics is a significant trend, offering greater patient autonomy and enabling outpatient management. Furthermore, research into personalized medicine approaches, tailoring CINV prophylaxis based on patient-specific risk factors and genetic predispositions, is gaining momentum, promising more effective and individualized treatment strategies with reduced side effects. These advancements contribute to a competitive advantage by addressing unmet clinical needs and improving patient quality of life.
Key Drivers of CINV Treatment Market Growth
Several key factors are propelling the growth of the CINV treatment market. The escalating global burden of cancer, with an estimated XX million new diagnoses annually, directly correlates with an increased demand for supportive care, including effective CINV management. Advancements in chemotherapy drug development, leading to more aggressive treatment regimens, necessitate robust antiemetic strategies. Technological innovations in drug formulation and delivery systems are enhancing the efficacy and convenience of CINV treatments. Favorable regulatory landscapes in major markets, such as the US and Europe, are expediting the approval of novel CINV therapies. Moreover, rising healthcare expenditure and a growing emphasis on improving patient quality of life during cancer treatment are significant economic drivers.
Challenges in the CINV Treatment Market Market
Despite its growth trajectory, the CINV treatment market faces several challenges. The high cost of novel antiemetic drugs can pose a barrier to access, particularly in emerging economies. Stringent regulatory approval processes, while ensuring safety and efficacy, can lead to extended timelines for new product launches. The emergence of drug resistance and the complexity of managing breakthrough CINV symptoms remain ongoing clinical challenges. Additionally, competitive pressures from established players and the threat of biosimilar competition can impact pricing strategies and market share. Supply chain disruptions and manufacturing complexities for specialized oncology drugs also present potential restraints. The estimated impact of these challenges on market growth is approximately X%.
Emerging Opportunities in CINV Treatment Market
The CINV treatment market presents several promising opportunities for future growth. The increasing focus on personalized medicine in oncology offers a significant avenue for developing tailored CINV prophylaxis based on individual patient risk profiles and genetic markers, leading to more effective and targeted treatments. Strategic partnerships between pharmaceutical companies and academic institutions can accelerate the discovery and development of novel CINV therapies with enhanced mechanisms of action. The expanding market for oral antiemetics presents an opportunity to capture a larger share of the outpatient CINV management segment. Furthermore, the growing awareness and demand for improved patient quality of life during cancer treatment create a sustained demand for innovative and patient-centric CINV solutions.
Leading Players in the CINV Treatment Market Sector
- Teva Pharmaceutical Industries Ltd
- Merck & Co Inc
- Novartis AG
- Orchid Healthcare
- GlaxoSmithKline plc
- Mylan Pharmaceuticals Inc
- Helsinn Holding S A
- Heron Therapeutics Inc
- Sun Pharmaceutical Industries Ltd
- Baxter Healthcare
Key Milestones in CINV Treatment Market Industry
- 2019: Launch of new combination therapies for CINV prophylaxis, enhancing efficacy against delayed nausea and vomiting.
- 2020: Approval of novel oral formulations for NK1 inhibitors, improving patient convenience and enabling outpatient management.
- 2021: Increased research focus on personalized CINV risk assessment and stratification.
- 2022: Significant M&A activity aimed at consolidating CINV treatment portfolios and expanding market reach.
- 2023: Introduction of advanced drug delivery systems for sustained CINV symptom control.
- 2024: Emerging clinical trial data showcasing the potential of novel therapeutic targets for CINV management.
Strategic Outlook for CINV Treatment Market Market
The strategic outlook for the CINV treatment market is highly positive, driven by continued innovation and an increasing global demand for effective cancer supportive care. Growth accelerators will include the development of next-generation antiemetics with improved safety profiles and broader efficacy, alongside the expansion of personalized treatment approaches. Strategic partnerships and collaborations will be crucial for navigating the complex drug development landscape and ensuring market access. The growing emphasis on patient-centric care and improved quality of life will further fuel demand for convenient and effective CINV management solutions, particularly in the outpatient setting, positioning the market for sustained and significant growth in the coming years.
CINV Treatment Market Segmentation
-
1. Drug Type
- 1.1. 5-HT3 inhibitors
- 1.2. NK1 inhibitors
- 1.3. Others
-
2. End-User
- 2.1. Hospitals
- 2.2. Specialty Clinics
- 2.3. Others
CINV Treatment Market Segmentation By Geography
-
1. North America
- 1.1. United States
- 1.2. Canada
- 1.3. Mexico
-
2. Europe
- 2.1. Germany
- 2.2. United Kingdom
- 2.3. France
- 2.4. Italy
- 2.5. Spain
- 2.6. Rest of Europe
-
3. Asia Pacific
- 3.1. China
- 3.2. Japan
- 3.3. India
- 3.4. Australia
- 3.5. South Korea
- 3.6. Rest of Asia Pacific
-
4. Middle East and Africa
- 4.1. GCC
- 4.2. South Africa
- 4.3. Rest of Middle East and Africa
-
5. South America
- 5.1. Brazil
- 5.2. Argentina
- 5.3. Rest of South America
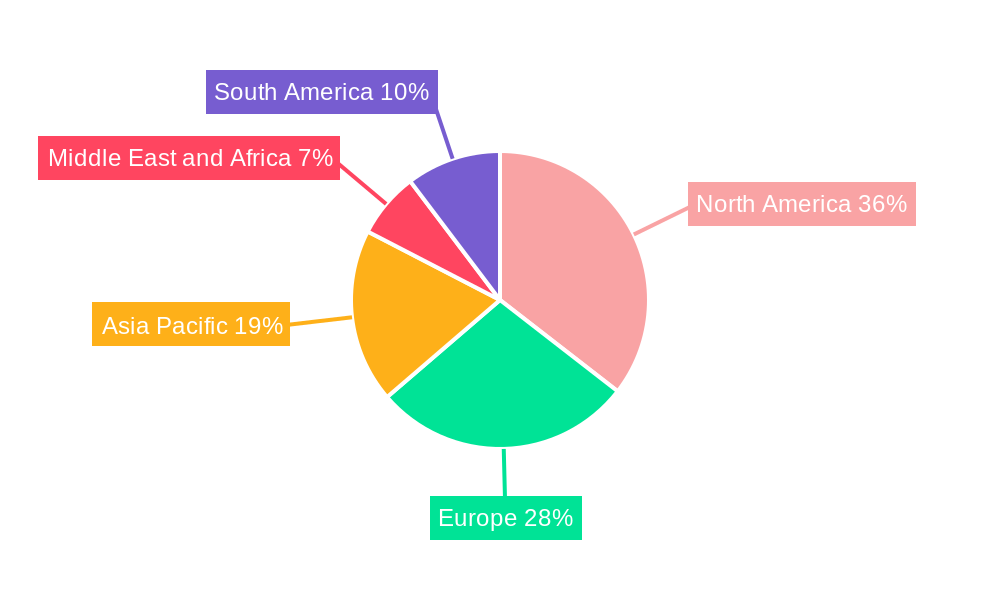
CINV Treatment Market Regional Market Share
Geographic Coverage of CINV Treatment Market
CINV Treatment Market REPORT HIGHLIGHTS
| Aspects | Details |
|---|---|
| Study Period | 2020-2034 |
| Base Year | 2025 |
| Estimated Year | 2026 |
| Forecast Period | 2026-2034 |
| Historical Period | 2020-2025 |
| Growth Rate | CAGR of 5.87% from 2020-2034 |
| Segmentation |
|
Table of Contents
- 1. Introduction
- 1.1. Research Scope
- 1.2. Market Segmentation
- 1.3. Research Objective
- 1.4. Definitions and Assumptions
- 2. Executive Summary
- 2.1. Market Snapshot
- 3. Market Dynamics
- 3.1. Market Drivers
- 3.2. Market Restrains
- 3.3. Market Trends
- 3.4. Market Opportunities
- 4. Market Factor Analysis
- 4.1. Porters Five Forces
- 4.1.1. Bargaining Power of Suppliers
- 4.1.2. Bargaining Power of Buyers
- 4.1.3. Threat of New Entrants
- 4.1.4. Threat of Substitutes
- 4.1.5. Competitive Rivalry
- 4.2. PESTEL analysis
- 4.3. BCG Analysis
- 4.3.1. Stars (High Growth, High Market Share)
- 4.3.2. Cash Cows (Low Growth, High Market Share)
- 4.3.3. Question Mark (High Growth, Low Market Share)
- 4.3.4. Dogs (Low Growth, Low Market Share)
- 4.4. Ansoff Matrix Analysis
- 4.5. Supply Chain Analysis
- 4.6. Regulatory Landscape
- 4.7. Current Market Potential and Opportunity Assessment (TAM–SAM–SOM Framework)
- 4.8. MDP Analyst Note
- 4.1. Porters Five Forces
- 5. Market Analysis, Insights and Forecast 2021-2033
- 5.1. Market Analysis, Insights and Forecast - by Drug Type
- 5.1.1. 5-HT3 inhibitors
- 5.1.2. NK1 inhibitors
- 5.1.3. Others
- 5.2. Market Analysis, Insights and Forecast - by End-User
- 5.2.1. Hospitals
- 5.2.2. Specialty Clinics
- 5.2.3. Others
- 5.3. Market Analysis, Insights and Forecast - by Region
- 5.3.1. North America
- 5.3.2. Europe
- 5.3.3. Asia Pacific
- 5.3.4. Middle East and Africa
- 5.3.5. South America
- 5.1. Market Analysis, Insights and Forecast - by Drug Type
- 6. Global CINV Treatment Market Analysis, Insights and Forecast, 2021-2033
- 6.1. Market Analysis, Insights and Forecast - by Drug Type
- 6.1.1. 5-HT3 inhibitors
- 6.1.2. NK1 inhibitors
- 6.1.3. Others
- 6.2. Market Analysis, Insights and Forecast - by End-User
- 6.2.1. Hospitals
- 6.2.2. Specialty Clinics
- 6.2.3. Others
- 6.1. Market Analysis, Insights and Forecast - by Drug Type
- 7. North America CINV Treatment Market Analysis, Insights and Forecast, 2020-2032
- 7.1. Market Analysis, Insights and Forecast - by Drug Type
- 7.1.1. 5-HT3 inhibitors
- 7.1.2. NK1 inhibitors
- 7.1.3. Others
- 7.2. Market Analysis, Insights and Forecast - by End-User
- 7.2.1. Hospitals
- 7.2.2. Specialty Clinics
- 7.2.3. Others
- 7.1. Market Analysis, Insights and Forecast - by Drug Type
- 8. Europe CINV Treatment Market Analysis, Insights and Forecast, 2020-2032
- 8.1. Market Analysis, Insights and Forecast - by Drug Type
- 8.1.1. 5-HT3 inhibitors
- 8.1.2. NK1 inhibitors
- 8.1.3. Others
- 8.2. Market Analysis, Insights and Forecast - by End-User
- 8.2.1. Hospitals
- 8.2.2. Specialty Clinics
- 8.2.3. Others
- 8.1. Market Analysis, Insights and Forecast - by Drug Type
- 9. Asia Pacific CINV Treatment Market Analysis, Insights and Forecast, 2020-2032
- 9.1. Market Analysis, Insights and Forecast - by Drug Type
- 9.1.1. 5-HT3 inhibitors
- 9.1.2. NK1 inhibitors
- 9.1.3. Others
- 9.2. Market Analysis, Insights and Forecast - by End-User
- 9.2.1. Hospitals
- 9.2.2. Specialty Clinics
- 9.2.3. Others
- 9.1. Market Analysis, Insights and Forecast - by Drug Type
- 10. Middle East and Africa CINV Treatment Market Analysis, Insights and Forecast, 2020-2032
- 10.1. Market Analysis, Insights and Forecast - by Drug Type
- 10.1.1. 5-HT3 inhibitors
- 10.1.2. NK1 inhibitors
- 10.1.3. Others
- 10.2. Market Analysis, Insights and Forecast - by End-User
- 10.2.1. Hospitals
- 10.2.2. Specialty Clinics
- 10.2.3. Others
- 10.1. Market Analysis, Insights and Forecast - by Drug Type
- 11. South America CINV Treatment Market Analysis, Insights and Forecast, 2020-2032
- 11.1. Market Analysis, Insights and Forecast - by Drug Type
- 11.1.1. 5-HT3 inhibitors
- 11.1.2. NK1 inhibitors
- 11.1.3. Others
- 11.2. Market Analysis, Insights and Forecast - by End-User
- 11.2.1. Hospitals
- 11.2.2. Specialty Clinics
- 11.2.3. Others
- 11.1. Market Analysis, Insights and Forecast - by Drug Type
- 12. Competitive Analysis
- 12.1. Company Profiles
- 12.1.1 Teva Pharmaceutical Industries Ltd
- 12.1.1.1. Company Overview
- 12.1.1.2. Products
- 12.1.1.3. Company Financials
- 12.1.1.4. SWOT Analysis
- 12.1.2 Merck & Co Inc
- 12.1.2.1. Company Overview
- 12.1.2.2. Products
- 12.1.2.3. Company Financials
- 12.1.2.4. SWOT Analysis
- 12.1.3 Novartis AG
- 12.1.3.1. Company Overview
- 12.1.3.2. Products
- 12.1.3.3. Company Financials
- 12.1.3.4. SWOT Analysis
- 12.1.4 Orchid Healthcare
- 12.1.4.1. Company Overview
- 12.1.4.2. Products
- 12.1.4.3. Company Financials
- 12.1.4.4. SWOT Analysis
- 12.1.5 GlaxoSmithKline plc
- 12.1.5.1. Company Overview
- 12.1.5.2. Products
- 12.1.5.3. Company Financials
- 12.1.5.4. SWOT Analysis
- 12.1.6 Mylan Pharmaceuticals Inc
- 12.1.6.1. Company Overview
- 12.1.6.2. Products
- 12.1.6.3. Company Financials
- 12.1.6.4. SWOT Analysis
- 12.1.7 Helsinn Holding S A
- 12.1.7.1. Company Overview
- 12.1.7.2. Products
- 12.1.7.3. Company Financials
- 12.1.7.4. SWOT Analysis
- 12.1.8 Heron Therapeutics Inc
- 12.1.8.1. Company Overview
- 12.1.8.2. Products
- 12.1.8.3. Company Financials
- 12.1.8.4. SWOT Analysis
- 12.1.9 Sun Pharmaceutical Industries Ltd
- 12.1.9.1. Company Overview
- 12.1.9.2. Products
- 12.1.9.3. Company Financials
- 12.1.9.4. SWOT Analysis
- 12.1.10 Baxter Healthcare
- 12.1.10.1. Company Overview
- 12.1.10.2. Products
- 12.1.10.3. Company Financials
- 12.1.10.4. SWOT Analysis
- 12.1.1 Teva Pharmaceutical Industries Ltd
- 12.2. Market Entropy
- 12.2.1 Company's Key Areas Served
- 12.2.2 Recent Developments
- 12.3. Company Market Share Analysis 2025
- 12.3.1 Top 5 Companies Market Share Analysis
- 12.3.2 Top 3 Companies Market Share Analysis
- 12.4. List of Potential Customers
- 13. Research Methodology
List of Figures
- Figure 1: Global CINV Treatment Market Revenue Breakdown (billion, %) by Region 2025 & 2033
- Figure 2: Global CINV Treatment Market Volume Breakdown (K Unit, %) by Region 2025 & 2033
- Figure 3: North America CINV Treatment Market Revenue (billion), by Drug Type 2025 & 2033
- Figure 4: North America CINV Treatment Market Volume (K Unit), by Drug Type 2025 & 2033
- Figure 5: North America CINV Treatment Market Revenue Share (%), by Drug Type 2025 & 2033
- Figure 6: North America CINV Treatment Market Volume Share (%), by Drug Type 2025 & 2033
- Figure 7: North America CINV Treatment Market Revenue (billion), by End-User 2025 & 2033
- Figure 8: North America CINV Treatment Market Volume (K Unit), by End-User 2025 & 2033
- Figure 9: North America CINV Treatment Market Revenue Share (%), by End-User 2025 & 2033
- Figure 10: North America CINV Treatment Market Volume Share (%), by End-User 2025 & 2033
- Figure 11: North America CINV Treatment Market Revenue (billion), by Country 2025 & 2033
- Figure 12: North America CINV Treatment Market Volume (K Unit), by Country 2025 & 2033
- Figure 13: North America CINV Treatment Market Revenue Share (%), by Country 2025 & 2033
- Figure 14: North America CINV Treatment Market Volume Share (%), by Country 2025 & 2033
- Figure 15: Europe CINV Treatment Market Revenue (billion), by Drug Type 2025 & 2033
- Figure 16: Europe CINV Treatment Market Volume (K Unit), by Drug Type 2025 & 2033
- Figure 17: Europe CINV Treatment Market Revenue Share (%), by Drug Type 2025 & 2033
- Figure 18: Europe CINV Treatment Market Volume Share (%), by Drug Type 2025 & 2033
- Figure 19: Europe CINV Treatment Market Revenue (billion), by End-User 2025 & 2033
- Figure 20: Europe CINV Treatment Market Volume (K Unit), by End-User 2025 & 2033
- Figure 21: Europe CINV Treatment Market Revenue Share (%), by End-User 2025 & 2033
- Figure 22: Europe CINV Treatment Market Volume Share (%), by End-User 2025 & 2033
- Figure 23: Europe CINV Treatment Market Revenue (billion), by Country 2025 & 2033
- Figure 24: Europe CINV Treatment Market Volume (K Unit), by Country 2025 & 2033
- Figure 25: Europe CINV Treatment Market Revenue Share (%), by Country 2025 & 2033
- Figure 26: Europe CINV Treatment Market Volume Share (%), by Country 2025 & 2033
- Figure 27: Asia Pacific CINV Treatment Market Revenue (billion), by Drug Type 2025 & 2033
- Figure 28: Asia Pacific CINV Treatment Market Volume (K Unit), by Drug Type 2025 & 2033
- Figure 29: Asia Pacific CINV Treatment Market Revenue Share (%), by Drug Type 2025 & 2033
- Figure 30: Asia Pacific CINV Treatment Market Volume Share (%), by Drug Type 2025 & 2033
- Figure 31: Asia Pacific CINV Treatment Market Revenue (billion), by End-User 2025 & 2033
- Figure 32: Asia Pacific CINV Treatment Market Volume (K Unit), by End-User 2025 & 2033
- Figure 33: Asia Pacific CINV Treatment Market Revenue Share (%), by End-User 2025 & 2033
- Figure 34: Asia Pacific CINV Treatment Market Volume Share (%), by End-User 2025 & 2033
- Figure 35: Asia Pacific CINV Treatment Market Revenue (billion), by Country 2025 & 2033
- Figure 36: Asia Pacific CINV Treatment Market Volume (K Unit), by Country 2025 & 2033
- Figure 37: Asia Pacific CINV Treatment Market Revenue Share (%), by Country 2025 & 2033
- Figure 38: Asia Pacific CINV Treatment Market Volume Share (%), by Country 2025 & 2033
- Figure 39: Middle East and Africa CINV Treatment Market Revenue (billion), by Drug Type 2025 & 2033
- Figure 40: Middle East and Africa CINV Treatment Market Volume (K Unit), by Drug Type 2025 & 2033
- Figure 41: Middle East and Africa CINV Treatment Market Revenue Share (%), by Drug Type 2025 & 2033
- Figure 42: Middle East and Africa CINV Treatment Market Volume Share (%), by Drug Type 2025 & 2033
- Figure 43: Middle East and Africa CINV Treatment Market Revenue (billion), by End-User 2025 & 2033
- Figure 44: Middle East and Africa CINV Treatment Market Volume (K Unit), by End-User 2025 & 2033
- Figure 45: Middle East and Africa CINV Treatment Market Revenue Share (%), by End-User 2025 & 2033
- Figure 46: Middle East and Africa CINV Treatment Market Volume Share (%), by End-User 2025 & 2033
- Figure 47: Middle East and Africa CINV Treatment Market Revenue (billion), by Country 2025 & 2033
- Figure 48: Middle East and Africa CINV Treatment Market Volume (K Unit), by Country 2025 & 2033
- Figure 49: Middle East and Africa CINV Treatment Market Revenue Share (%), by Country 2025 & 2033
- Figure 50: Middle East and Africa CINV Treatment Market Volume Share (%), by Country 2025 & 2033
- Figure 51: South America CINV Treatment Market Revenue (billion), by Drug Type 2025 & 2033
- Figure 52: South America CINV Treatment Market Volume (K Unit), by Drug Type 2025 & 2033
- Figure 53: South America CINV Treatment Market Revenue Share (%), by Drug Type 2025 & 2033
- Figure 54: South America CINV Treatment Market Volume Share (%), by Drug Type 2025 & 2033
- Figure 55: South America CINV Treatment Market Revenue (billion), by End-User 2025 & 2033
- Figure 56: South America CINV Treatment Market Volume (K Unit), by End-User 2025 & 2033
- Figure 57: South America CINV Treatment Market Revenue Share (%), by End-User 2025 & 2033
- Figure 58: South America CINV Treatment Market Volume Share (%), by End-User 2025 & 2033
- Figure 59: South America CINV Treatment Market Revenue (billion), by Country 2025 & 2033
- Figure 60: South America CINV Treatment Market Volume (K Unit), by Country 2025 & 2033
- Figure 61: South America CINV Treatment Market Revenue Share (%), by Country 2025 & 2033
- Figure 62: South America CINV Treatment Market Volume Share (%), by Country 2025 & 2033
List of Tables
- Table 1: Global CINV Treatment Market Revenue billion Forecast, by Drug Type 2020 & 2033
- Table 2: Global CINV Treatment Market Volume K Unit Forecast, by Drug Type 2020 & 2033
- Table 3: Global CINV Treatment Market Revenue billion Forecast, by End-User 2020 & 2033
- Table 4: Global CINV Treatment Market Volume K Unit Forecast, by End-User 2020 & 2033
- Table 5: Global CINV Treatment Market Revenue billion Forecast, by Region 2020 & 2033
- Table 6: Global CINV Treatment Market Volume K Unit Forecast, by Region 2020 & 2033
- Table 7: Global CINV Treatment Market Revenue billion Forecast, by Drug Type 2020 & 2033
- Table 8: Global CINV Treatment Market Volume K Unit Forecast, by Drug Type 2020 & 2033
- Table 9: Global CINV Treatment Market Revenue billion Forecast, by End-User 2020 & 2033
- Table 10: Global CINV Treatment Market Volume K Unit Forecast, by End-User 2020 & 2033
- Table 11: Global CINV Treatment Market Revenue billion Forecast, by Country 2020 & 2033
- Table 12: Global CINV Treatment Market Volume K Unit Forecast, by Country 2020 & 2033
- Table 13: United States CINV Treatment Market Revenue (billion) Forecast, by Application 2020 & 2033
- Table 14: United States CINV Treatment Market Volume (K Unit) Forecast, by Application 2020 & 2033
- Table 15: Canada CINV Treatment Market Revenue (billion) Forecast, by Application 2020 & 2033
- Table 16: Canada CINV Treatment Market Volume (K Unit) Forecast, by Application 2020 & 2033
- Table 17: Mexico CINV Treatment Market Revenue (billion) Forecast, by Application 2020 & 2033
- Table 18: Mexico CINV Treatment Market Volume (K Unit) Forecast, by Application 2020 & 2033
- Table 19: Global CINV Treatment Market Revenue billion Forecast, by Drug Type 2020 & 2033
- Table 20: Global CINV Treatment Market Volume K Unit Forecast, by Drug Type 2020 & 2033
- Table 21: Global CINV Treatment Market Revenue billion Forecast, by End-User 2020 & 2033
- Table 22: Global CINV Treatment Market Volume K Unit Forecast, by End-User 2020 & 2033
- Table 23: Global CINV Treatment Market Revenue billion Forecast, by Country 2020 & 2033
- Table 24: Global CINV Treatment Market Volume K Unit Forecast, by Country 2020 & 2033
- Table 25: Germany CINV Treatment Market Revenue (billion) Forecast, by Application 2020 & 2033
- Table 26: Germany CINV Treatment Market Volume (K Unit) Forecast, by Application 2020 & 2033
- Table 27: United Kingdom CINV Treatment Market Revenue (billion) Forecast, by Application 2020 & 2033
- Table 28: United Kingdom CINV Treatment Market Volume (K Unit) Forecast, by Application 2020 & 2033
- Table 29: France CINV Treatment Market Revenue (billion) Forecast, by Application 2020 & 2033
- Table 30: France CINV Treatment Market Volume (K Unit) Forecast, by Application 2020 & 2033
- Table 31: Italy CINV Treatment Market Revenue (billion) Forecast, by Application 2020 & 2033
- Table 32: Italy CINV Treatment Market Volume (K Unit) Forecast, by Application 2020 & 2033
- Table 33: Spain CINV Treatment Market Revenue (billion) Forecast, by Application 2020 & 2033
- Table 34: Spain CINV Treatment Market Volume (K Unit) Forecast, by Application 2020 & 2033
- Table 35: Rest of Europe CINV Treatment Market Revenue (billion) Forecast, by Application 2020 & 2033
- Table 36: Rest of Europe CINV Treatment Market Volume (K Unit) Forecast, by Application 2020 & 2033
- Table 37: Global CINV Treatment Market Revenue billion Forecast, by Drug Type 2020 & 2033
- Table 38: Global CINV Treatment Market Volume K Unit Forecast, by Drug Type 2020 & 2033
- Table 39: Global CINV Treatment Market Revenue billion Forecast, by End-User 2020 & 2033
- Table 40: Global CINV Treatment Market Volume K Unit Forecast, by End-User 2020 & 2033
- Table 41: Global CINV Treatment Market Revenue billion Forecast, by Country 2020 & 2033
- Table 42: Global CINV Treatment Market Volume K Unit Forecast, by Country 2020 & 2033
- Table 43: China CINV Treatment Market Revenue (billion) Forecast, by Application 2020 & 2033
- Table 44: China CINV Treatment Market Volume (K Unit) Forecast, by Application 2020 & 2033
- Table 45: Japan CINV Treatment Market Revenue (billion) Forecast, by Application 2020 & 2033
- Table 46: Japan CINV Treatment Market Volume (K Unit) Forecast, by Application 2020 & 2033
- Table 47: India CINV Treatment Market Revenue (billion) Forecast, by Application 2020 & 2033
- Table 48: India CINV Treatment Market Volume (K Unit) Forecast, by Application 2020 & 2033
- Table 49: Australia CINV Treatment Market Revenue (billion) Forecast, by Application 2020 & 2033
- Table 50: Australia CINV Treatment Market Volume (K Unit) Forecast, by Application 2020 & 2033
- Table 51: South Korea CINV Treatment Market Revenue (billion) Forecast, by Application 2020 & 2033
- Table 52: South Korea CINV Treatment Market Volume (K Unit) Forecast, by Application 2020 & 2033
- Table 53: Rest of Asia Pacific CINV Treatment Market Revenue (billion) Forecast, by Application 2020 & 2033
- Table 54: Rest of Asia Pacific CINV Treatment Market Volume (K Unit) Forecast, by Application 2020 & 2033
- Table 55: Global CINV Treatment Market Revenue billion Forecast, by Drug Type 2020 & 2033
- Table 56: Global CINV Treatment Market Volume K Unit Forecast, by Drug Type 2020 & 2033
- Table 57: Global CINV Treatment Market Revenue billion Forecast, by End-User 2020 & 2033
- Table 58: Global CINV Treatment Market Volume K Unit Forecast, by End-User 2020 & 2033
- Table 59: Global CINV Treatment Market Revenue billion Forecast, by Country 2020 & 2033
- Table 60: Global CINV Treatment Market Volume K Unit Forecast, by Country 2020 & 2033
- Table 61: GCC CINV Treatment Market Revenue (billion) Forecast, by Application 2020 & 2033
- Table 62: GCC CINV Treatment Market Volume (K Unit) Forecast, by Application 2020 & 2033
- Table 63: South Africa CINV Treatment Market Revenue (billion) Forecast, by Application 2020 & 2033
- Table 64: South Africa CINV Treatment Market Volume (K Unit) Forecast, by Application 2020 & 2033
- Table 65: Rest of Middle East and Africa CINV Treatment Market Revenue (billion) Forecast, by Application 2020 & 2033
- Table 66: Rest of Middle East and Africa CINV Treatment Market Volume (K Unit) Forecast, by Application 2020 & 2033
- Table 67: Global CINV Treatment Market Revenue billion Forecast, by Drug Type 2020 & 2033
- Table 68: Global CINV Treatment Market Volume K Unit Forecast, by Drug Type 2020 & 2033
- Table 69: Global CINV Treatment Market Revenue billion Forecast, by End-User 2020 & 2033
- Table 70: Global CINV Treatment Market Volume K Unit Forecast, by End-User 2020 & 2033
- Table 71: Global CINV Treatment Market Revenue billion Forecast, by Country 2020 & 2033
- Table 72: Global CINV Treatment Market Volume K Unit Forecast, by Country 2020 & 2033
- Table 73: Brazil CINV Treatment Market Revenue (billion) Forecast, by Application 2020 & 2033
- Table 74: Brazil CINV Treatment Market Volume (K Unit) Forecast, by Application 2020 & 2033
- Table 75: Argentina CINV Treatment Market Revenue (billion) Forecast, by Application 2020 & 2033
- Table 76: Argentina CINV Treatment Market Volume (K Unit) Forecast, by Application 2020 & 2033
- Table 77: Rest of South America CINV Treatment Market Revenue (billion) Forecast, by Application 2020 & 2033
- Table 78: Rest of South America CINV Treatment Market Volume (K Unit) Forecast, by Application 2020 & 2033
Frequently Asked Questions
1. What is the projected Compound Annual Growth Rate (CAGR) of the CINV Treatment Market?
The projected CAGR is approximately 5.87%.
2. Which companies are prominent players in the CINV Treatment Market?
Key companies in the market include Teva Pharmaceutical Industries Ltd , Merck & Co Inc, Novartis AG, Orchid Healthcare, GlaxoSmithKline plc, Mylan Pharmaceuticals Inc, Helsinn Holding S A, Heron Therapeutics Inc, Sun Pharmaceutical Industries Ltd, Baxter Healthcare.
3. What are the main segments of the CINV Treatment Market?
The market segments include Drug Type, End-User.
4. Can you provide details about the market size?
The market size is estimated to be USD 5.38 billion as of 2022.
5. What are some drivers contributing to market growth?
; Increasing Prevalence of Cancer; Rising Research and Development Activities for Cancer Treatments.
6. What are the notable trends driving market growth?
Speciality Clinics Segment is expected to Grow at a Faster rate in the Forecast Period.
7. Are there any restraints impacting market growth?
; Lack of Awareness of the available Drugs.
8. Can you provide examples of recent developments in the market?
N/A
9. What pricing options are available for accessing the report?
Pricing options include single-user, multi-user, and enterprise licenses priced at USD 4750, USD 5250, and USD 8750 respectively.
10. Is the market size provided in terms of value or volume?
The market size is provided in terms of value, measured in billion and volume, measured in K Unit.
11. Are there any specific market keywords associated with the report?
Yes, the market keyword associated with the report is "CINV Treatment Market," which aids in identifying and referencing the specific market segment covered.
12. How do I determine which pricing option suits my needs best?
The pricing options vary based on user requirements and access needs. Individual users may opt for single-user licenses, while businesses requiring broader access may choose multi-user or enterprise licenses for cost-effective access to the report.
13. Are there any additional resources or data provided in the CINV Treatment Market report?
While the report offers comprehensive insights, it's advisable to review the specific contents or supplementary materials provided to ascertain if additional resources or data are available.
14. How can I stay updated on further developments or reports in the CINV Treatment Market?
To stay informed about further developments, trends, and reports in the CINV Treatment Market, consider subscribing to industry newsletters, following relevant companies and organizations, or regularly checking reputable industry news sources and publications.
Methodology
Step 1 - Identification of Relevant Samples Size from Population Database


Step 2 - Approaches for Defining Global Market Size (Value, Volume* & Price*)

Note*: In applicable scenarios
Step 3 - Data Sources
Primary Research
- Web Analytics
- Survey Reports
- Research Institute
- Latest Research Reports
- Opinion Leaders
Secondary Research
- Annual Reports
- White Paper
- Latest Press Release
- Industry Association
- Paid Database
- Investor Presentations

Step 4 - Data Triangulation
Involves using different sources of information in order to increase the validity of a study
These sources are likely to be stakeholders in a program - participants, other researchers, program staff, other community members, and so on.
Then we put all data in single framework & apply various statistical tools to find out the dynamic on the market.
During the analysis stage, feedback from the stakeholder groups would be compared to determine areas of agreement as well as areas of divergence