

Key Insights
The Bovine Collagen Graft market is poised for significant expansion, projected to reach approximately $1.17 billion in 2025, with a robust Compound Annual Growth Rate (CAGR) of 10.16% anticipated through 2033. This growth trajectory is primarily fueled by the increasing demand for advanced wound care solutions, the escalating prevalence of orthopedic and reconstructive surgeries, and the rising awareness among healthcare professionals and patients regarding the efficacy of collagen-based biomaterials. Key applications driving this expansion include bone graft substitutes, which benefit from collagen's osteoconductive properties, and skin substitutes, vital for managing chronic wounds and burns. Hemostats also represent a significant segment, leveraging collagen's hemostatic capabilities to control bleeding during surgical procedures. The market's dynamism is further supported by continuous innovation in product development, leading to enhanced bio-compatibility and functional performance of bovine collagen grafts.
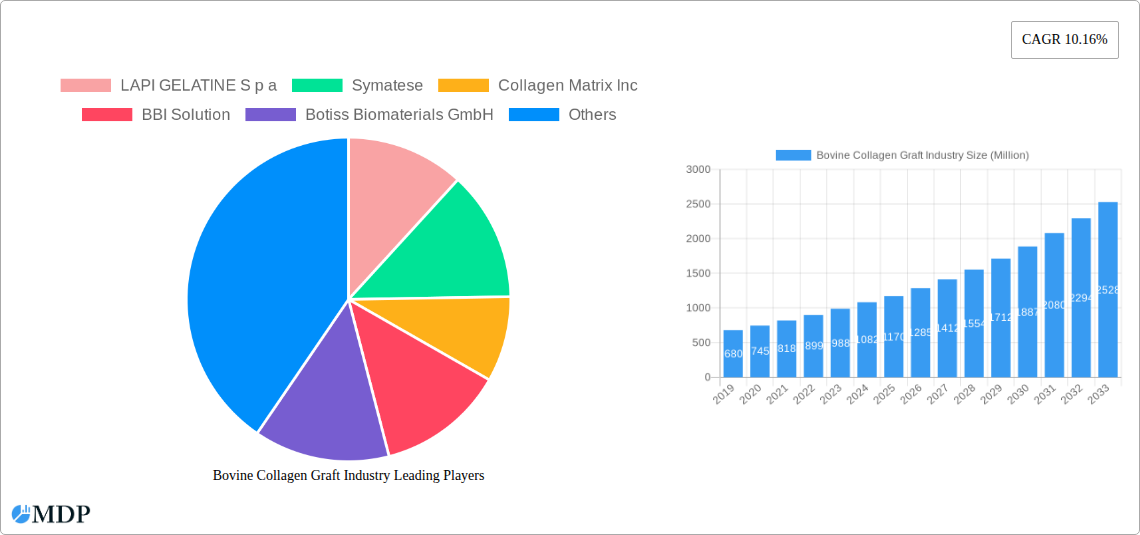
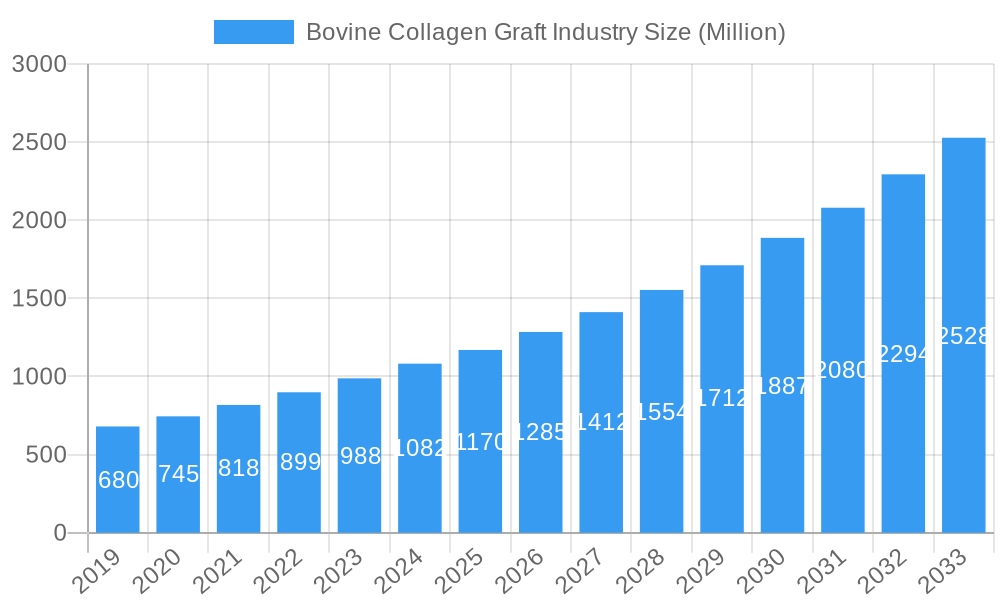
Bovine Collagen Graft Industry Market Size (In Million)
The market's growth is also shaped by emerging trends such as the increasing adoption of minimally invasive surgical techniques, which often necessitate advanced graft materials for optimal healing. Furthermore, a growing emphasis on regenerative medicine and tissue engineering is propelling research and development into novel collagen-based applications. However, certain factors could temper this growth, including stringent regulatory hurdles for biomaterial approvals and the availability of alternative graft materials. Despite these challenges, the inherent biocompatibility and biodegradability of bovine collagen, coupled with its cost-effectiveness compared to some alternatives, position it favorably for continued market penetration. Hospitals, clinics, and ambulatory surgical centers are expected to be the dominant end-use segments, driven by their high volume of surgical procedures and increasing investment in advanced medical technologies.
Bovine Collagen Graft Industry Company Market Share
Unlocking the Potential: Bovine Collagen Graft Industry Market Insights 2025-2033
This comprehensive report offers an in-depth analysis of the global Bovine Collagen Graft Industry, forecasting its trajectory from 2025 to 2033. Covering a critical study period of 2019-2033, with a base year of 2025, this report provides actionable intelligence for stakeholders navigating this dynamic and high-growth sector. Our analysis delves into market size, segmentation, competitive landscapes, and emerging trends, equipping you with the insights needed to capitalize on the burgeoning opportunities in bone graft substitutes, collagen-based scaffolds, hemostats, skin substitutes, cartilage repairs, and other vital applications. We project the market to reach $3,500 Million by 2033, with a compound annual growth rate (CAGR) of 7.8% during the forecast period.
Bovine Collagen Graft Industry Market Dynamics & Concentration
The Bovine Collagen Graft Industry is characterized by a moderately concentrated market structure, with leading players holding significant market share estimated at 65%. Innovation is a key driver, fueled by advancements in biomaterials and tissue engineering, with a projected 20% increase in R&D expenditure over the forecast period. Regulatory frameworks, particularly those governing medical devices and regenerative therapies, play a crucial role in shaping market entry and product approval. Product substitutes, such as synthetic grafts and other naturally derived collagens, present a competitive challenge, although bovine collagen's biocompatibility and cost-effectiveness maintain its strong position. End-user trends indicate a growing preference for minimally invasive procedures and regenerative solutions, driving demand in hospitals and clinics. Merger and acquisition (M&A) activities are anticipated to rise, with an estimated 15 significant deals projected by 2033, as companies seek to consolidate market presence and expand their product portfolios.
Bovine Collagen Graft Industry Industry Trends & Analysis
The Bovine Collagen Graft Industry is experiencing robust growth, propelled by increasing awareness of regenerative medicine and the rising incidence of orthopedic and dermatological conditions requiring advanced treatment modalities. The market is forecast to expand significantly, driven by the inherent biocompatibility and bioresorbability of bovine collagen, which makes it an ideal scaffold material for tissue regeneration. Technological disruptions are at the forefront, with ongoing research and development focused on enhancing the mechanical properties, controlled release capabilities, and immunomodulatory effects of bovine collagen grafts. This includes the development of advanced cross-linking techniques and the incorporation of bioactive molecules to accelerate healing.
Consumer preferences are shifting towards treatments that offer faster recovery times and improved functional outcomes, directly benefiting the adoption of bovine collagen-based products. The growing aging population and the increasing prevalence of chronic diseases, such as osteoarthritis and chronic wounds, are substantial market growth drivers. Furthermore, the expanding healthcare infrastructure in emerging economies and a greater emphasis on patient-specific treatments are creating new avenues for market penetration.
The competitive dynamics within the industry are intensifying, with companies investing heavily in product differentiation and intellectual property protection. Strategic partnerships between research institutions and commercial entities are fostering innovation and accelerating the translation of novel technologies into marketable products. The market penetration of bovine collagen grafts is projected to reach 35% by 2033, a testament to their increasing acceptance and efficacy in clinical practice. The overall market value is estimated to reach $3,500 Million by 2033, with a projected CAGR of 7.8% during the forecast period.
Leading Markets & Segments in Bovine Collagen Graft Industry
The North American region is expected to lead the Bovine Collagen Graft Industry, driven by a highly developed healthcare system, significant investment in biomedical research, and a high prevalence of orthopedic and reconstructive surgical procedures. Within North America, the United States holds a dominant position due to its advanced technological infrastructure and a robust regulatory environment that supports innovation.
The Bone Graft Substitutes segment is anticipated to be the largest application within the industry, accounting for an estimated 30% of the market share. This dominance is attributed to the increasing demand for effective solutions to address bone defects arising from trauma, degenerative diseases, and surgical interventions. The growing number of spinal fusion surgeries and joint replacement procedures further fuels this segment.
Another key segment is Collagen-based Scaffolds, which is projected to witness significant growth at a CAGR of 8.2%. These scaffolds are crucial for tissue engineering and regenerative medicine applications, providing a framework for cell growth and tissue regeneration in various medical specialties.
- Key Drivers for Dominance:
- Economic Policies: Favorable reimbursement policies for advanced medical treatments and regenerative therapies in developed nations.
- Infrastructure: Well-established hospital and clinic networks equipped with advanced surgical and diagnostic technologies.
- Research & Development Investment: Sustained funding for biomaterial research and clinical trials in key regions.
- Awareness and Adoption: High patient and physician awareness regarding the benefits of collagen-based regenerative solutions.
The Hospitals end-use segment will continue to be the primary consumer of bovine collagen grafts, representing an estimated 55% of the market. This is due to the complex surgical procedures typically performed in hospital settings, requiring advanced biomaterials for optimal patient outcomes.
Bovine Collagen Graft Industry Product Developments
The Bovine Collagen Graft Industry is witnessing a surge in innovative product developments, focusing on enhancing biocompatibility, promoting controlled cell proliferation, and improving the integration with host tissues. Key advancements include the development of decellularized bovine collagen matrices with optimized pore structures for improved cell infiltration and vascularization. Furthermore, researchers are exploring the functionalization of collagen grafts with growth factors and other bioactive molecules to accelerate tissue regeneration and reduce inflammation. These innovations offer competitive advantages by providing superior healing profiles, reduced risk of rejection, and faster patient recovery, thereby addressing unmet clinical needs in areas like orthopedic repair and wound healing.
Key Drivers of Bovine Collagen Graft Industry Growth
The Bovine Collagen Graft Industry's growth is propelled by several key factors. The increasing prevalence of orthopedic and musculoskeletal disorders, coupled with an aging global population, drives demand for effective bone graft substitutes and cartilage repair solutions. Advances in biomaterial science and tissue engineering are leading to the development of more sophisticated and effective collagen-based scaffolds and skin substitutes, enhancing patient outcomes and treatment efficacy. Furthermore, favorable regulatory pathways for regenerative medicine products in key markets and increasing healthcare expenditure worldwide are significant economic catalysts. The growing awareness among healthcare professionals and patients regarding the benefits of collagen-based regenerative therapies is also a crucial growth accelerator.
Challenges in the Bovine Collagen Graft Industry Market
Despite the promising growth, the Bovine Collagen Graft Industry faces several challenges. Stringent regulatory approvals for medical devices and biomaterials can lead to extended development timelines and increased costs. Concerns regarding potential immunogenic responses and the risk of disease transmission, though minimized through rigorous sourcing and processing, can impact market acceptance. The availability and sourcing of high-quality bovine collagen, ensuring consistency and traceability, can also pose supply chain challenges. Moreover, the presence of established synthetic alternatives and other naturally derived biomaterials creates competitive pressures, necessitating continuous innovation and cost-effectiveness.
Emerging Opportunities in Bovine Collagen Graft Industry
Emerging opportunities in the Bovine Collagen Graft Industry lie in the continuous innovation of advanced biomaterials and the expansion into new therapeutic areas. The development of customized bovine collagen scaffolds for patient-specific treatments, leveraging 3D printing technologies, presents a significant growth catalyst. Strategic partnerships between collagen manufacturers, medical device companies, and research institutions are crucial for accelerating product development and market penetration. Expanding into the veterinary sector for regenerative applications in animals also offers a promising avenue. Furthermore, the growing demand for aesthetic and reconstructive surgical procedures globally presents a substantial opportunity for collagen-based dermal fillers and tissue augmentation products.
Leading Players in the Bovine Collagen Graft Industry Sector
- LAPI GELATINE S p a
- Symatese
- Collagen Matrix Inc
- BBI Solution
- Botiss Biomaterials GmbH
- Titan Biotech
- Medtronic PLC
- Foodmate Co Ltd
- DCP Ingredients (DCP B V )
- Kyeron
- Rousselot
- Collagen Solutions PLC
Key Milestones in Bovine Collagen Graft Industry Industry
- August 2022: Roots Brands launched a blend of hydrolyzed bovine collagen and whole colostrum powder available as a youth-enhancing supplement. Utilizing bovine collagen's capacity to encourage the production of types I and III collagen in people, GMBMY asserts to aid in increasing skin moisture, improving suppleness, and reducing wrinkles.
- March 2022: Aleph Farms announced it is expanding its product line to include a unique platform for cell-cultured collagen production. Aleph Frontiers is a division of Aleph Farms' research center focused on developing new technologies and products for eventual commercialization.
Strategic Outlook for Bovine Collagen Graft Industry Market
The strategic outlook for the Bovine Collagen Graft Industry is highly positive, characterized by sustained innovation and market expansion. Future growth will be driven by the increasing adoption of regenerative medicine principles, fueled by advancements in biomaterial science and a deeper understanding of collagen's role in tissue healing. Companies are expected to focus on developing enhanced collagen matrices with specific functionalities, such as controlled drug delivery and improved integration with host tissues. Strategic collaborations with academic institutions and other industry players will be crucial for accelerating the development of novel applications and expanding into emerging markets. The growing demand for minimally invasive procedures and personalized medicine will further shape the market, creating opportunities for tailored collagen-based solutions.
Bovine Collagen Graft Industry Segmentation
-
1. Application
- 1.1. Bone Graft Substitutes
- 1.2. Collagen-based Scaffolds
- 1.3. Hemostats
- 1.4. Skin Substitutes
- 1.5. Cartilage Repairs
- 1.6. Others
-
2. End-use
- 2.1. Hospitals
- 2.2. Clinics
- 2.3. Ambulatory Surgical Centers
- 2.4. Research Institutes
Bovine Collagen Graft Industry Segmentation By Geography
-
1. North America
- 1.1. United States
- 1.2. Canada
- 1.3. Mexico
-
2. Europe
- 2.1. Germany
- 2.2. United Kingdom
- 2.3. France
- 2.4. Italy
- 2.5. Spain
- 2.6. Rest of Europe
-
3. Asia Pacific
- 3.1. China
- 3.2. Japan
- 3.3. India
- 3.4. Australia
- 3.5. South Korea
- 3.6. Rest of Asia Pacific
- 4. Rest of the World
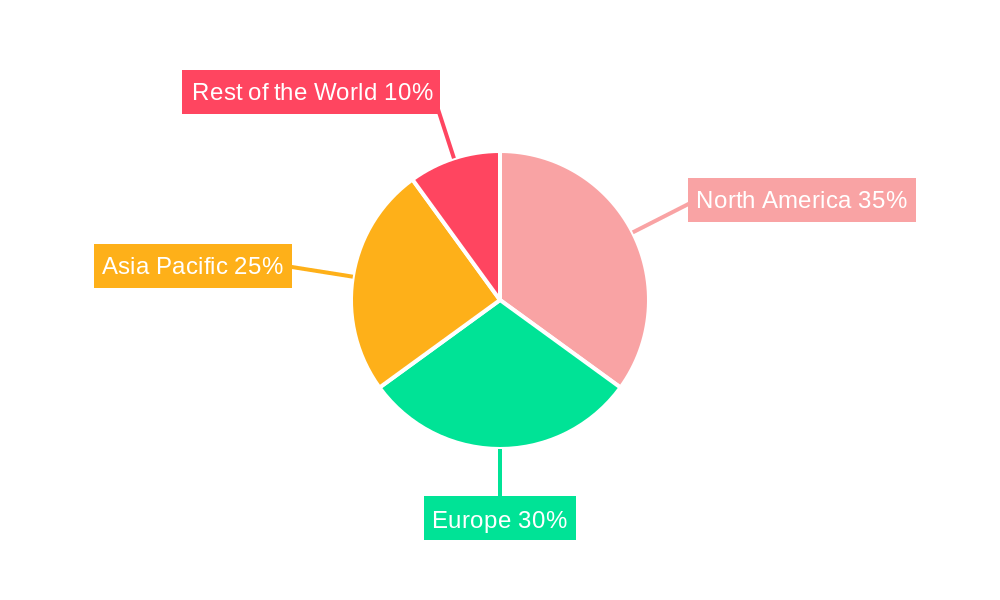
Bovine Collagen Graft Industry Regional Market Share
Geographic Coverage of Bovine Collagen Graft Industry
Bovine Collagen Graft Industry REPORT HIGHLIGHTS
| Aspects | Details |
|---|---|
| Study Period | 2020-2034 |
| Base Year | 2025 |
| Estimated Year | 2026 |
| Forecast Period | 2026-2034 |
| Historical Period | 2020-2025 |
| Growth Rate | CAGR of 10.16% from 2020-2034 |
| Segmentation |
|
Table of Contents
- 1. Introduction
- 1.1. Research Scope
- 1.2. Market Segmentation
- 1.3. Research Objective
- 1.4. Definitions and Assumptions
- 2. Executive Summary
- 2.1. Market Snapshot
- 3. Market Dynamics
- 3.1. Market Drivers
- 3.2. Market Restrains
- 3.3. Market Trends
- 3.4. Market Opportunities
- 4. Market Factor Analysis
- 4.1. Porters Five Forces
- 4.1.1. Bargaining Power of Suppliers
- 4.1.2. Bargaining Power of Buyers
- 4.1.3. Threat of New Entrants
- 4.1.4. Threat of Substitutes
- 4.1.5. Competitive Rivalry
- 4.2. PESTEL analysis
- 4.3. BCG Analysis
- 4.3.1. Stars (High Growth, High Market Share)
- 4.3.2. Cash Cows (Low Growth, High Market Share)
- 4.3.3. Question Mark (High Growth, Low Market Share)
- 4.3.4. Dogs (Low Growth, Low Market Share)
- 4.4. Ansoff Matrix Analysis
- 4.5. Supply Chain Analysis
- 4.6. Regulatory Landscape
- 4.7. Current Market Potential and Opportunity Assessment (TAM–SAM–SOM Framework)
- 4.8. MDP Analyst Note
- 4.1. Porters Five Forces
- 5. Market Analysis, Insights and Forecast 2021-2033
- 5.1. Market Analysis, Insights and Forecast - by Application
- 5.1.1. Bone Graft Substitutes
- 5.1.2. Collagen-based Scaffolds
- 5.1.3. Hemostats
- 5.1.4. Skin Substitutes
- 5.1.5. Cartilage Repairs
- 5.1.6. Others
- 5.2. Market Analysis, Insights and Forecast - by End-use
- 5.2.1. Hospitals
- 5.2.2. Clinics
- 5.2.3. Ambulatory Surgical Centers
- 5.2.4. Research Institutes
- 5.3. Market Analysis, Insights and Forecast - by Region
- 5.3.1. North America
- 5.3.2. Europe
- 5.3.3. Asia Pacific
- 5.3.4. Rest of the World
- 5.1. Market Analysis, Insights and Forecast - by Application
- 6. Global Bovine Collagen Graft Industry Analysis, Insights and Forecast, 2021-2033
- 6.1. Market Analysis, Insights and Forecast - by Application
- 6.1.1. Bone Graft Substitutes
- 6.1.2. Collagen-based Scaffolds
- 6.1.3. Hemostats
- 6.1.4. Skin Substitutes
- 6.1.5. Cartilage Repairs
- 6.1.6. Others
- 6.2. Market Analysis, Insights and Forecast - by End-use
- 6.2.1. Hospitals
- 6.2.2. Clinics
- 6.2.3. Ambulatory Surgical Centers
- 6.2.4. Research Institutes
- 6.1. Market Analysis, Insights and Forecast - by Application
- 7. North America Bovine Collagen Graft Industry Analysis, Insights and Forecast, 2020-2032
- 7.1. Market Analysis, Insights and Forecast - by Application
- 7.1.1. Bone Graft Substitutes
- 7.1.2. Collagen-based Scaffolds
- 7.1.3. Hemostats
- 7.1.4. Skin Substitutes
- 7.1.5. Cartilage Repairs
- 7.1.6. Others
- 7.2. Market Analysis, Insights and Forecast - by End-use
- 7.2.1. Hospitals
- 7.2.2. Clinics
- 7.2.3. Ambulatory Surgical Centers
- 7.2.4. Research Institutes
- 7.1. Market Analysis, Insights and Forecast - by Application
- 8. Europe Bovine Collagen Graft Industry Analysis, Insights and Forecast, 2020-2032
- 8.1. Market Analysis, Insights and Forecast - by Application
- 8.1.1. Bone Graft Substitutes
- 8.1.2. Collagen-based Scaffolds
- 8.1.3. Hemostats
- 8.1.4. Skin Substitutes
- 8.1.5. Cartilage Repairs
- 8.1.6. Others
- 8.2. Market Analysis, Insights and Forecast - by End-use
- 8.2.1. Hospitals
- 8.2.2. Clinics
- 8.2.3. Ambulatory Surgical Centers
- 8.2.4. Research Institutes
- 8.1. Market Analysis, Insights and Forecast - by Application
- 9. Asia Pacific Bovine Collagen Graft Industry Analysis, Insights and Forecast, 2020-2032
- 9.1. Market Analysis, Insights and Forecast - by Application
- 9.1.1. Bone Graft Substitutes
- 9.1.2. Collagen-based Scaffolds
- 9.1.3. Hemostats
- 9.1.4. Skin Substitutes
- 9.1.5. Cartilage Repairs
- 9.1.6. Others
- 9.2. Market Analysis, Insights and Forecast - by End-use
- 9.2.1. Hospitals
- 9.2.2. Clinics
- 9.2.3. Ambulatory Surgical Centers
- 9.2.4. Research Institutes
- 9.1. Market Analysis, Insights and Forecast - by Application
- 10. Rest of the World Bovine Collagen Graft Industry Analysis, Insights and Forecast, 2020-2032
- 10.1. Market Analysis, Insights and Forecast - by Application
- 10.1.1. Bone Graft Substitutes
- 10.1.2. Collagen-based Scaffolds
- 10.1.3. Hemostats
- 10.1.4. Skin Substitutes
- 10.1.5. Cartilage Repairs
- 10.1.6. Others
- 10.2. Market Analysis, Insights and Forecast - by End-use
- 10.2.1. Hospitals
- 10.2.2. Clinics
- 10.2.3. Ambulatory Surgical Centers
- 10.2.4. Research Institutes
- 10.1. Market Analysis, Insights and Forecast - by Application
- 11. Competitive Analysis
- 11.1. Company Profiles
- 11.1.1 LAPI GELATINE S p a
- 11.1.1.1. Company Overview
- 11.1.1.2. Products
- 11.1.1.3. Company Financials
- 11.1.1.4. SWOT Analysis
- 11.1.2 Symatese
- 11.1.2.1. Company Overview
- 11.1.2.2. Products
- 11.1.2.3. Company Financials
- 11.1.2.4. SWOT Analysis
- 11.1.3 Collagen Matrix Inc
- 11.1.3.1. Company Overview
- 11.1.3.2. Products
- 11.1.3.3. Company Financials
- 11.1.3.4. SWOT Analysis
- 11.1.4 BBI Solution
- 11.1.4.1. Company Overview
- 11.1.4.2. Products
- 11.1.4.3. Company Financials
- 11.1.4.4. SWOT Analysis
- 11.1.5 Botiss Biomaterials GmbH
- 11.1.5.1. Company Overview
- 11.1.5.2. Products
- 11.1.5.3. Company Financials
- 11.1.5.4. SWOT Analysis
- 11.1.6 Titan Biotech
- 11.1.6.1. Company Overview
- 11.1.6.2. Products
- 11.1.6.3. Company Financials
- 11.1.6.4. SWOT Analysis
- 11.1.7 Medtronic PLC
- 11.1.7.1. Company Overview
- 11.1.7.2. Products
- 11.1.7.3. Company Financials
- 11.1.7.4. SWOT Analysis
- 11.1.8 Foodmate Co Ltd
- 11.1.8.1. Company Overview
- 11.1.8.2. Products
- 11.1.8.3. Company Financials
- 11.1.8.4. SWOT Analysis
- 11.1.9 DCP Ingredients (DCP B V )
- 11.1.9.1. Company Overview
- 11.1.9.2. Products
- 11.1.9.3. Company Financials
- 11.1.9.4. SWOT Analysis
- 11.1.10 Kyeron
- 11.1.10.1. Company Overview
- 11.1.10.2. Products
- 11.1.10.3. Company Financials
- 11.1.10.4. SWOT Analysis
- 11.1.11 Rousselot
- 11.1.11.1. Company Overview
- 11.1.11.2. Products
- 11.1.11.3. Company Financials
- 11.1.11.4. SWOT Analysis
- 11.1.12 Collagen Solutions PLC
- 11.1.12.1. Company Overview
- 11.1.12.2. Products
- 11.1.12.3. Company Financials
- 11.1.12.4. SWOT Analysis
- 11.1.1 LAPI GELATINE S p a
- 11.2. Market Entropy
- 11.2.1 Company's Key Areas Served
- 11.2.2 Recent Developments
- 11.3. Company Market Share Analysis 2025
- 11.3.1 Top 5 Companies Market Share Analysis
- 11.3.2 Top 3 Companies Market Share Analysis
- 11.4. List of Potential Customers
- 12. Research Methodology
List of Figures
- Figure 1: Global Bovine Collagen Graft Industry Revenue Breakdown (Million, %) by Region 2025 & 2033
- Figure 2: Global Bovine Collagen Graft Industry Volume Breakdown (K Unit, %) by Region 2025 & 2033
- Figure 3: North America Bovine Collagen Graft Industry Revenue (Million), by Application 2025 & 2033
- Figure 4: North America Bovine Collagen Graft Industry Volume (K Unit), by Application 2025 & 2033
- Figure 5: North America Bovine Collagen Graft Industry Revenue Share (%), by Application 2025 & 2033
- Figure 6: North America Bovine Collagen Graft Industry Volume Share (%), by Application 2025 & 2033
- Figure 7: North America Bovine Collagen Graft Industry Revenue (Million), by End-use 2025 & 2033
- Figure 8: North America Bovine Collagen Graft Industry Volume (K Unit), by End-use 2025 & 2033
- Figure 9: North America Bovine Collagen Graft Industry Revenue Share (%), by End-use 2025 & 2033
- Figure 10: North America Bovine Collagen Graft Industry Volume Share (%), by End-use 2025 & 2033
- Figure 11: North America Bovine Collagen Graft Industry Revenue (Million), by Country 2025 & 2033
- Figure 12: North America Bovine Collagen Graft Industry Volume (K Unit), by Country 2025 & 2033
- Figure 13: North America Bovine Collagen Graft Industry Revenue Share (%), by Country 2025 & 2033
- Figure 14: North America Bovine Collagen Graft Industry Volume Share (%), by Country 2025 & 2033
- Figure 15: Europe Bovine Collagen Graft Industry Revenue (Million), by Application 2025 & 2033
- Figure 16: Europe Bovine Collagen Graft Industry Volume (K Unit), by Application 2025 & 2033
- Figure 17: Europe Bovine Collagen Graft Industry Revenue Share (%), by Application 2025 & 2033
- Figure 18: Europe Bovine Collagen Graft Industry Volume Share (%), by Application 2025 & 2033
- Figure 19: Europe Bovine Collagen Graft Industry Revenue (Million), by End-use 2025 & 2033
- Figure 20: Europe Bovine Collagen Graft Industry Volume (K Unit), by End-use 2025 & 2033
- Figure 21: Europe Bovine Collagen Graft Industry Revenue Share (%), by End-use 2025 & 2033
- Figure 22: Europe Bovine Collagen Graft Industry Volume Share (%), by End-use 2025 & 2033
- Figure 23: Europe Bovine Collagen Graft Industry Revenue (Million), by Country 2025 & 2033
- Figure 24: Europe Bovine Collagen Graft Industry Volume (K Unit), by Country 2025 & 2033
- Figure 25: Europe Bovine Collagen Graft Industry Revenue Share (%), by Country 2025 & 2033
- Figure 26: Europe Bovine Collagen Graft Industry Volume Share (%), by Country 2025 & 2033
- Figure 27: Asia Pacific Bovine Collagen Graft Industry Revenue (Million), by Application 2025 & 2033
- Figure 28: Asia Pacific Bovine Collagen Graft Industry Volume (K Unit), by Application 2025 & 2033
- Figure 29: Asia Pacific Bovine Collagen Graft Industry Revenue Share (%), by Application 2025 & 2033
- Figure 30: Asia Pacific Bovine Collagen Graft Industry Volume Share (%), by Application 2025 & 2033
- Figure 31: Asia Pacific Bovine Collagen Graft Industry Revenue (Million), by End-use 2025 & 2033
- Figure 32: Asia Pacific Bovine Collagen Graft Industry Volume (K Unit), by End-use 2025 & 2033
- Figure 33: Asia Pacific Bovine Collagen Graft Industry Revenue Share (%), by End-use 2025 & 2033
- Figure 34: Asia Pacific Bovine Collagen Graft Industry Volume Share (%), by End-use 2025 & 2033
- Figure 35: Asia Pacific Bovine Collagen Graft Industry Revenue (Million), by Country 2025 & 2033
- Figure 36: Asia Pacific Bovine Collagen Graft Industry Volume (K Unit), by Country 2025 & 2033
- Figure 37: Asia Pacific Bovine Collagen Graft Industry Revenue Share (%), by Country 2025 & 2033
- Figure 38: Asia Pacific Bovine Collagen Graft Industry Volume Share (%), by Country 2025 & 2033
- Figure 39: Rest of the World Bovine Collagen Graft Industry Revenue (Million), by Application 2025 & 2033
- Figure 40: Rest of the World Bovine Collagen Graft Industry Volume (K Unit), by Application 2025 & 2033
- Figure 41: Rest of the World Bovine Collagen Graft Industry Revenue Share (%), by Application 2025 & 2033
- Figure 42: Rest of the World Bovine Collagen Graft Industry Volume Share (%), by Application 2025 & 2033
- Figure 43: Rest of the World Bovine Collagen Graft Industry Revenue (Million), by End-use 2025 & 2033
- Figure 44: Rest of the World Bovine Collagen Graft Industry Volume (K Unit), by End-use 2025 & 2033
- Figure 45: Rest of the World Bovine Collagen Graft Industry Revenue Share (%), by End-use 2025 & 2033
- Figure 46: Rest of the World Bovine Collagen Graft Industry Volume Share (%), by End-use 2025 & 2033
- Figure 47: Rest of the World Bovine Collagen Graft Industry Revenue (Million), by Country 2025 & 2033
- Figure 48: Rest of the World Bovine Collagen Graft Industry Volume (K Unit), by Country 2025 & 2033
- Figure 49: Rest of the World Bovine Collagen Graft Industry Revenue Share (%), by Country 2025 & 2033
- Figure 50: Rest of the World Bovine Collagen Graft Industry Volume Share (%), by Country 2025 & 2033
List of Tables
- Table 1: Global Bovine Collagen Graft Industry Revenue Million Forecast, by Application 2020 & 2033
- Table 2: Global Bovine Collagen Graft Industry Volume K Unit Forecast, by Application 2020 & 2033
- Table 3: Global Bovine Collagen Graft Industry Revenue Million Forecast, by End-use 2020 & 2033
- Table 4: Global Bovine Collagen Graft Industry Volume K Unit Forecast, by End-use 2020 & 2033
- Table 5: Global Bovine Collagen Graft Industry Revenue Million Forecast, by Region 2020 & 2033
- Table 6: Global Bovine Collagen Graft Industry Volume K Unit Forecast, by Region 2020 & 2033
- Table 7: Global Bovine Collagen Graft Industry Revenue Million Forecast, by Application 2020 & 2033
- Table 8: Global Bovine Collagen Graft Industry Volume K Unit Forecast, by Application 2020 & 2033
- Table 9: Global Bovine Collagen Graft Industry Revenue Million Forecast, by End-use 2020 & 2033
- Table 10: Global Bovine Collagen Graft Industry Volume K Unit Forecast, by End-use 2020 & 2033
- Table 11: Global Bovine Collagen Graft Industry Revenue Million Forecast, by Country 2020 & 2033
- Table 12: Global Bovine Collagen Graft Industry Volume K Unit Forecast, by Country 2020 & 2033
- Table 13: United States Bovine Collagen Graft Industry Revenue (Million) Forecast, by Application 2020 & 2033
- Table 14: United States Bovine Collagen Graft Industry Volume (K Unit) Forecast, by Application 2020 & 2033
- Table 15: Canada Bovine Collagen Graft Industry Revenue (Million) Forecast, by Application 2020 & 2033
- Table 16: Canada Bovine Collagen Graft Industry Volume (K Unit) Forecast, by Application 2020 & 2033
- Table 17: Mexico Bovine Collagen Graft Industry Revenue (Million) Forecast, by Application 2020 & 2033
- Table 18: Mexico Bovine Collagen Graft Industry Volume (K Unit) Forecast, by Application 2020 & 2033
- Table 19: Global Bovine Collagen Graft Industry Revenue Million Forecast, by Application 2020 & 2033
- Table 20: Global Bovine Collagen Graft Industry Volume K Unit Forecast, by Application 2020 & 2033
- Table 21: Global Bovine Collagen Graft Industry Revenue Million Forecast, by End-use 2020 & 2033
- Table 22: Global Bovine Collagen Graft Industry Volume K Unit Forecast, by End-use 2020 & 2033
- Table 23: Global Bovine Collagen Graft Industry Revenue Million Forecast, by Country 2020 & 2033
- Table 24: Global Bovine Collagen Graft Industry Volume K Unit Forecast, by Country 2020 & 2033
- Table 25: Germany Bovine Collagen Graft Industry Revenue (Million) Forecast, by Application 2020 & 2033
- Table 26: Germany Bovine Collagen Graft Industry Volume (K Unit) Forecast, by Application 2020 & 2033
- Table 27: United Kingdom Bovine Collagen Graft Industry Revenue (Million) Forecast, by Application 2020 & 2033
- Table 28: United Kingdom Bovine Collagen Graft Industry Volume (K Unit) Forecast, by Application 2020 & 2033
- Table 29: France Bovine Collagen Graft Industry Revenue (Million) Forecast, by Application 2020 & 2033
- Table 30: France Bovine Collagen Graft Industry Volume (K Unit) Forecast, by Application 2020 & 2033
- Table 31: Italy Bovine Collagen Graft Industry Revenue (Million) Forecast, by Application 2020 & 2033
- Table 32: Italy Bovine Collagen Graft Industry Volume (K Unit) Forecast, by Application 2020 & 2033
- Table 33: Spain Bovine Collagen Graft Industry Revenue (Million) Forecast, by Application 2020 & 2033
- Table 34: Spain Bovine Collagen Graft Industry Volume (K Unit) Forecast, by Application 2020 & 2033
- Table 35: Rest of Europe Bovine Collagen Graft Industry Revenue (Million) Forecast, by Application 2020 & 2033
- Table 36: Rest of Europe Bovine Collagen Graft Industry Volume (K Unit) Forecast, by Application 2020 & 2033
- Table 37: Global Bovine Collagen Graft Industry Revenue Million Forecast, by Application 2020 & 2033
- Table 38: Global Bovine Collagen Graft Industry Volume K Unit Forecast, by Application 2020 & 2033
- Table 39: Global Bovine Collagen Graft Industry Revenue Million Forecast, by End-use 2020 & 2033
- Table 40: Global Bovine Collagen Graft Industry Volume K Unit Forecast, by End-use 2020 & 2033
- Table 41: Global Bovine Collagen Graft Industry Revenue Million Forecast, by Country 2020 & 2033
- Table 42: Global Bovine Collagen Graft Industry Volume K Unit Forecast, by Country 2020 & 2033
- Table 43: China Bovine Collagen Graft Industry Revenue (Million) Forecast, by Application 2020 & 2033
- Table 44: China Bovine Collagen Graft Industry Volume (K Unit) Forecast, by Application 2020 & 2033
- Table 45: Japan Bovine Collagen Graft Industry Revenue (Million) Forecast, by Application 2020 & 2033
- Table 46: Japan Bovine Collagen Graft Industry Volume (K Unit) Forecast, by Application 2020 & 2033
- Table 47: India Bovine Collagen Graft Industry Revenue (Million) Forecast, by Application 2020 & 2033
- Table 48: India Bovine Collagen Graft Industry Volume (K Unit) Forecast, by Application 2020 & 2033
- Table 49: Australia Bovine Collagen Graft Industry Revenue (Million) Forecast, by Application 2020 & 2033
- Table 50: Australia Bovine Collagen Graft Industry Volume (K Unit) Forecast, by Application 2020 & 2033
- Table 51: South Korea Bovine Collagen Graft Industry Revenue (Million) Forecast, by Application 2020 & 2033
- Table 52: South Korea Bovine Collagen Graft Industry Volume (K Unit) Forecast, by Application 2020 & 2033
- Table 53: Rest of Asia Pacific Bovine Collagen Graft Industry Revenue (Million) Forecast, by Application 2020 & 2033
- Table 54: Rest of Asia Pacific Bovine Collagen Graft Industry Volume (K Unit) Forecast, by Application 2020 & 2033
- Table 55: Global Bovine Collagen Graft Industry Revenue Million Forecast, by Application 2020 & 2033
- Table 56: Global Bovine Collagen Graft Industry Volume K Unit Forecast, by Application 2020 & 2033
- Table 57: Global Bovine Collagen Graft Industry Revenue Million Forecast, by End-use 2020 & 2033
- Table 58: Global Bovine Collagen Graft Industry Volume K Unit Forecast, by End-use 2020 & 2033
- Table 59: Global Bovine Collagen Graft Industry Revenue Million Forecast, by Country 2020 & 2033
- Table 60: Global Bovine Collagen Graft Industry Volume K Unit Forecast, by Country 2020 & 2033
Frequently Asked Questions
1. What is the projected Compound Annual Growth Rate (CAGR) of the Bovine Collagen Graft Industry?
The projected CAGR is approximately 10.16%.
2. Which companies are prominent players in the Bovine Collagen Graft Industry?
Key companies in the market include LAPI GELATINE S p a, Symatese, Collagen Matrix Inc, BBI Solution, Botiss Biomaterials GmbH, Titan Biotech, Medtronic PLC, Foodmate Co Ltd, DCP Ingredients (DCP B V ), Kyeron, Rousselot, Collagen Solutions PLC.
3. What are the main segments of the Bovine Collagen Graft Industry?
The market segments include Application, End-use.
4. Can you provide details about the market size?
The market size is estimated to be USD 1.17 Million as of 2022.
5. What are some drivers contributing to market growth?
Growing Demand for Bovine-Based Collagen to Treat Various Disease; Increasing demand for Dental. and Orthopedic Surgeries; Ongoing R&D for the Development of Wound Healing & Regenerative Medicines.
6. What are the notable trends driving market growth?
Bone-graft Substitute Segment is Expected To Hold a Significant Market Share Over The Forecast Period.
7. Are there any restraints impacting market growth?
High Risk of Disease Transmission.
8. Can you provide examples of recent developments in the market?
August 2022: Roots Brands launched a blend of hydrolyzed bovine collagen and whole colostrum powder available as a youth-enhancing supplement. Utilizing bovine collagen's capacity to encourage the production of types I and III collagen in people, GMBMY asserts to aid in increasing skin moisture, improving suppleness, and reducing wrinkles.
9. What pricing options are available for accessing the report?
Pricing options include single-user, multi-user, and enterprise licenses priced at USD 4750, USD 5250, and USD 8750 respectively.
10. Is the market size provided in terms of value or volume?
The market size is provided in terms of value, measured in Million and volume, measured in K Unit.
11. Are there any specific market keywords associated with the report?
Yes, the market keyword associated with the report is "Bovine Collagen Graft Industry," which aids in identifying and referencing the specific market segment covered.
12. How do I determine which pricing option suits my needs best?
The pricing options vary based on user requirements and access needs. Individual users may opt for single-user licenses, while businesses requiring broader access may choose multi-user or enterprise licenses for cost-effective access to the report.
13. Are there any additional resources or data provided in the Bovine Collagen Graft Industry report?
While the report offers comprehensive insights, it's advisable to review the specific contents or supplementary materials provided to ascertain if additional resources or data are available.
14. How can I stay updated on further developments or reports in the Bovine Collagen Graft Industry?
To stay informed about further developments, trends, and reports in the Bovine Collagen Graft Industry, consider subscribing to industry newsletters, following relevant companies and organizations, or regularly checking reputable industry news sources and publications.
Methodology
Step 1 - Identification of Relevant Samples Size from Population Database


Step 2 - Approaches for Defining Global Market Size (Value, Volume* & Price*)

Note*: In applicable scenarios
Step 3 - Data Sources
Primary Research
- Web Analytics
- Survey Reports
- Research Institute
- Latest Research Reports
- Opinion Leaders
Secondary Research
- Annual Reports
- White Paper
- Latest Press Release
- Industry Association
- Paid Database
- Investor Presentations

Step 4 - Data Triangulation
Involves using different sources of information in order to increase the validity of a study
These sources are likely to be stakeholders in a program - participants, other researchers, program staff, other community members, and so on.
Then we put all data in single framework & apply various statistical tools to find out the dynamic on the market.
During the analysis stage, feedback from the stakeholder groups would be compared to determine areas of agreement as well as areas of divergence