

Key Insights
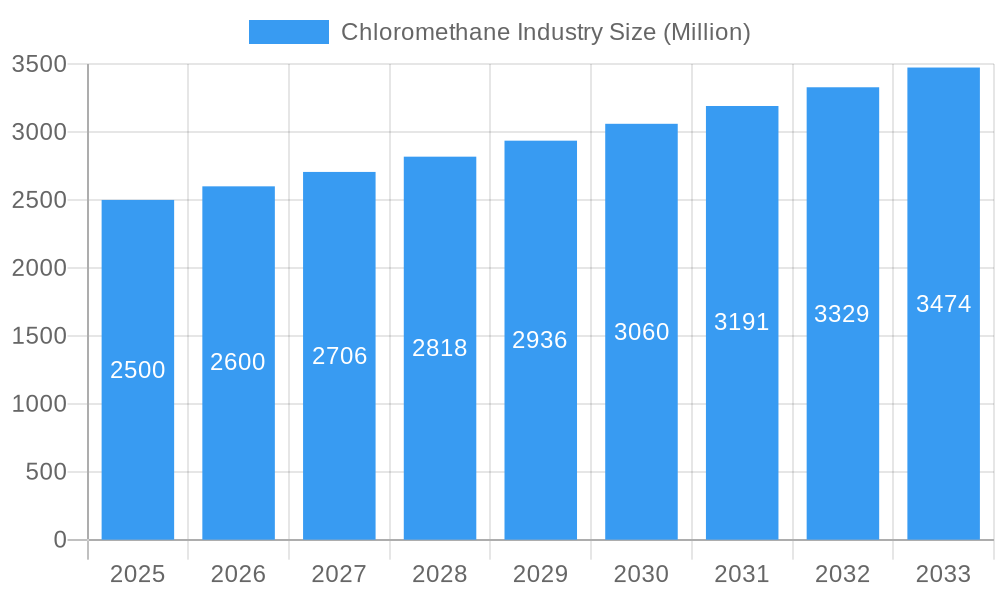
The chloromethane market is poised for significant expansion, with a projected Compound Annual Growth Rate (CAGR) of 5.2%. This robust growth is driven by increasing demand from key applications, including silicone production, agricultural chemical synthesis, and pharmaceutical manufacturing. Factors such as a growing global population and the rapid industrialization of emerging economies, particularly in China and India, are primary market accelerators. Innovations in production technologies are enhancing efficiency and sustainability, further supporting market trajectory. Despite these positive indicators, the market faces challenges from stringent environmental regulations and the availability of substitute chemicals. The market is segmented by product type, with methylene chloride and methyl chloride holding the largest shares, and by application, where silicones and agricultural chemicals are the leading segments. Key industry players, including Occidental Petroleum Corporation, Tokyo Chemical Industry Co. Ltd., and AGC Chemicals, are focusing on innovation, global expansion, and strategic collaborations to secure market leadership. The market size was valued at approximately $6.1 billion in the base year of 2025.
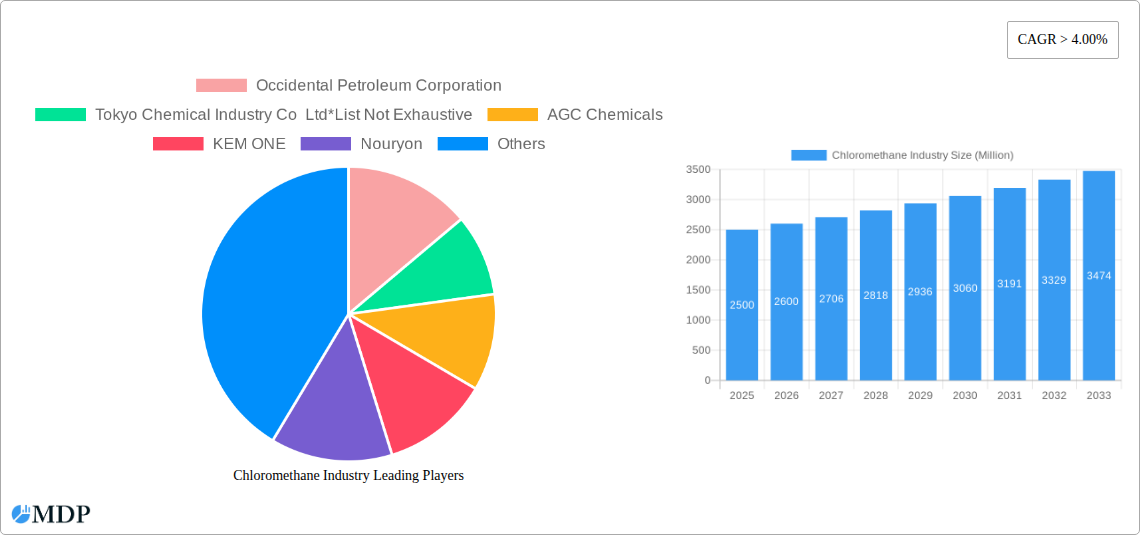
Chloromethane Industry Market Size (In Billion)
The Asia Pacific region, led by China and India, represents a dominant market share, fueled by its extensive chemical industry and burgeoning manufacturing capabilities. North America and Europe also contribute substantially, supported by mature chemical sectors and strong end-user demand. However, escalating environmental awareness in these developed regions is compelling market participants to adopt sustainable manufacturing processes. Future market performance will hinge on effectively addressing environmental concerns, navigating regulatory landscapes, and pursuing continuous innovation to meet evolving industry demands and consumer preferences. The market anticipates further consolidation, with larger enterprises potentially acquiring smaller firms to broaden their market presence and product offerings. To achieve sustained profitability and market share, companies must prioritize cost optimization, efficient supply chain management, and the implementation of sustainable practices.
Chloromethane Industry Company Market Share
Chloromethane Industry Market Report: 2019-2033
This comprehensive report provides an in-depth analysis of the Chloromethane industry, offering invaluable insights for stakeholders seeking to navigate this dynamic market. Covering the period 2019-2033, with a base year of 2025, this report delivers a detailed forecast (2025-2033) and insightful historical review (2019-2024). Maximize your understanding of market dynamics, competitive landscapes, and future growth potential with this essential resource. High-impact keywords include: Chloromethane, Methylene Chloride, Methyl Chloride, Carbon Tetrachloride, Chloroform, Silicones, Agriculture Chemicals, Pharmaceutical, Chemical Intermediate, Personal Care, Occidental Petroleum Corporation, Tokyo Chemical Industry Co Ltd, AGC Chemicals, KEM ONE, Nouryon, Merck KGaA, Tokuyama Corporation, The Sanmar Group, Gujarat Alkalies and Chemical Limited, Shin-Etsu Chemical Co Ltd, Gujarat Fluorochemicals Limited, Market Analysis, Industry Growth, Market Forecast.
Chloromethane Industry Market Dynamics & Concentration
The Chloromethane market exhibits a moderately concentrated structure, with several key players holding significant market share. The market share of the top five companies in 2024 is estimated at xx%. Innovation drivers include advancements in production technologies leading to increased efficiency and reduced costs. Stringent environmental regulations, particularly concerning emissions and waste disposal, significantly impact market dynamics. Substitute products like alternative solvents are gaining traction, placing pressure on Chloromethane's market share. End-user trends reflect increasing demand from the pharmaceutical and agricultural sectors. The period 2019-2024 witnessed xx M&A deals, indicating significant consolidation within the industry.
- Market Concentration: Top 5 companies hold xx% market share (2024).
- Innovation Drivers: Improved production technologies, reduced costs.
- Regulatory Framework: Stringent environmental regulations impacting operations.
- Product Substitutes: Growing adoption of alternative solvents.
- End-User Trends: Increasing demand from pharmaceuticals and agriculture.
- M&A Activity: xx deals between 2019-2024.
Chloromethane Industry Industry Trends & Analysis
The Chloromethane industry is projected to experience a CAGR of xx% during the forecast period (2025-2033), driven by expanding applications in diverse sectors, including silicones, agriculture chemicals, and pharmaceuticals. Technological disruptions are mainly focused on optimizing production processes to reduce environmental impact and enhance efficiency. Consumer preferences are shifting towards sustainable and eco-friendly alternatives, posing challenges to traditional Chloromethane production methods. Competitive dynamics are characterized by price competition and innovation in product offerings. Market penetration in developing economies is expected to significantly increase, fueled by growing industrialization.
Leading Markets & Segments in Chloromethane Industry
The Asian region dominates the Chloromethane market, primarily driven by strong demand from China and India. Within product types, Methyl Chloride commands the largest market share due to its wide application in various industries. The pharmaceutical segment stands out as the leading application area, reflecting the crucial role of Chloromethane in drug manufacturing.
- Key Drivers for Asian Dominance:
- Rapid industrialization
- Expanding manufacturing base
- Favorable government policies.
- Dominant Product Type: Methyl Chloride. Key Driver: Diverse applications across industries.
- Dominant Application Segment: Pharmaceuticals. Key Driver: Essential role in drug synthesis.
Chloromethane Industry Product Developments
Recent product developments focus on enhancing the purity and efficiency of Chloromethane, reducing its environmental footprint, and expanding its applications in niche markets. Companies are actively pursuing sustainable production methods and exploring new applications within the pharmaceutical and high-tech industries. This continuous improvement ensures the ongoing competitiveness of Chloromethane amidst evolving market demands.
Key Drivers of Chloromethane Industry Growth
Technological advancements in production processes, expanding application areas in emerging industries (e.g., advanced materials), and favorable economic conditions in key markets all contribute to the Chloromethane industry's growth. Supportive government policies regarding chemical manufacturing and infrastructure development further accelerate market expansion.
Challenges in the Chloromethane Industry Market
Stringent environmental regulations impose significant cost burdens and operational constraints. Supply chain disruptions and volatility in raw material prices pose considerable challenges. Intense competition from substitute products and price pressures from established players create a complex market environment. The total impact of these factors on industry profitability is estimated at xx Million USD annually.
Emerging Opportunities in Chloromethane Industry
Strategic partnerships for expanding into new markets, technological breakthroughs in sustainable production, and the development of specialized Chloromethane derivatives for niche applications hold immense potential for growth. Exploration of novel applications in emerging sectors, such as nanotechnology, is also creating new opportunities.
Leading Players in the Chloromethane Industry Sector
- Occidental Petroleum Corporation
- Tokyo Chemical Industry Co Ltd
- AGC Chemicals
- KEM ONE
- Nouryon
- Merck KGaA
- Tokuyama Corporation
- The Sanmar Group
- Gujarat Alkalies and Chemical Limited
- Shin-Etsu Chemical Co Ltd
- Gujarat Fluorochemicals Limited
Key Milestones in Chloromethane Industry Industry
- May 2022: AGC Inc. invested USD 0.76 Billion to increase chlor-alkali production capacity in Indochina, boosting PVC and vinyl chloride monomer output.
- January 2023: Nouryon acquired a Polish supplier of agricultural solutions, expanding its market reach in the agricultural chemicals segment.
Strategic Outlook for Chloromethane Industry Market
The Chloromethane market is poised for substantial growth, driven by expanding applications, technological advancements towards sustainable production, and strategic collaborations. Focusing on niche applications and sustainable manufacturing will be key for companies seeking to capitalize on future market potential. The market is expected to reach xx Million USD by 2033.
Chloromethane Industry Segmentation
-
1. Product Type
- 1.1. Methylene Chloride
- 1.2. Methyl Chloride
- 1.3. Carbon Tetrachloride
- 1.4. Chloroform
-
2. Application
- 2.1. Silicones
- 2.2. Agriculture Chemicals
- 2.3. Pharmaceutical
- 2.4. Chemical Intermediate
- 2.5. Personal Care
- 2.6. Other Applications
Chloromethane Industry Segmentation By Geography
-
1. Asia Pacific
- 1.1. China
- 1.2. India
- 1.3. Japan
- 1.4. South Korea
- 1.5. Rest of Asia Pacific
-
2. North America
- 2.1. United States
- 2.2. Canada
- 2.3. Mexico
-
3. Europe
- 3.1. Germany
- 3.2. United Kingdom
- 3.3. Italy
- 3.4. France
- 3.5. Rest of Europe
-
4. South America
- 4.1. Brazil
- 4.2. Argentina
- 4.3. Rest of South America
-
5. Middle East and Africa
- 5.1. Saudi Arabia
- 5.2. South Africa
- 5.3. Rest of Middle East and Africa
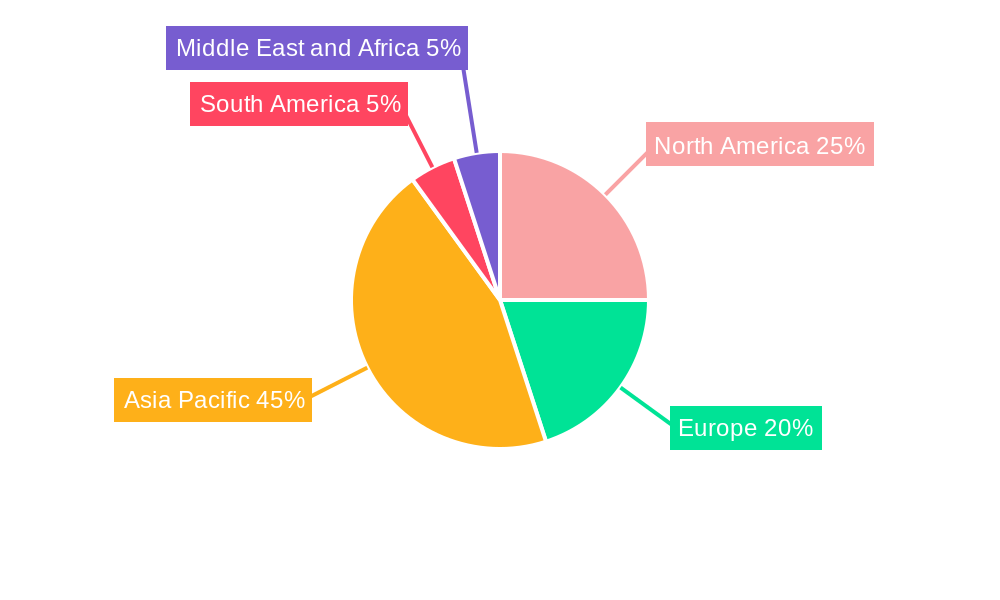
Chloromethane Industry Regional Market Share
Geographic Coverage of Chloromethane Industry
Chloromethane Industry REPORT HIGHLIGHTS
| Aspects | Details |
|---|---|
| Study Period | 2020-2034 |
| Base Year | 2025 |
| Estimated Year | 2026 |
| Forecast Period | 2026-2034 |
| Historical Period | 2020-2025 |
| Growth Rate | CAGR of 5.2% from 2020-2034 |
| Segmentation |
|
Table of Contents
- 1. Introduction
- 1.1. Research Scope
- 1.2. Market Segmentation
- 1.3. Research Objective
- 1.4. Definitions and Assumptions
- 2. Executive Summary
- 2.1. Market Snapshot
- 3. Market Dynamics
- 3.1. Market Drivers
- 3.2. Market Restrains
- 3.3. Market Trends
- 3.4. Market Opportunities
- 4. Market Factor Analysis
- 4.1. Porters Five Forces
- 4.1.1. Bargaining Power of Suppliers
- 4.1.2. Bargaining Power of Buyers
- 4.1.3. Threat of New Entrants
- 4.1.4. Threat of Substitutes
- 4.1.5. Competitive Rivalry
- 4.2. PESTEL analysis
- 4.3. BCG Analysis
- 4.3.1. Stars (High Growth, High Market Share)
- 4.3.2. Cash Cows (Low Growth, High Market Share)
- 4.3.3. Question Mark (High Growth, Low Market Share)
- 4.3.4. Dogs (Low Growth, Low Market Share)
- 4.4. Ansoff Matrix Analysis
- 4.5. Supply Chain Analysis
- 4.6. Regulatory Landscape
- 4.7. Current Market Potential and Opportunity Assessment (TAM–SAM–SOM Framework)
- 4.8. MDP Analyst Note
- 4.1. Porters Five Forces
- 5. Market Analysis, Insights and Forecast 2021-2033
- 5.1. Market Analysis, Insights and Forecast - by Product Type
- 5.1.1. Methylene Chloride
- 5.1.2. Methyl Chloride
- 5.1.3. Carbon Tetrachloride
- 5.1.4. Chloroform
- 5.2. Market Analysis, Insights and Forecast - by Application
- 5.2.1. Silicones
- 5.2.2. Agriculture Chemicals
- 5.2.3. Pharmaceutical
- 5.2.4. Chemical Intermediate
- 5.2.5. Personal Care
- 5.2.6. Other Applications
- 5.3. Market Analysis, Insights and Forecast - by Region
- 5.3.1. Asia Pacific
- 5.3.2. North America
- 5.3.3. Europe
- 5.3.4. South America
- 5.3.5. Middle East and Africa
- 5.1. Market Analysis, Insights and Forecast - by Product Type
- 6. Global Chloromethane Industry Analysis, Insights and Forecast, 2021-2033
- 6.1. Market Analysis, Insights and Forecast - by Product Type
- 6.1.1. Methylene Chloride
- 6.1.2. Methyl Chloride
- 6.1.3. Carbon Tetrachloride
- 6.1.4. Chloroform
- 6.2. Market Analysis, Insights and Forecast - by Application
- 6.2.1. Silicones
- 6.2.2. Agriculture Chemicals
- 6.2.3. Pharmaceutical
- 6.2.4. Chemical Intermediate
- 6.2.5. Personal Care
- 6.2.6. Other Applications
- 6.1. Market Analysis, Insights and Forecast - by Product Type
- 7. Asia Pacific Chloromethane Industry Analysis, Insights and Forecast, 2020-2032
- 7.1. Market Analysis, Insights and Forecast - by Product Type
- 7.1.1. Methylene Chloride
- 7.1.2. Methyl Chloride
- 7.1.3. Carbon Tetrachloride
- 7.1.4. Chloroform
- 7.2. Market Analysis, Insights and Forecast - by Application
- 7.2.1. Silicones
- 7.2.2. Agriculture Chemicals
- 7.2.3. Pharmaceutical
- 7.2.4. Chemical Intermediate
- 7.2.5. Personal Care
- 7.2.6. Other Applications
- 7.1. Market Analysis, Insights and Forecast - by Product Type
- 8. North America Chloromethane Industry Analysis, Insights and Forecast, 2020-2032
- 8.1. Market Analysis, Insights and Forecast - by Product Type
- 8.1.1. Methylene Chloride
- 8.1.2. Methyl Chloride
- 8.1.3. Carbon Tetrachloride
- 8.1.4. Chloroform
- 8.2. Market Analysis, Insights and Forecast - by Application
- 8.2.1. Silicones
- 8.2.2. Agriculture Chemicals
- 8.2.3. Pharmaceutical
- 8.2.4. Chemical Intermediate
- 8.2.5. Personal Care
- 8.2.6. Other Applications
- 8.1. Market Analysis, Insights and Forecast - by Product Type
- 9. Europe Chloromethane Industry Analysis, Insights and Forecast, 2020-2032
- 9.1. Market Analysis, Insights and Forecast - by Product Type
- 9.1.1. Methylene Chloride
- 9.1.2. Methyl Chloride
- 9.1.3. Carbon Tetrachloride
- 9.1.4. Chloroform
- 9.2. Market Analysis, Insights and Forecast - by Application
- 9.2.1. Silicones
- 9.2.2. Agriculture Chemicals
- 9.2.3. Pharmaceutical
- 9.2.4. Chemical Intermediate
- 9.2.5. Personal Care
- 9.2.6. Other Applications
- 9.1. Market Analysis, Insights and Forecast - by Product Type
- 10. South America Chloromethane Industry Analysis, Insights and Forecast, 2020-2032
- 10.1. Market Analysis, Insights and Forecast - by Product Type
- 10.1.1. Methylene Chloride
- 10.1.2. Methyl Chloride
- 10.1.3. Carbon Tetrachloride
- 10.1.4. Chloroform
- 10.2. Market Analysis, Insights and Forecast - by Application
- 10.2.1. Silicones
- 10.2.2. Agriculture Chemicals
- 10.2.3. Pharmaceutical
- 10.2.4. Chemical Intermediate
- 10.2.5. Personal Care
- 10.2.6. Other Applications
- 10.1. Market Analysis, Insights and Forecast - by Product Type
- 11. Middle East and Africa Chloromethane Industry Analysis, Insights and Forecast, 2020-2032
- 11.1. Market Analysis, Insights and Forecast - by Product Type
- 11.1.1. Methylene Chloride
- 11.1.2. Methyl Chloride
- 11.1.3. Carbon Tetrachloride
- 11.1.4. Chloroform
- 11.2. Market Analysis, Insights and Forecast - by Application
- 11.2.1. Silicones
- 11.2.2. Agriculture Chemicals
- 11.2.3. Pharmaceutical
- 11.2.4. Chemical Intermediate
- 11.2.5. Personal Care
- 11.2.6. Other Applications
- 11.1. Market Analysis, Insights and Forecast - by Product Type
- 12. Competitive Analysis
- 12.1. Company Profiles
- 12.1.1 Occidental Petroleum Corporation
- 12.1.1.1. Company Overview
- 12.1.1.2. Products
- 12.1.1.3. Company Financials
- 12.1.1.4. SWOT Analysis
- 12.1.2 Tokyo Chemical Industry Co Ltd*List Not Exhaustive
- 12.1.2.1. Company Overview
- 12.1.2.2. Products
- 12.1.2.3. Company Financials
- 12.1.2.4. SWOT Analysis
- 12.1.3 AGC Chemicals
- 12.1.3.1. Company Overview
- 12.1.3.2. Products
- 12.1.3.3. Company Financials
- 12.1.3.4. SWOT Analysis
- 12.1.4 KEM ONE
- 12.1.4.1. Company Overview
- 12.1.4.2. Products
- 12.1.4.3. Company Financials
- 12.1.4.4. SWOT Analysis
- 12.1.5 Nouryon
- 12.1.5.1. Company Overview
- 12.1.5.2. Products
- 12.1.5.3. Company Financials
- 12.1.5.4. SWOT Analysis
- 12.1.6 Merck KGaA
- 12.1.6.1. Company Overview
- 12.1.6.2. Products
- 12.1.6.3. Company Financials
- 12.1.6.4. SWOT Analysis
- 12.1.7 Tokuyama Corporation
- 12.1.7.1. Company Overview
- 12.1.7.2. Products
- 12.1.7.3. Company Financials
- 12.1.7.4. SWOT Analysis
- 12.1.8 The Sanmar Group
- 12.1.8.1. Company Overview
- 12.1.8.2. Products
- 12.1.8.3. Company Financials
- 12.1.8.4. SWOT Analysis
- 12.1.9 Gujarat Alkalies and Chemical Limited
- 12.1.9.1. Company Overview
- 12.1.9.2. Products
- 12.1.9.3. Company Financials
- 12.1.9.4. SWOT Analysis
- 12.1.10 Shin-Etsu Chemical Co Ltd
- 12.1.10.1. Company Overview
- 12.1.10.2. Products
- 12.1.10.3. Company Financials
- 12.1.10.4. SWOT Analysis
- 12.1.11 Gujarat Fluorochemicals Limited
- 12.1.11.1. Company Overview
- 12.1.11.2. Products
- 12.1.11.3. Company Financials
- 12.1.11.4. SWOT Analysis
- 12.1.1 Occidental Petroleum Corporation
- 12.2. Market Entropy
- 12.2.1 Company's Key Areas Served
- 12.2.2 Recent Developments
- 12.3. Company Market Share Analysis 2025
- 12.3.1 Top 5 Companies Market Share Analysis
- 12.3.2 Top 3 Companies Market Share Analysis
- 12.4. List of Potential Customers
- 13. Research Methodology
List of Figures
- Figure 1: Global Chloromethane Industry Revenue Breakdown (billion, %) by Region 2025 & 2033
- Figure 2: Asia Pacific Chloromethane Industry Revenue (billion), by Product Type 2025 & 2033
- Figure 3: Asia Pacific Chloromethane Industry Revenue Share (%), by Product Type 2025 & 2033
- Figure 4: Asia Pacific Chloromethane Industry Revenue (billion), by Application 2025 & 2033
- Figure 5: Asia Pacific Chloromethane Industry Revenue Share (%), by Application 2025 & 2033
- Figure 6: Asia Pacific Chloromethane Industry Revenue (billion), by Country 2025 & 2033
- Figure 7: Asia Pacific Chloromethane Industry Revenue Share (%), by Country 2025 & 2033
- Figure 8: North America Chloromethane Industry Revenue (billion), by Product Type 2025 & 2033
- Figure 9: North America Chloromethane Industry Revenue Share (%), by Product Type 2025 & 2033
- Figure 10: North America Chloromethane Industry Revenue (billion), by Application 2025 & 2033
- Figure 11: North America Chloromethane Industry Revenue Share (%), by Application 2025 & 2033
- Figure 12: North America Chloromethane Industry Revenue (billion), by Country 2025 & 2033
- Figure 13: North America Chloromethane Industry Revenue Share (%), by Country 2025 & 2033
- Figure 14: Europe Chloromethane Industry Revenue (billion), by Product Type 2025 & 2033
- Figure 15: Europe Chloromethane Industry Revenue Share (%), by Product Type 2025 & 2033
- Figure 16: Europe Chloromethane Industry Revenue (billion), by Application 2025 & 2033
- Figure 17: Europe Chloromethane Industry Revenue Share (%), by Application 2025 & 2033
- Figure 18: Europe Chloromethane Industry Revenue (billion), by Country 2025 & 2033
- Figure 19: Europe Chloromethane Industry Revenue Share (%), by Country 2025 & 2033
- Figure 20: South America Chloromethane Industry Revenue (billion), by Product Type 2025 & 2033
- Figure 21: South America Chloromethane Industry Revenue Share (%), by Product Type 2025 & 2033
- Figure 22: South America Chloromethane Industry Revenue (billion), by Application 2025 & 2033
- Figure 23: South America Chloromethane Industry Revenue Share (%), by Application 2025 & 2033
- Figure 24: South America Chloromethane Industry Revenue (billion), by Country 2025 & 2033
- Figure 25: South America Chloromethane Industry Revenue Share (%), by Country 2025 & 2033
- Figure 26: Middle East and Africa Chloromethane Industry Revenue (billion), by Product Type 2025 & 2033
- Figure 27: Middle East and Africa Chloromethane Industry Revenue Share (%), by Product Type 2025 & 2033
- Figure 28: Middle East and Africa Chloromethane Industry Revenue (billion), by Application 2025 & 2033
- Figure 29: Middle East and Africa Chloromethane Industry Revenue Share (%), by Application 2025 & 2033
- Figure 30: Middle East and Africa Chloromethane Industry Revenue (billion), by Country 2025 & 2033
- Figure 31: Middle East and Africa Chloromethane Industry Revenue Share (%), by Country 2025 & 2033
List of Tables
- Table 1: Global Chloromethane Industry Revenue billion Forecast, by Product Type 2020 & 2033
- Table 2: Global Chloromethane Industry Revenue billion Forecast, by Application 2020 & 2033
- Table 3: Global Chloromethane Industry Revenue billion Forecast, by Region 2020 & 2033
- Table 4: Global Chloromethane Industry Revenue billion Forecast, by Product Type 2020 & 2033
- Table 5: Global Chloromethane Industry Revenue billion Forecast, by Application 2020 & 2033
- Table 6: Global Chloromethane Industry Revenue billion Forecast, by Country 2020 & 2033
- Table 7: China Chloromethane Industry Revenue (billion) Forecast, by Application 2020 & 2033
- Table 8: India Chloromethane Industry Revenue (billion) Forecast, by Application 2020 & 2033
- Table 9: Japan Chloromethane Industry Revenue (billion) Forecast, by Application 2020 & 2033
- Table 10: South Korea Chloromethane Industry Revenue (billion) Forecast, by Application 2020 & 2033
- Table 11: Rest of Asia Pacific Chloromethane Industry Revenue (billion) Forecast, by Application 2020 & 2033
- Table 12: Global Chloromethane Industry Revenue billion Forecast, by Product Type 2020 & 2033
- Table 13: Global Chloromethane Industry Revenue billion Forecast, by Application 2020 & 2033
- Table 14: Global Chloromethane Industry Revenue billion Forecast, by Country 2020 & 2033
- Table 15: United States Chloromethane Industry Revenue (billion) Forecast, by Application 2020 & 2033
- Table 16: Canada Chloromethane Industry Revenue (billion) Forecast, by Application 2020 & 2033
- Table 17: Mexico Chloromethane Industry Revenue (billion) Forecast, by Application 2020 & 2033
- Table 18: Global Chloromethane Industry Revenue billion Forecast, by Product Type 2020 & 2033
- Table 19: Global Chloromethane Industry Revenue billion Forecast, by Application 2020 & 2033
- Table 20: Global Chloromethane Industry Revenue billion Forecast, by Country 2020 & 2033
- Table 21: Germany Chloromethane Industry Revenue (billion) Forecast, by Application 2020 & 2033
- Table 22: United Kingdom Chloromethane Industry Revenue (billion) Forecast, by Application 2020 & 2033
- Table 23: Italy Chloromethane Industry Revenue (billion) Forecast, by Application 2020 & 2033
- Table 24: France Chloromethane Industry Revenue (billion) Forecast, by Application 2020 & 2033
- Table 25: Rest of Europe Chloromethane Industry Revenue (billion) Forecast, by Application 2020 & 2033
- Table 26: Global Chloromethane Industry Revenue billion Forecast, by Product Type 2020 & 2033
- Table 27: Global Chloromethane Industry Revenue billion Forecast, by Application 2020 & 2033
- Table 28: Global Chloromethane Industry Revenue billion Forecast, by Country 2020 & 2033
- Table 29: Brazil Chloromethane Industry Revenue (billion) Forecast, by Application 2020 & 2033
- Table 30: Argentina Chloromethane Industry Revenue (billion) Forecast, by Application 2020 & 2033
- Table 31: Rest of South America Chloromethane Industry Revenue (billion) Forecast, by Application 2020 & 2033
- Table 32: Global Chloromethane Industry Revenue billion Forecast, by Product Type 2020 & 2033
- Table 33: Global Chloromethane Industry Revenue billion Forecast, by Application 2020 & 2033
- Table 34: Global Chloromethane Industry Revenue billion Forecast, by Country 2020 & 2033
- Table 35: Saudi Arabia Chloromethane Industry Revenue (billion) Forecast, by Application 2020 & 2033
- Table 36: South Africa Chloromethane Industry Revenue (billion) Forecast, by Application 2020 & 2033
- Table 37: Rest of Middle East and Africa Chloromethane Industry Revenue (billion) Forecast, by Application 2020 & 2033
Frequently Asked Questions
1. What is the projected Compound Annual Growth Rate (CAGR) of the Chloromethane Industry?
The projected CAGR is approximately 5.2%.
2. Which companies are prominent players in the Chloromethane Industry?
Key companies in the market include Occidental Petroleum Corporation, Tokyo Chemical Industry Co Ltd*List Not Exhaustive, AGC Chemicals, KEM ONE, Nouryon, Merck KGaA, Tokuyama Corporation, The Sanmar Group, Gujarat Alkalies and Chemical Limited, Shin-Etsu Chemical Co Ltd, Gujarat Fluorochemicals Limited.
3. What are the main segments of the Chloromethane Industry?
The market segments include Product Type, Application.
4. Can you provide details about the market size?
The market size is estimated to be USD 6.1 billion as of 2022.
5. What are some drivers contributing to market growth?
Increasing Usage of Silicone in Various End-user Industries; Growing Demand from the Pharmaceutical and Personal Care Industries.
6. What are the notable trends driving market growth?
Increasing Usage of Silicone in Various End-user Industries.
7. Are there any restraints impacting market growth?
Stringent Regulations on Chloromethane; Negative Impact of the COVID-19 Pandemic.
8. Can you provide examples of recent developments in the market?
January 2023: Nouryon, a global leader in specialty chemicals, announced the acquisition of a Poland-based supplier of chelated micronutrients, foliar, and other specialty agricultural solutions. With this acquisition, the company would be able to expand its services and product offerings for customers in the industry,
9. What pricing options are available for accessing the report?
Pricing options include single-user, multi-user, and enterprise licenses priced at USD 4750, USD 5250, and USD 8750 respectively.
10. Is the market size provided in terms of value or volume?
The market size is provided in terms of value, measured in billion.
11. Are there any specific market keywords associated with the report?
Yes, the market keyword associated with the report is "Chloromethane Industry," which aids in identifying and referencing the specific market segment covered.
12. How do I determine which pricing option suits my needs best?
The pricing options vary based on user requirements and access needs. Individual users may opt for single-user licenses, while businesses requiring broader access may choose multi-user or enterprise licenses for cost-effective access to the report.
13. Are there any additional resources or data provided in the Chloromethane Industry report?
While the report offers comprehensive insights, it's advisable to review the specific contents or supplementary materials provided to ascertain if additional resources or data are available.
14. How can I stay updated on further developments or reports in the Chloromethane Industry?
To stay informed about further developments, trends, and reports in the Chloromethane Industry, consider subscribing to industry newsletters, following relevant companies and organizations, or regularly checking reputable industry news sources and publications.
Methodology
Step 1 - Identification of Relevant Samples Size from Population Database


Step 2 - Approaches for Defining Global Market Size (Value, Volume* & Price*)

Note*: In applicable scenarios
Step 3 - Data Sources
Primary Research
- Web Analytics
- Survey Reports
- Research Institute
- Latest Research Reports
- Opinion Leaders
Secondary Research
- Annual Reports
- White Paper
- Latest Press Release
- Industry Association
- Paid Database
- Investor Presentations

Step 4 - Data Triangulation
Involves using different sources of information in order to increase the validity of a study
These sources are likely to be stakeholders in a program - participants, other researchers, program staff, other community members, and so on.
Then we put all data in single framework & apply various statistical tools to find out the dynamic on the market.
During the analysis stage, feedback from the stakeholder groups would be compared to determine areas of agreement as well as areas of divergence