

Key Insights
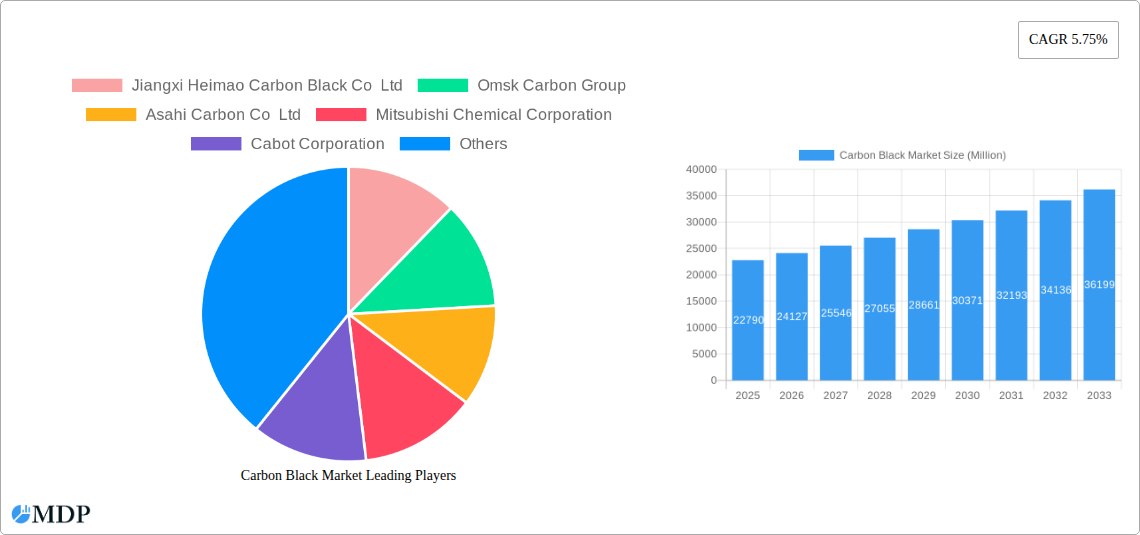
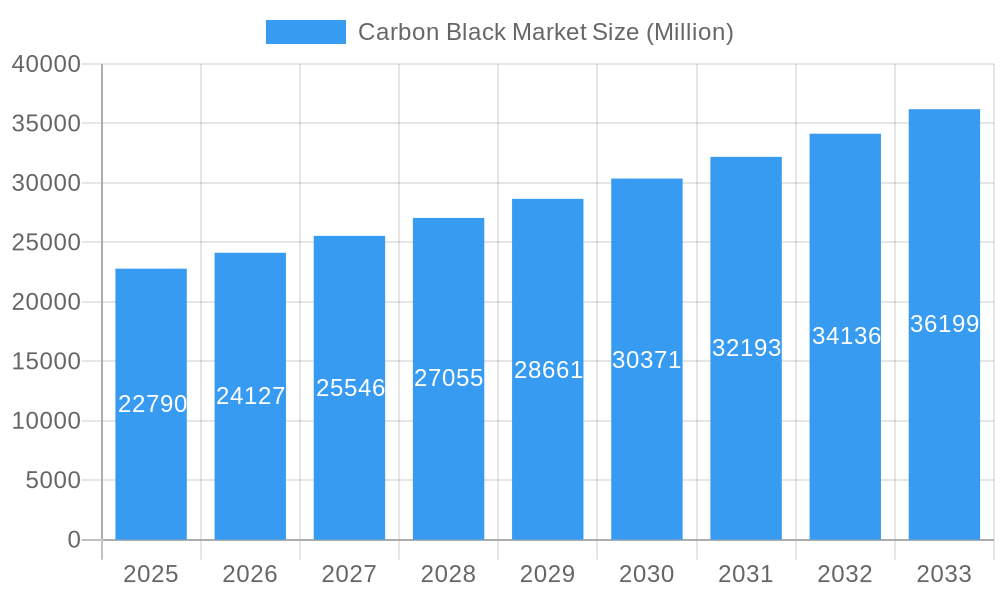
The global carbon black market, valued at $22.79 billion in 2025, is projected to experience robust growth, driven by a compound annual growth rate (CAGR) of 5.75% from 2025 to 2033. This expansion is fueled by several key factors. The burgeoning tire and industrial rubber products sector, a significant consumer of carbon black, is a major contributor. Increasing demand for high-performance tires, particularly in developing economies with expanding vehicle populations, significantly boosts consumption. Furthermore, the growth of the plastics industry, particularly in packaging and construction applications, fuels demand for carbon black as a pigment and reinforcing agent. The expanding printing and inks market, along with the growing use of carbon black in coatings for improved durability and UV protection, further contribute to market growth. Technological advancements leading to the development of more sustainable and efficient carbon black production processes are also expected to influence the market positively. While potential regulatory changes concerning environmental impact could pose some restraints, the overall market outlook remains optimistic due to the diverse applications and strong demand across various industries.
Carbon Black Market Market Size (In Billion)
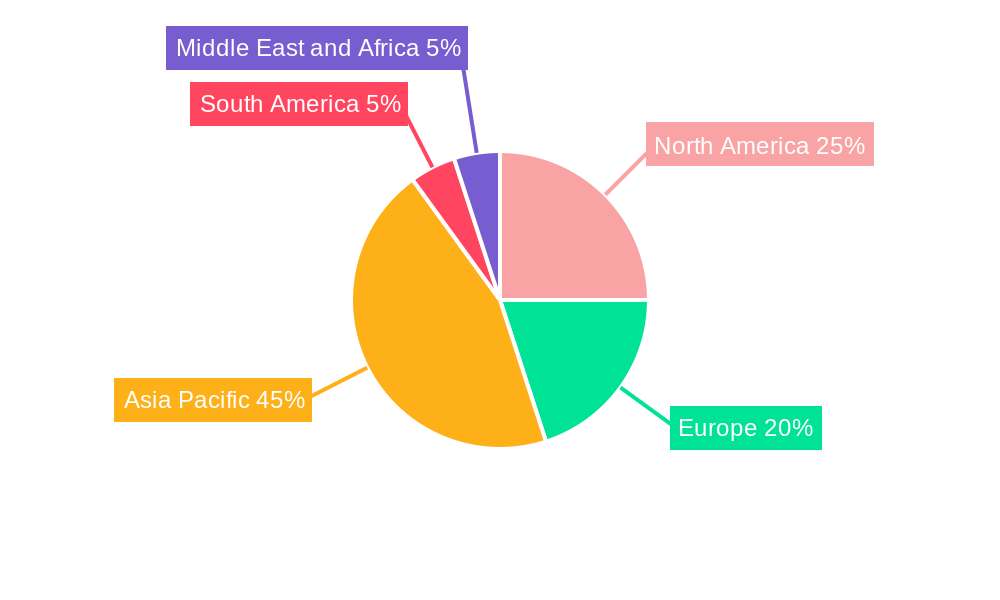
Geographical distribution of the market reveals significant regional variations. Asia-Pacific, particularly China and India, dominates the market due to rapid industrialization and substantial automotive production. North America and Europe also represent substantial markets, albeit with potentially slower growth rates compared to Asia-Pacific. The Middle East and Africa are expected to witness moderate growth, driven by infrastructure development and increased industrial activity. Market segmentation by process type (furnace black, gas black, lamp black, thermal black) reveals variations in production techniques and application suitability. Furnace black, due to its superior properties, holds a significant market share, though the other types serve niche applications. Competition in this market is intense, with both established multinational corporations and regional players vying for market share. The market landscape is characterized by strategic alliances, mergers and acquisitions, and continuous innovation in production technology and product development to gain a competitive edge.
Carbon Black Market Company Market Share
Carbon Black Market: A Comprehensive Report (2019-2033)
This in-depth report provides a comprehensive analysis of the global Carbon Black market, covering market dynamics, industry trends, leading players, and future growth opportunities. With a study period spanning 2019-2033, a base year of 2025, and a forecast period of 2025-2033, this report offers invaluable insights for industry stakeholders, investors, and strategic decision-makers. The report analyzes a market valued at xx Million in 2025, projected to reach xx Million by 2033, exhibiting a CAGR of xx%.
Carbon Black Market Market Dynamics & Concentration
The global carbon black market is characterized by a moderately concentrated landscape, with a few major players holding significant market share. However, the presence of numerous regional and smaller players fosters competitive intensity. Market concentration is influenced by factors including economies of scale in production, technological advancements, and strategic mergers and acquisitions (M&A). In recent years, the number of M&A deals within the sector has been approximately xx, indicating consolidation and strategic expansion strategies.
Key Market Dynamics:
- Innovation Drivers: Ongoing research and development efforts focus on enhancing carbon black properties such as conductivity, dispersibility, and reinforcement capabilities to meet evolving application needs. This drives innovation in production processes and material formulations.
- Regulatory Frameworks: Stringent environmental regulations concerning emissions and waste management are influencing production processes and sustainability initiatives within the carbon black industry.
- Product Substitutes: While carbon black possesses unique properties, certain applications see competition from alternative materials, such as silica and other reinforcing agents. The market share of substitutes is estimated at xx%.
- End-User Trends: The burgeoning automotive and tire industries are primary drivers of carbon black demand. Growth in construction, plastics, and printing industries also contribute to market expansion. The market share of tire applications is approximately xx%.
- M&A Activities: Consolidation through M&A activities is prevalent, driving increased market concentration and potentially shaping future competitive dynamics. The xx M&A deals in the past 5 years have significantly impacted the market landscape.
Carbon Black Market Industry Trends & Analysis
The global carbon black market is demonstrating consistent and robust expansion, primarily driven by the escalating demand from critical end-use industries, with the automotive and tire sectors leading the charge. The continuous growth in global vehicle production, coupled with the resultant need for high-performance tires engineered for durability and enhanced fuel efficiency, serves as a principal catalyst for market development. Concurrently, ongoing technological innovations in carbon black manufacturing processes are focused on not only refining product properties but also on minimizing environmental footprints, further stimulating market growth. A significant contributing factor to the market's upward trajectory is the increasing consumer preference for durable, high-quality products across a diverse range of applications, from industrial rubber goods to advanced plastics and sophisticated coatings. The competitive landscape is intensifying, prompting leading players to implement strategic pricing mechanisms and innovative product differentiation strategies. These combined forces are projected to propel the market to a substantial value of **[Insert Projected Market Value] Million by 2033**. The market is intricately segmented by process type, including furnace black, gas black, lamp black, and thermal black, and further categorized by application, encompassing tires and industrial rubber products, plastics, toners and printing inks, coatings, textile fibers, and a variety of other specialized applications.
Leading Markets & Segments in Carbon Black Market
The Asia-Pacific region dominates the global carbon black market, driven by robust economic growth, expanding industrialization, and significant automotive production within countries like China and India. Within the process type segment, furnace black holds the largest market share due to its superior properties and wide applications. In terms of applications, the tires and industrial rubber products segment represents the dominant application, owing to the extensive use of carbon black as a reinforcing agent in tire manufacturing.
Key Drivers for Dominant Regions/Segments:
- Asia-Pacific: Rapid industrialization, burgeoning automotive sector, and supportive government policies.
- Furnace Black: Superior properties like high reinforcement and low cost compared to other processes.
- Tires & Industrial Rubber Products: High demand driven by increasing vehicle production and tire manufacturing.
The detailed dominance analysis highlights the significant contributions of these regions and segments to the overall market size and growth, with xx% and xx% of the market share, respectively.
Carbon Black Market Product Developments
Recent innovations in carbon black production focus on enhancing performance characteristics such as improved dispersion, higher conductivity, and reduced environmental footprint. Companies are actively developing specialized grades tailored to specific applications, delivering enhanced product performance and cost-effectiveness. These advancements provide competitive advantages and address growing industry demands for sustainability and high-performance materials. For instance, new grades are being developed to optimize the properties of tires for electric vehicles.
Key Drivers of Carbon Black Market Growth
The sustained expansion of the carbon black market is underpinned by a confluence of influential factors. The burgeoning automotive industry, especially within rapidly developing economies, represents a significant demand generator. Advancements in carbon black production technologies are continuously enhancing manufacturing efficiency, improving product quality, and optimizing cost-effectiveness, thereby amplifying the market's appeal. Furthermore, supportive government initiatives, including incentives for sustainable manufacturing and infrastructure development projects in key regions, are playing a crucial role in accelerating market growth and fostering innovation.
Challenges in the Carbon Black Market Market
The carbon black market faces challenges, including fluctuating raw material prices, which affect production costs. Stringent environmental regulations require manufacturers to invest in cleaner production technologies, adding to operational expenses. Intense competition from existing players and alternative materials also poses a significant challenge. These factors could collectively impact the market by approximately xx% if not addressed effectively.
Emerging Opportunities in Carbon Black Market
The carbon black market is rife with promising opportunities for growth and innovation. Breakthroughs in production processes that yield carbon black with enhanced performance characteristics, such as superior reinforcement, conductivity, and UV resistance, while simultaneously reducing environmental impact, are opening up new avenues for market penetration and product development. Strategic alliances, mergers, and acquisitions among key market participants are facilitating the exchange of cutting-edge technologies, expanding market reach, and fostering collaborative research and development. Moreover, the burgeoning industrial sectors in emerging economies present substantial untapped potential, offering significant opportunities for market expansion and the introduction of specialized carbon black grades tailored to regional needs.
Leading Players in the Carbon Black Market Sector
- Jiangxi Heimao Carbon Black Co Ltd
- Omsk Carbon Group
- Asahi Carbon Co Ltd
- Mitsubishi Chemical Corporation
- Cabot Corporation
- Epsilon Carbon Private Limited
- NNPC Limited
- Himadri Speciality Chemical Ltd
- ADNOC Group
- Longxing Chemical Stock Co Ltd
- PCBL Limited
- International CSRC Investment Holdings Co Ltd
- Imerys SA
- Tokai Carbon Co Ltd
- OCI Company Ltd
- BKT Carbon
- Orion Engineered Carbons SA
- Birla Carbon (Aditya Birla Group)
Key Milestones in Carbon Black Market Industry
- June 2023: PCBL Limited announced two significant growth initiatives, comprising the expansion of a new manufacturing facility in Chennai, Tamil Nadu, and an enhancement project at its existing plant in Mundra, Gujarat. These strategic expansions are set to increase their annual carbon black production capacity to 790,000 MTPA and will be complemented by the addition of 122 MW of renewable energy generation, underscoring a commitment to sustainable operations.
- February 2023: Balkrishna Industries Ltd (BKT) unveiled plans for a substantial 20% increase in its carbon black production capacity at its Bhuj plant in Gujarat. This expansion is expected to add 198 kilotons per year to its current capacity of 65 ktpa, significantly bolstering its manufacturing capabilities to meet growing market demand.
- June 2022: ADNOC Distribution entered into a new carbon black supply agreement with ADNOC, a pivotal move designed to facilitate comprehensive market testing and evaluation of carbon black products, paving the way for potential future product development and market strategies.
Strategic Outlook for Carbon Black Market Market
The future of the carbon black market appears promising, driven by continuous technological advancements, expanding application areas, and supportive government policies. Strategic investments in research and development, coupled with strategic partnerships and collaborations, will be key to capturing significant market share and driving sustainable growth. Focus on developing sustainable and high-performance carbon black products tailored to specific applications will be crucial for future success.
Carbon Black Market Segmentation
-
1. Process Type
- 1.1. Furnace Black
- 1.2. Gas Black
- 1.3. Lamp Black
- 1.4. Thermal Black
-
2. Application
- 2.1. Tires and Industrial Rubber Products
- 2.2. Plastic
- 2.3. Toners and Printing Inks
- 2.4. Coatings
- 2.5. Textile Fiber
- 2.6. Other Applications
Carbon Black Market Segmentation By Geography
-
1. Asia Pacific
- 1.1. China
- 1.2. India
- 1.3. Japan
- 1.4. South Korea
- 1.5. Rest of Asia Pacific
-
2. North America
- 2.1. United States
- 2.2. Canada
- 2.3. Mexico
-
3. Europe
- 3.1. Germany
- 3.2. United Kingdom
- 3.3. Italy
- 3.4. France
- 3.5. Rest of Europe
-
4. South America
- 4.1. Brazil
- 4.2. Argentina
- 4.3. Rest of South America
-
5. Middle East and Africa
- 5.1. Saudi Arabia
- 5.2. South Africa
- 5.3. United Arab Emirates
- 5.4. Rest of Middle East and Africa
Carbon Black Market Regional Market Share
Geographic Coverage of Carbon Black Market
Carbon Black Market REPORT HIGHLIGHTS
| Aspects | Details |
|---|---|
| Study Period | 2020-2034 |
| Base Year | 2025 |
| Estimated Year | 2026 |
| Forecast Period | 2026-2034 |
| Historical Period | 2020-2025 |
| Growth Rate | CAGR of 5.75% from 2020-2034 |
| Segmentation |
|
Table of Contents
- 1. Introduction
- 1.1. Research Scope
- 1.2. Market Segmentation
- 1.3. Research Objective
- 1.4. Definitions and Assumptions
- 2. Executive Summary
- 2.1. Market Snapshot
- 3. Market Dynamics
- 3.1. Market Drivers
- 3.2. Market Restrains
- 3.3. Market Trends
- 3.4. Market Opportunities
- 4. Market Factor Analysis
- 4.1. Porters Five Forces
- 4.1.1. Bargaining Power of Suppliers
- 4.1.2. Bargaining Power of Buyers
- 4.1.3. Threat of New Entrants
- 4.1.4. Threat of Substitutes
- 4.1.5. Competitive Rivalry
- 4.2. PESTEL analysis
- 4.3. BCG Analysis
- 4.3.1. Stars (High Growth, High Market Share)
- 4.3.2. Cash Cows (Low Growth, High Market Share)
- 4.3.3. Question Mark (High Growth, Low Market Share)
- 4.3.4. Dogs (Low Growth, Low Market Share)
- 4.4. Ansoff Matrix Analysis
- 4.5. Supply Chain Analysis
- 4.6. Regulatory Landscape
- 4.7. Current Market Potential and Opportunity Assessment (TAM–SAM–SOM Framework)
- 4.8. MDP Analyst Note
- 4.1. Porters Five Forces
- 5. Market Analysis, Insights and Forecast 2021-2033
- 5.1. Market Analysis, Insights and Forecast - by Process Type
- 5.1.1. Furnace Black
- 5.1.2. Gas Black
- 5.1.3. Lamp Black
- 5.1.4. Thermal Black
- 5.2. Market Analysis, Insights and Forecast - by Application
- 5.2.1. Tires and Industrial Rubber Products
- 5.2.2. Plastic
- 5.2.3. Toners and Printing Inks
- 5.2.4. Coatings
- 5.2.5. Textile Fiber
- 5.2.6. Other Applications
- 5.3. Market Analysis, Insights and Forecast - by Region
- 5.3.1. Asia Pacific
- 5.3.2. North America
- 5.3.3. Europe
- 5.3.4. South America
- 5.3.5. Middle East and Africa
- 5.1. Market Analysis, Insights and Forecast - by Process Type
- 6. Global Carbon Black Market Analysis, Insights and Forecast, 2021-2033
- 6.1. Market Analysis, Insights and Forecast - by Process Type
- 6.1.1. Furnace Black
- 6.1.2. Gas Black
- 6.1.3. Lamp Black
- 6.1.4. Thermal Black
- 6.2. Market Analysis, Insights and Forecast - by Application
- 6.2.1. Tires and Industrial Rubber Products
- 6.2.2. Plastic
- 6.2.3. Toners and Printing Inks
- 6.2.4. Coatings
- 6.2.5. Textile Fiber
- 6.2.6. Other Applications
- 6.1. Market Analysis, Insights and Forecast - by Process Type
- 7. Asia Pacific Carbon Black Market Analysis, Insights and Forecast, 2020-2032
- 7.1. Market Analysis, Insights and Forecast - by Process Type
- 7.1.1. Furnace Black
- 7.1.2. Gas Black
- 7.1.3. Lamp Black
- 7.1.4. Thermal Black
- 7.2. Market Analysis, Insights and Forecast - by Application
- 7.2.1. Tires and Industrial Rubber Products
- 7.2.2. Plastic
- 7.2.3. Toners and Printing Inks
- 7.2.4. Coatings
- 7.2.5. Textile Fiber
- 7.2.6. Other Applications
- 7.1. Market Analysis, Insights and Forecast - by Process Type
- 8. North America Carbon Black Market Analysis, Insights and Forecast, 2020-2032
- 8.1. Market Analysis, Insights and Forecast - by Process Type
- 8.1.1. Furnace Black
- 8.1.2. Gas Black
- 8.1.3. Lamp Black
- 8.1.4. Thermal Black
- 8.2. Market Analysis, Insights and Forecast - by Application
- 8.2.1. Tires and Industrial Rubber Products
- 8.2.2. Plastic
- 8.2.3. Toners and Printing Inks
- 8.2.4. Coatings
- 8.2.5. Textile Fiber
- 8.2.6. Other Applications
- 8.1. Market Analysis, Insights and Forecast - by Process Type
- 9. Europe Carbon Black Market Analysis, Insights and Forecast, 2020-2032
- 9.1. Market Analysis, Insights and Forecast - by Process Type
- 9.1.1. Furnace Black
- 9.1.2. Gas Black
- 9.1.3. Lamp Black
- 9.1.4. Thermal Black
- 9.2. Market Analysis, Insights and Forecast - by Application
- 9.2.1. Tires and Industrial Rubber Products
- 9.2.2. Plastic
- 9.2.3. Toners and Printing Inks
- 9.2.4. Coatings
- 9.2.5. Textile Fiber
- 9.2.6. Other Applications
- 9.1. Market Analysis, Insights and Forecast - by Process Type
- 10. South America Carbon Black Market Analysis, Insights and Forecast, 2020-2032
- 10.1. Market Analysis, Insights and Forecast - by Process Type
- 10.1.1. Furnace Black
- 10.1.2. Gas Black
- 10.1.3. Lamp Black
- 10.1.4. Thermal Black
- 10.2. Market Analysis, Insights and Forecast - by Application
- 10.2.1. Tires and Industrial Rubber Products
- 10.2.2. Plastic
- 10.2.3. Toners and Printing Inks
- 10.2.4. Coatings
- 10.2.5. Textile Fiber
- 10.2.6. Other Applications
- 10.1. Market Analysis, Insights and Forecast - by Process Type
- 11. Middle East and Africa Carbon Black Market Analysis, Insights and Forecast, 2020-2032
- 11.1. Market Analysis, Insights and Forecast - by Process Type
- 11.1.1. Furnace Black
- 11.1.2. Gas Black
- 11.1.3. Lamp Black
- 11.1.4. Thermal Black
- 11.2. Market Analysis, Insights and Forecast - by Application
- 11.2.1. Tires and Industrial Rubber Products
- 11.2.2. Plastic
- 11.2.3. Toners and Printing Inks
- 11.2.4. Coatings
- 11.2.5. Textile Fiber
- 11.2.6. Other Applications
- 11.1. Market Analysis, Insights and Forecast - by Process Type
- 12. Competitive Analysis
- 12.1. Company Profiles
- 12.1.1 Jiangxi Heimao Carbon Black Co Ltd
- 12.1.1.1. Company Overview
- 12.1.1.2. Products
- 12.1.1.3. Company Financials
- 12.1.1.4. SWOT Analysis
- 12.1.2 Omsk Carbon Group
- 12.1.2.1. Company Overview
- 12.1.2.2. Products
- 12.1.2.3. Company Financials
- 12.1.2.4. SWOT Analysis
- 12.1.3 Asahi Carbon Co Ltd
- 12.1.3.1. Company Overview
- 12.1.3.2. Products
- 12.1.3.3. Company Financials
- 12.1.3.4. SWOT Analysis
- 12.1.4 Mitsubishi Chemical Corporation
- 12.1.4.1. Company Overview
- 12.1.4.2. Products
- 12.1.4.3. Company Financials
- 12.1.4.4. SWOT Analysis
- 12.1.5 Cabot Corporation
- 12.1.5.1. Company Overview
- 12.1.5.2. Products
- 12.1.5.3. Company Financials
- 12.1.5.4. SWOT Analysis
- 12.1.6 Epsilon Carbon Private Limited
- 12.1.6.1. Company Overview
- 12.1.6.2. Products
- 12.1.6.3. Company Financials
- 12.1.6.4. SWOT Analysis
- 12.1.7 NNPC Limited
- 12.1.7.1. Company Overview
- 12.1.7.2. Products
- 12.1.7.3. Company Financials
- 12.1.7.4. SWOT Analysis
- 12.1.8 Himadri Speciality Chemical Ltd
- 12.1.8.1. Company Overview
- 12.1.8.2. Products
- 12.1.8.3. Company Financials
- 12.1.8.4. SWOT Analysis
- 12.1.9 ADNOC Group
- 12.1.9.1. Company Overview
- 12.1.9.2. Products
- 12.1.9.3. Company Financials
- 12.1.9.4. SWOT Analysis
- 12.1.10 Longxing Chemical Stock Co Ltd
- 12.1.10.1. Company Overview
- 12.1.10.2. Products
- 12.1.10.3. Company Financials
- 12.1.10.4. SWOT Analysis
- 12.1.11 PCBL Limited
- 12.1.11.1. Company Overview
- 12.1.11.2. Products
- 12.1.11.3. Company Financials
- 12.1.11.4. SWOT Analysis
- 12.1.12 International CSRC Investment Holdings Co Ltd
- 12.1.12.1. Company Overview
- 12.1.12.2. Products
- 12.1.12.3. Company Financials
- 12.1.12.4. SWOT Analysis
- 12.1.13 Imerys SA
- 12.1.13.1. Company Overview
- 12.1.13.2. Products
- 12.1.13.3. Company Financials
- 12.1.13.4. SWOT Analysis
- 12.1.14 Tokai Carbon Co Ltd*List Not Exhaustive
- 12.1.14.1. Company Overview
- 12.1.14.2. Products
- 12.1.14.3. Company Financials
- 12.1.14.4. SWOT Analysis
- 12.1.15 OCI Company Ltd
- 12.1.15.1. Company Overview
- 12.1.15.2. Products
- 12.1.15.3. Company Financials
- 12.1.15.4. SWOT Analysis
- 12.1.16 BKT Carbon
- 12.1.16.1. Company Overview
- 12.1.16.2. Products
- 12.1.16.3. Company Financials
- 12.1.16.4. SWOT Analysis
- 12.1.17 Orion Engineered Carbons SA
- 12.1.17.1. Company Overview
- 12.1.17.2. Products
- 12.1.17.3. Company Financials
- 12.1.17.4. SWOT Analysis
- 12.1.18 Birla Carbon (Aditya Birla Group)
- 12.1.18.1. Company Overview
- 12.1.18.2. Products
- 12.1.18.3. Company Financials
- 12.1.18.4. SWOT Analysis
- 12.1.1 Jiangxi Heimao Carbon Black Co Ltd
- 12.2. Market Entropy
- 12.2.1 Company's Key Areas Served
- 12.2.2 Recent Developments
- 12.3. Company Market Share Analysis 2025
- 12.3.1 Top 5 Companies Market Share Analysis
- 12.3.2 Top 3 Companies Market Share Analysis
- 12.4. List of Potential Customers
- 13. Research Methodology
List of Figures
- Figure 1: Global Carbon Black Market Revenue Breakdown (Million, %) by Region 2025 & 2033
- Figure 2: Asia Pacific Carbon Black Market Revenue (Million), by Process Type 2025 & 2033
- Figure 3: Asia Pacific Carbon Black Market Revenue Share (%), by Process Type 2025 & 2033
- Figure 4: Asia Pacific Carbon Black Market Revenue (Million), by Application 2025 & 2033
- Figure 5: Asia Pacific Carbon Black Market Revenue Share (%), by Application 2025 & 2033
- Figure 6: Asia Pacific Carbon Black Market Revenue (Million), by Country 2025 & 2033
- Figure 7: Asia Pacific Carbon Black Market Revenue Share (%), by Country 2025 & 2033
- Figure 8: North America Carbon Black Market Revenue (Million), by Process Type 2025 & 2033
- Figure 9: North America Carbon Black Market Revenue Share (%), by Process Type 2025 & 2033
- Figure 10: North America Carbon Black Market Revenue (Million), by Application 2025 & 2033
- Figure 11: North America Carbon Black Market Revenue Share (%), by Application 2025 & 2033
- Figure 12: North America Carbon Black Market Revenue (Million), by Country 2025 & 2033
- Figure 13: North America Carbon Black Market Revenue Share (%), by Country 2025 & 2033
- Figure 14: Europe Carbon Black Market Revenue (Million), by Process Type 2025 & 2033
- Figure 15: Europe Carbon Black Market Revenue Share (%), by Process Type 2025 & 2033
- Figure 16: Europe Carbon Black Market Revenue (Million), by Application 2025 & 2033
- Figure 17: Europe Carbon Black Market Revenue Share (%), by Application 2025 & 2033
- Figure 18: Europe Carbon Black Market Revenue (Million), by Country 2025 & 2033
- Figure 19: Europe Carbon Black Market Revenue Share (%), by Country 2025 & 2033
- Figure 20: South America Carbon Black Market Revenue (Million), by Process Type 2025 & 2033
- Figure 21: South America Carbon Black Market Revenue Share (%), by Process Type 2025 & 2033
- Figure 22: South America Carbon Black Market Revenue (Million), by Application 2025 & 2033
- Figure 23: South America Carbon Black Market Revenue Share (%), by Application 2025 & 2033
- Figure 24: South America Carbon Black Market Revenue (Million), by Country 2025 & 2033
- Figure 25: South America Carbon Black Market Revenue Share (%), by Country 2025 & 2033
- Figure 26: Middle East and Africa Carbon Black Market Revenue (Million), by Process Type 2025 & 2033
- Figure 27: Middle East and Africa Carbon Black Market Revenue Share (%), by Process Type 2025 & 2033
- Figure 28: Middle East and Africa Carbon Black Market Revenue (Million), by Application 2025 & 2033
- Figure 29: Middle East and Africa Carbon Black Market Revenue Share (%), by Application 2025 & 2033
- Figure 30: Middle East and Africa Carbon Black Market Revenue (Million), by Country 2025 & 2033
- Figure 31: Middle East and Africa Carbon Black Market Revenue Share (%), by Country 2025 & 2033
List of Tables
- Table 1: Global Carbon Black Market Revenue Million Forecast, by Process Type 2020 & 2033
- Table 2: Global Carbon Black Market Revenue Million Forecast, by Application 2020 & 2033
- Table 3: Global Carbon Black Market Revenue Million Forecast, by Region 2020 & 2033
- Table 4: Global Carbon Black Market Revenue Million Forecast, by Process Type 2020 & 2033
- Table 5: Global Carbon Black Market Revenue Million Forecast, by Application 2020 & 2033
- Table 6: Global Carbon Black Market Revenue Million Forecast, by Country 2020 & 2033
- Table 7: China Carbon Black Market Revenue (Million) Forecast, by Application 2020 & 2033
- Table 8: India Carbon Black Market Revenue (Million) Forecast, by Application 2020 & 2033
- Table 9: Japan Carbon Black Market Revenue (Million) Forecast, by Application 2020 & 2033
- Table 10: South Korea Carbon Black Market Revenue (Million) Forecast, by Application 2020 & 2033
- Table 11: Rest of Asia Pacific Carbon Black Market Revenue (Million) Forecast, by Application 2020 & 2033
- Table 12: Global Carbon Black Market Revenue Million Forecast, by Process Type 2020 & 2033
- Table 13: Global Carbon Black Market Revenue Million Forecast, by Application 2020 & 2033
- Table 14: Global Carbon Black Market Revenue Million Forecast, by Country 2020 & 2033
- Table 15: United States Carbon Black Market Revenue (Million) Forecast, by Application 2020 & 2033
- Table 16: Canada Carbon Black Market Revenue (Million) Forecast, by Application 2020 & 2033
- Table 17: Mexico Carbon Black Market Revenue (Million) Forecast, by Application 2020 & 2033
- Table 18: Global Carbon Black Market Revenue Million Forecast, by Process Type 2020 & 2033
- Table 19: Global Carbon Black Market Revenue Million Forecast, by Application 2020 & 2033
- Table 20: Global Carbon Black Market Revenue Million Forecast, by Country 2020 & 2033
- Table 21: Germany Carbon Black Market Revenue (Million) Forecast, by Application 2020 & 2033
- Table 22: United Kingdom Carbon Black Market Revenue (Million) Forecast, by Application 2020 & 2033
- Table 23: Italy Carbon Black Market Revenue (Million) Forecast, by Application 2020 & 2033
- Table 24: France Carbon Black Market Revenue (Million) Forecast, by Application 2020 & 2033
- Table 25: Rest of Europe Carbon Black Market Revenue (Million) Forecast, by Application 2020 & 2033
- Table 26: Global Carbon Black Market Revenue Million Forecast, by Process Type 2020 & 2033
- Table 27: Global Carbon Black Market Revenue Million Forecast, by Application 2020 & 2033
- Table 28: Global Carbon Black Market Revenue Million Forecast, by Country 2020 & 2033
- Table 29: Brazil Carbon Black Market Revenue (Million) Forecast, by Application 2020 & 2033
- Table 30: Argentina Carbon Black Market Revenue (Million) Forecast, by Application 2020 & 2033
- Table 31: Rest of South America Carbon Black Market Revenue (Million) Forecast, by Application 2020 & 2033
- Table 32: Global Carbon Black Market Revenue Million Forecast, by Process Type 2020 & 2033
- Table 33: Global Carbon Black Market Revenue Million Forecast, by Application 2020 & 2033
- Table 34: Global Carbon Black Market Revenue Million Forecast, by Country 2020 & 2033
- Table 35: Saudi Arabia Carbon Black Market Revenue (Million) Forecast, by Application 2020 & 2033
- Table 36: South Africa Carbon Black Market Revenue (Million) Forecast, by Application 2020 & 2033
- Table 37: United Arab Emirates Carbon Black Market Revenue (Million) Forecast, by Application 2020 & 2033
- Table 38: Rest of Middle East and Africa Carbon Black Market Revenue (Million) Forecast, by Application 2020 & 2033
Frequently Asked Questions
1. What is the projected Compound Annual Growth Rate (CAGR) of the Carbon Black Market?
The projected CAGR is approximately 5.75%.
2. Which companies are prominent players in the Carbon Black Market?
Key companies in the market include Jiangxi Heimao Carbon Black Co Ltd, Omsk Carbon Group, Asahi Carbon Co Ltd, Mitsubishi Chemical Corporation, Cabot Corporation, Epsilon Carbon Private Limited, NNPC Limited, Himadri Speciality Chemical Ltd, ADNOC Group, Longxing Chemical Stock Co Ltd, PCBL Limited, International CSRC Investment Holdings Co Ltd, Imerys SA, Tokai Carbon Co Ltd*List Not Exhaustive, OCI Company Ltd, BKT Carbon, Orion Engineered Carbons SA, Birla Carbon (Aditya Birla Group).
3. What are the main segments of the Carbon Black Market?
The market segments include Process Type, Application.
4. Can you provide details about the market size?
The market size is estimated to be USD 22.79 Million as of 2022.
5. What are some drivers contributing to market growth?
Increasing Market Penetration of Specialty Black; Growing Applications in the Batteries Segment.
6. What are the notable trends driving market growth?
Increasing Application of Tires and Industrial Rubber Products.
7. Are there any restraints impacting market growth?
Increasing Investments for Recovered Carbon Black; Volatility in Prices of Raw Materials.
8. Can you provide examples of recent developments in the market?
June 2023: PCBL Limited initiated two growth projects which incorporate the new plant expansion in Chennai, Tamil Nadu, and an existing plant project at Mundra, Gujarat. This expansion is divided into two stages, and the first stage of the specialty chemical line is expected to be put into operation by the first quarter of the fiscal year 2023-24. As a result, the overall manufacturing capacity of the company is estimated to reach 790,000 MTPA and 122 MW of renewable energy.
9. What pricing options are available for accessing the report?
Pricing options include single-user, multi-user, and enterprise licenses priced at USD 4750, USD 5250, and USD 8750 respectively.
10. Is the market size provided in terms of value or volume?
The market size is provided in terms of value, measured in Million.
11. Are there any specific market keywords associated with the report?
Yes, the market keyword associated with the report is "Carbon Black Market," which aids in identifying and referencing the specific market segment covered.
12. How do I determine which pricing option suits my needs best?
The pricing options vary based on user requirements and access needs. Individual users may opt for single-user licenses, while businesses requiring broader access may choose multi-user or enterprise licenses for cost-effective access to the report.
13. Are there any additional resources or data provided in the Carbon Black Market report?
While the report offers comprehensive insights, it's advisable to review the specific contents or supplementary materials provided to ascertain if additional resources or data are available.
14. How can I stay updated on further developments or reports in the Carbon Black Market?
To stay informed about further developments, trends, and reports in the Carbon Black Market, consider subscribing to industry newsletters, following relevant companies and organizations, or regularly checking reputable industry news sources and publications.
Methodology
Step 1 - Identification of Relevant Samples Size from Population Database


Step 2 - Approaches for Defining Global Market Size (Value, Volume* & Price*)

Note*: In applicable scenarios
Step 3 - Data Sources
Primary Research
- Web Analytics
- Survey Reports
- Research Institute
- Latest Research Reports
- Opinion Leaders
Secondary Research
- Annual Reports
- White Paper
- Latest Press Release
- Industry Association
- Paid Database
- Investor Presentations

Step 4 - Data Triangulation
Involves using different sources of information in order to increase the validity of a study
These sources are likely to be stakeholders in a program - participants, other researchers, program staff, other community members, and so on.
Then we put all data in single framework & apply various statistical tools to find out the dynamic on the market.
During the analysis stage, feedback from the stakeholder groups would be compared to determine areas of agreement as well as areas of divergence