

Key Insights
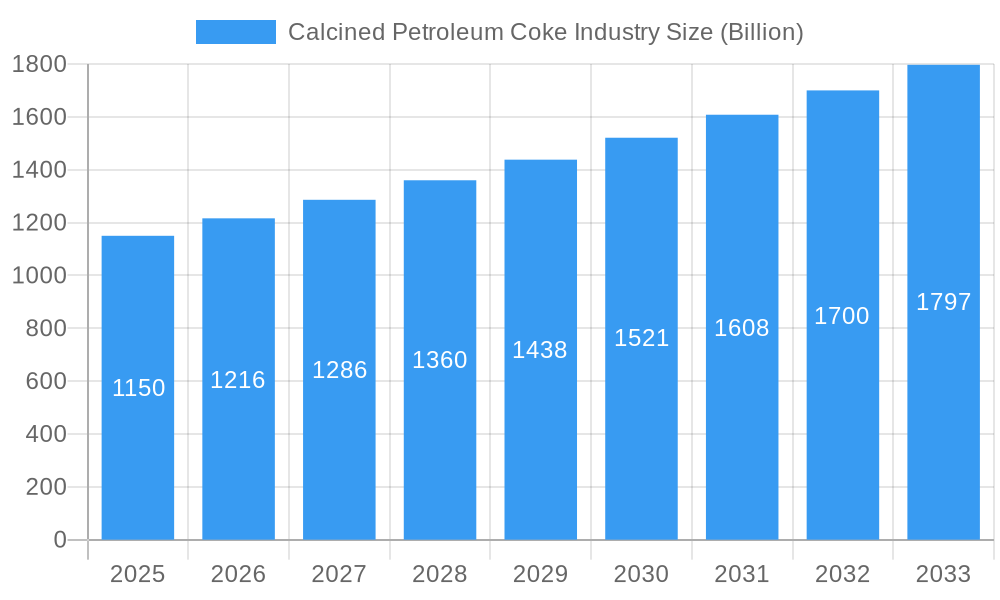
The global calcined petroleum coke (CPC) market, valued at $1.15 billion in 2025, is projected to experience robust growth, driven by increasing demand from the aluminum and steel industries. The 5.45% CAGR signifies a steady expansion, fueled by several key factors. Firstly, the rising global demand for aluminum, a significant consumer of CPC as a fuel source and carbon additive in the smelting process, is a major growth driver. Secondly, the expanding steel industry, which uses CPC in the production of various steel products, further contributes to market growth. The green petroleum coke segment is expected to witness significant traction, driven by environmental concerns and the push for sustainable industrial practices. However, fluctuating crude oil prices and stringent environmental regulations pose challenges to market expansion. The market is segmented by fuel grade and calcined coke, with applications spanning green petroleum coke and other sectors like bricks, glass, and carbon products. Key players like Oxbow Corporation, Petrocoque, and Rain Carbon Inc. are strategically positioned to capitalize on these trends through technological advancements and expansion into new markets. Regional growth will be influenced by industrial activity and government policies related to sustainable development, with Asia-Pacific anticipated to remain a dominant region due to its significant aluminum and steel production capabilities.
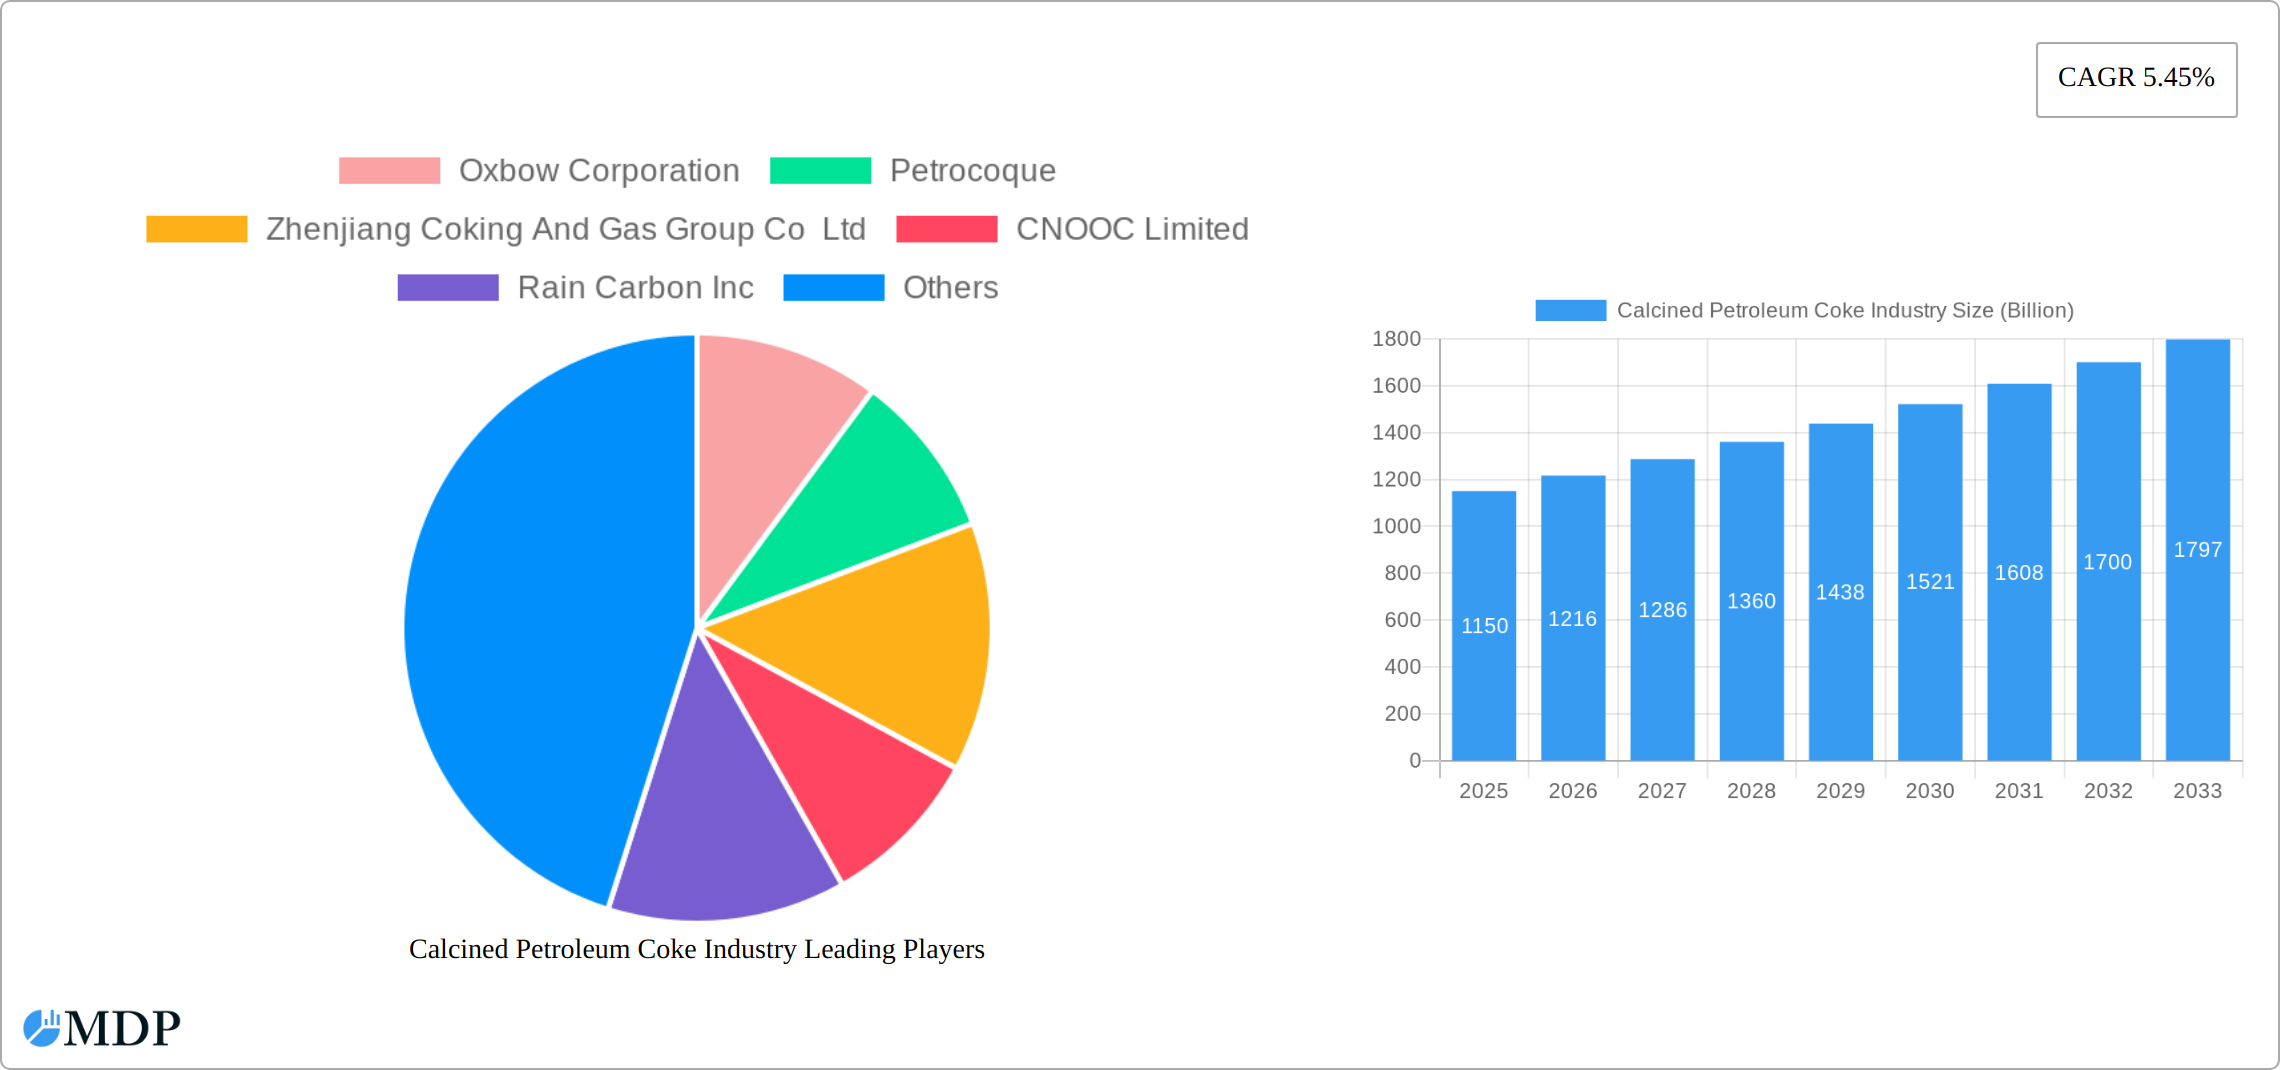
Calcined Petroleum Coke Industry Market Size (In Billion)
The competitive landscape features both large multinational corporations and regional players. Companies are focusing on strategic partnerships, capacity expansions, and technological upgrades to improve CPC quality and efficiency. The market's future trajectory will largely depend on the balance between growing demand from key industries, the impact of environmental regulations, and the successful implementation of sustainable practices within the CPC production and utilization processes. Further research into the development of alternative, more environmentally friendly carbon sources may influence the market's long-term growth trajectory. However, the current positive growth outlook suggests continued expansion and market maturity over the forecast period.
Calcined Petroleum Coke Industry Company Market Share
Calcined Petroleum Coke Industry: A Comprehensive Market Report (2019-2033)
This comprehensive report provides an in-depth analysis of the global calcined petroleum coke (CPC) industry, offering invaluable insights for stakeholders, investors, and industry professionals. The report covers the period from 2019 to 2033, with a focus on the forecast period of 2025-2033 and a base year of 2025. The market is segmented by type (Fuel Grade, Calcined Coke) and application (Green Petroleum Coke, Others – Bricks, Glass, Carbon Products, etc.), providing a granular understanding of market dynamics across diverse segments. The report projects a market valuation exceeding several Billion USD by 2033, driven by key factors detailed within.
Calcined Petroleum Coke Industry Market Dynamics & Concentration
The global calcined petroleum coke market exhibits a moderately concentrated structure, with several large players holding significant market share. Oxbow Corporation, Petrocoque, and Rain Carbon Inc. are among the leading players, each commanding a substantial portion of the global market, estimated at xx%. However, the market also features numerous smaller regional players contributing to the overall landscape.
Market concentration is influenced by factors such as economies of scale in production, access to raw materials, and established distribution networks. Innovation drivers include the development of new applications for CPC, particularly in the green petroleum coke segment, fueled by increasing environmental concerns. Regulatory frameworks vary significantly across regions, influencing production costs and market access. The emergence of alternative carbon materials poses a challenge as product substitutes. End-user trends in the aluminum and steel industries, major consumers of CPC, heavily influence market demand. M&A activity has been moderate in recent years, with a total of xx deals recorded between 2019 and 2024. These activities often aim to enhance supply chain integration and expand market reach.
Calcined Petroleum Coke Industry Industry Trends & Analysis
The calcined petroleum coke market is projected to witness a CAGR of xx% during the forecast period (2025-2033). This growth is primarily driven by the rising demand from the aluminum industry, which utilizes CPC as a crucial carbon source in its smelting process. Furthermore, the increasing demand for green petroleum coke, driven by sustainability initiatives, is another significant growth driver. Technological disruptions, such as improved production processes and the development of advanced applications for CPC, further contribute to market growth. Consumer preferences towards environmentally friendly materials are pushing the adoption of green petroleum coke. Competitive dynamics are characterized by price competition and the introduction of innovative products, creating a dynamic market landscape. Market penetration of green petroleum coke is projected to reach xx% by 2033.
Leading Markets & Segments in Calcined Petroleum Coke Industry
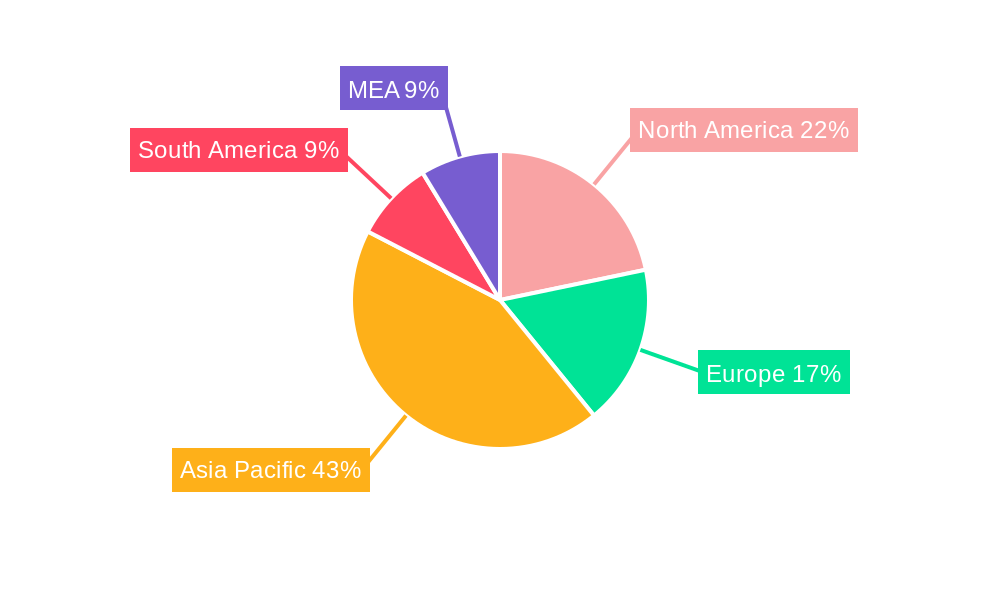
Dominant Region: Asia-Pacific is projected to remain the leading region for CPC consumption, driven by robust demand from China and India, primarily due to their substantial aluminum and steel industries. This dominance is fueled by favorable economic policies supporting industrial growth and substantial investments in infrastructure.
Dominant Segment (Type): Fuel-grade CPC currently holds the largest market share, attributable to its widespread use in various industrial applications. However, the calcined coke segment is expected to witness faster growth due to increasing demand for high-quality carbon materials in specific applications.
Dominant Segment (Application): The aluminum industry accounts for the largest share of CPC consumption, followed by the steel and other industrial sectors. The green petroleum coke segment, though currently smaller, displays significant growth potential.
The continued expansion of the aluminum and steel industries in developing economies, coupled with technological advancements enabling higher-quality CPC production, will solidify the position of Asia-Pacific as the dominant region. Government regulations and environmental policies concerning carbon emissions will also play a significant role in shaping market dynamics.
Calcined Petroleum Coke Industry Product Developments
Recent innovations in the calcined petroleum coke (CPC) industry center on enhancing product quality and consistency to meet the rigorous demands of diverse applications. Advancements in calcination technologies are yielding CPC with superior purity and reactivity. This improved performance fuels the emergence of new applications, driven by the global push for sustainable materials and the development of high-value carbon-based products. Companies are achieving competitive advantages through a multi-pronged strategy encompassing cost leadership, superior product quality, and robust supply chain management. A notable trend is the industry's ongoing shift towards more sustainable and environmentally responsible CPC production methods, reflecting a growing awareness of environmental stewardship.
Key Drivers of Calcined Petroleum Coke Industry Growth
The calcined petroleum coke industry's growth is fueled by several key factors:
Growing Aluminum Production: The global expansion of the aluminum industry is a primary driver, significantly increasing demand for CPC.
Technological Advancements: Improved calcination technologies lead to higher-quality CPC, expanding its applicability.
Favorable Economic Conditions: Sustained economic growth in developing economies stimulates industrial activity and CPC demand.
Challenges in the Calcined Petroleum Coke Industry Market
The calcined petroleum coke industry navigates a complex landscape of challenges:
Stringent Environmental Regulations: Increasingly strict environmental regulations governing air emissions and waste disposal significantly increase production costs for manufacturers. This translates to substantial cost increases, with some producers reporting an approximate xx% rise in production expenses.
Volatile Crude Oil Prices: The inherent volatility of crude oil prices, the primary feedstock for CPC production, creates significant uncertainty, directly impacting production costs and overall profitability.
Intensifying Competition from Alternatives: The emergence of alternative carbon materials poses a growing competitive threat, requiring CPC producers to constantly innovate and improve their offerings.
Supply Chain Disruptions: Global events and geopolitical instability can cause disruptions in the supply chain, impacting the availability and cost of raw materials and transportation.
Emerging Opportunities in Calcined Petroleum Coke Industry
Significant opportunities exist for forward-thinking companies to leverage technological advancements to improve the efficiency and sustainability of CPC production. Strategic collaborations with end-users and other industry players can facilitate market expansion and access to cutting-edge technologies. Exploring novel applications of CPC, particularly within high-value sectors like advanced materials and energy storage, presents compelling avenues for future growth. The expanding market for green petroleum coke, produced using more sustainable methods, holds substantial growth potential as environmental concerns intensify globally.
Leading Players in the Calcined Petroleum Coke Industry Sector
- Oxbow Corporation
- Petrocoque
- Zhenjiang Coking And Gas Group Co Ltd
- CNOOC Limited
- Rain Carbon Inc
- Aluminium Bahrain B S C (Alba)
- Rio Tinto
- Numaligarh Refinery Limited
- Phillips 66 Company
- Maniayargroup
- Saudi Calcined Petroleum Coke Company (SCPC)
- BP PLC
- ELSID SA
Key Milestones in Calcined Petroleum Coke Industry Industry
June 2022: ExxonMobil and researchers at Texas A&M University announced the development of a method to reprocess petroleum coke into graphene, potentially opening new high-value applications.
January 2023: Phillips 66's acquisition of a larger stake in DCP Midstream strengthens its position in the petroleum coke value chain, boosting market productivity.
Strategic Outlook for Calcined Petroleum Coke Industry Market
The calcined petroleum coke market is poised for robust growth, fueled by the sustained expansion of the aluminum and steel industries, coupled with ongoing technological advancements that are delivering higher-quality and more sustainable production methods. Strategic investments in research and development, with a focus on pioneering new applications and implementing sustainable practices, will be paramount for companies aiming to capitalize on this growth. Expanding into new geographical markets, particularly in rapidly developing economies, will also be crucial in shaping future market dynamics and ensuring long-term success within this evolving sector.
Calcined Petroleum Coke Industry Segmentation
-
1. Type
- 1.1. Fuel Grade
- 1.2. Calcined Coke
-
2. Application
-
2.1. Green Petroleum Coke
- 2.1.1. Aluminum
- 2.1.2. Fuel
- 2.1.3. Iron and steel
- 2.1.4. Silicon Metal
- 2.1.5. Others (Bricks, Glass, Carbon Products, etc)
-
2.2. Calcined Petroleum Coke
- 2.2.1. Titanium Dioxide
- 2.2.2. Re-carburizing Market
- 2.2.3. Others (Needle Coke, Carbon Products, etc)
-
2.1. Green Petroleum Coke
Calcined Petroleum Coke Industry Segmentation By Geography
-
1. Asia Pacific
- 1.1. China
- 1.2. India
- 1.3. Japan
- 1.4. South Korea
- 1.5. ASEAN Countries
- 1.6. Rest of Asia Pacific
-
2. North America
- 2.1. United States
- 2.2. Canada
- 2.3. Mexico
-
3. Europe
- 3.1. Germany
- 3.2. United Kingdom
- 3.3. Italy
- 3.4. France
- 3.5. Spain
- 3.6. Rest of Europe
-
4. South America
- 4.1. Brazil
- 4.2. Argentina
- 4.3. Rest of South America
-
5. Middle East and Africa
- 5.1. Saudi Arabia
- 5.2. South Africa
- 5.3. Rest of Middle East and Africa
Calcined Petroleum Coke Industry Regional Market Share
Geographic Coverage of Calcined Petroleum Coke Industry
Calcined Petroleum Coke Industry REPORT HIGHLIGHTS
| Aspects | Details |
|---|---|
| Study Period | 2020-2034 |
| Base Year | 2025 |
| Estimated Year | 2026 |
| Forecast Period | 2026-2034 |
| Historical Period | 2020-2025 |
| Growth Rate | CAGR of 5.45% from 2020-2034 |
| Segmentation |
|
Table of Contents
- 1. Introduction
- 1.1. Research Scope
- 1.2. Market Segmentation
- 1.3. Research Objective
- 1.4. Definitions and Assumptions
- 2. Executive Summary
- 2.1. Market Snapshot
- 3. Market Dynamics
- 3.1. Market Drivers
- 3.2. Market Restrains
- 3.3. Market Trends
- 3.4. Market Opportunities
- 4. Market Factor Analysis
- 4.1. Porters Five Forces
- 4.1.1. Bargaining Power of Suppliers
- 4.1.2. Bargaining Power of Buyers
- 4.1.3. Threat of New Entrants
- 4.1.4. Threat of Substitutes
- 4.1.5. Competitive Rivalry
- 4.2. PESTEL analysis
- 4.3. BCG Analysis
- 4.3.1. Stars (High Growth, High Market Share)
- 4.3.2. Cash Cows (Low Growth, High Market Share)
- 4.3.3. Question Mark (High Growth, Low Market Share)
- 4.3.4. Dogs (Low Growth, Low Market Share)
- 4.4. Ansoff Matrix Analysis
- 4.5. Supply Chain Analysis
- 4.6. Regulatory Landscape
- 4.7. Current Market Potential and Opportunity Assessment (TAM–SAM–SOM Framework)
- 4.8. MDP Analyst Note
- 4.1. Porters Five Forces
- 5. Market Analysis, Insights and Forecast 2021-2033
- 5.1. Market Analysis, Insights and Forecast - by Type
- 5.1.1. Fuel Grade
- 5.1.2. Calcined Coke
- 5.2. Market Analysis, Insights and Forecast - by Application
- 5.2.1. Green Petroleum Coke
- 5.2.1.1. Aluminum
- 5.2.1.2. Fuel
- 5.2.1.3. Iron and steel
- 5.2.1.4. Silicon Metal
- 5.2.1.5. Others (Bricks, Glass, Carbon Products, etc)
- 5.2.2. Calcined Petroleum Coke
- 5.2.2.1. Titanium Dioxide
- 5.2.2.2. Re-carburizing Market
- 5.2.2.3. Others (Needle Coke, Carbon Products, etc)
- 5.2.1. Green Petroleum Coke
- 5.3. Market Analysis, Insights and Forecast - by Region
- 5.3.1. Asia Pacific
- 5.3.2. North America
- 5.3.3. Europe
- 5.3.4. South America
- 5.3.5. Middle East and Africa
- 5.1. Market Analysis, Insights and Forecast - by Type
- 6. Global Calcined Petroleum Coke Industry Analysis, Insights and Forecast, 2021-2033
- 6.1. Market Analysis, Insights and Forecast - by Type
- 6.1.1. Fuel Grade
- 6.1.2. Calcined Coke
- 6.2. Market Analysis, Insights and Forecast - by Application
- 6.2.1. Green Petroleum Coke
- 6.2.1.1. Aluminum
- 6.2.1.2. Fuel
- 6.2.1.3. Iron and steel
- 6.2.1.4. Silicon Metal
- 6.2.1.5. Others (Bricks, Glass, Carbon Products, etc)
- 6.2.2. Calcined Petroleum Coke
- 6.2.2.1. Titanium Dioxide
- 6.2.2.2. Re-carburizing Market
- 6.2.2.3. Others (Needle Coke, Carbon Products, etc)
- 6.2.1. Green Petroleum Coke
- 6.1. Market Analysis, Insights and Forecast - by Type
- 7. Asia Pacific Calcined Petroleum Coke Industry Analysis, Insights and Forecast, 2020-2032
- 7.1. Market Analysis, Insights and Forecast - by Type
- 7.1.1. Fuel Grade
- 7.1.2. Calcined Coke
- 7.2. Market Analysis, Insights and Forecast - by Application
- 7.2.1. Green Petroleum Coke
- 7.2.1.1. Aluminum
- 7.2.1.2. Fuel
- 7.2.1.3. Iron and steel
- 7.2.1.4. Silicon Metal
- 7.2.1.5. Others (Bricks, Glass, Carbon Products, etc)
- 7.2.2. Calcined Petroleum Coke
- 7.2.2.1. Titanium Dioxide
- 7.2.2.2. Re-carburizing Market
- 7.2.2.3. Others (Needle Coke, Carbon Products, etc)
- 7.2.1. Green Petroleum Coke
- 7.1. Market Analysis, Insights and Forecast - by Type
- 8. North America Calcined Petroleum Coke Industry Analysis, Insights and Forecast, 2020-2032
- 8.1. Market Analysis, Insights and Forecast - by Type
- 8.1.1. Fuel Grade
- 8.1.2. Calcined Coke
- 8.2. Market Analysis, Insights and Forecast - by Application
- 8.2.1. Green Petroleum Coke
- 8.2.1.1. Aluminum
- 8.2.1.2. Fuel
- 8.2.1.3. Iron and steel
- 8.2.1.4. Silicon Metal
- 8.2.1.5. Others (Bricks, Glass, Carbon Products, etc)
- 8.2.2. Calcined Petroleum Coke
- 8.2.2.1. Titanium Dioxide
- 8.2.2.2. Re-carburizing Market
- 8.2.2.3. Others (Needle Coke, Carbon Products, etc)
- 8.2.1. Green Petroleum Coke
- 8.1. Market Analysis, Insights and Forecast - by Type
- 9. Europe Calcined Petroleum Coke Industry Analysis, Insights and Forecast, 2020-2032
- 9.1. Market Analysis, Insights and Forecast - by Type
- 9.1.1. Fuel Grade
- 9.1.2. Calcined Coke
- 9.2. Market Analysis, Insights and Forecast - by Application
- 9.2.1. Green Petroleum Coke
- 9.2.1.1. Aluminum
- 9.2.1.2. Fuel
- 9.2.1.3. Iron and steel
- 9.2.1.4. Silicon Metal
- 9.2.1.5. Others (Bricks, Glass, Carbon Products, etc)
- 9.2.2. Calcined Petroleum Coke
- 9.2.2.1. Titanium Dioxide
- 9.2.2.2. Re-carburizing Market
- 9.2.2.3. Others (Needle Coke, Carbon Products, etc)
- 9.2.1. Green Petroleum Coke
- 9.1. Market Analysis, Insights and Forecast - by Type
- 10. South America Calcined Petroleum Coke Industry Analysis, Insights and Forecast, 2020-2032
- 10.1. Market Analysis, Insights and Forecast - by Type
- 10.1.1. Fuel Grade
- 10.1.2. Calcined Coke
- 10.2. Market Analysis, Insights and Forecast - by Application
- 10.2.1. Green Petroleum Coke
- 10.2.1.1. Aluminum
- 10.2.1.2. Fuel
- 10.2.1.3. Iron and steel
- 10.2.1.4. Silicon Metal
- 10.2.1.5. Others (Bricks, Glass, Carbon Products, etc)
- 10.2.2. Calcined Petroleum Coke
- 10.2.2.1. Titanium Dioxide
- 10.2.2.2. Re-carburizing Market
- 10.2.2.3. Others (Needle Coke, Carbon Products, etc)
- 10.2.1. Green Petroleum Coke
- 10.1. Market Analysis, Insights and Forecast - by Type
- 11. Middle East and Africa Calcined Petroleum Coke Industry Analysis, Insights and Forecast, 2020-2032
- 11.1. Market Analysis, Insights and Forecast - by Type
- 11.1.1. Fuel Grade
- 11.1.2. Calcined Coke
- 11.2. Market Analysis, Insights and Forecast - by Application
- 11.2.1. Green Petroleum Coke
- 11.2.1.1. Aluminum
- 11.2.1.2. Fuel
- 11.2.1.3. Iron and steel
- 11.2.1.4. Silicon Metal
- 11.2.1.5. Others (Bricks, Glass, Carbon Products, etc)
- 11.2.2. Calcined Petroleum Coke
- 11.2.2.1. Titanium Dioxide
- 11.2.2.2. Re-carburizing Market
- 11.2.2.3. Others (Needle Coke, Carbon Products, etc)
- 11.2.1. Green Petroleum Coke
- 11.1. Market Analysis, Insights and Forecast - by Type
- 12. Competitive Analysis
- 12.1. Company Profiles
- 12.1.1 Oxbow Corporation
- 12.1.1.1. Company Overview
- 12.1.1.2. Products
- 12.1.1.3. Company Financials
- 12.1.1.4. SWOT Analysis
- 12.1.2 Petrocoque
- 12.1.2.1. Company Overview
- 12.1.2.2. Products
- 12.1.2.3. Company Financials
- 12.1.2.4. SWOT Analysis
- 12.1.3 Zhenjiang Coking And Gas Group Co Ltd
- 12.1.3.1. Company Overview
- 12.1.3.2. Products
- 12.1.3.3. Company Financials
- 12.1.3.4. SWOT Analysis
- 12.1.4 CNOOC Limited
- 12.1.4.1. Company Overview
- 12.1.4.2. Products
- 12.1.4.3. Company Financials
- 12.1.4.4. SWOT Analysis
- 12.1.5 Rain Carbon Inc
- 12.1.5.1. Company Overview
- 12.1.5.2. Products
- 12.1.5.3. Company Financials
- 12.1.5.4. SWOT Analysis
- 12.1.6 Aluminium Bahrain B S C (Alba)
- 12.1.6.1. Company Overview
- 12.1.6.2. Products
- 12.1.6.3. Company Financials
- 12.1.6.4. SWOT Analysis
- 12.1.7 Rio Tinto
- 12.1.7.1. Company Overview
- 12.1.7.2. Products
- 12.1.7.3. Company Financials
- 12.1.7.4. SWOT Analysis
- 12.1.8 Numaligarh Refinery Limited
- 12.1.8.1. Company Overview
- 12.1.8.2. Products
- 12.1.8.3. Company Financials
- 12.1.8.4. SWOT Analysis
- 12.1.9 Phillips 66 Company
- 12.1.9.1. Company Overview
- 12.1.9.2. Products
- 12.1.9.3. Company Financials
- 12.1.9.4. SWOT Analysis
- 12.1.10 Maniayargroup
- 12.1.10.1. Company Overview
- 12.1.10.2. Products
- 12.1.10.3. Company Financials
- 12.1.10.4. SWOT Analysis
- 12.1.11 Saudi Calcined Petroleum Coke Company (SCPC)
- 12.1.11.1. Company Overview
- 12.1.11.2. Products
- 12.1.11.3. Company Financials
- 12.1.11.4. SWOT Analysis
- 12.1.12 BP PLC
- 12.1.12.1. Company Overview
- 12.1.12.2. Products
- 12.1.12.3. Company Financials
- 12.1.12.4. SWOT Analysis
- 12.1.13 ELSID SA
- 12.1.13.1. Company Overview
- 12.1.13.2. Products
- 12.1.13.3. Company Financials
- 12.1.13.4. SWOT Analysis
- 12.1.1 Oxbow Corporation
- 12.2. Market Entropy
- 12.2.1 Company's Key Areas Served
- 12.2.2 Recent Developments
- 12.3. Company Market Share Analysis 2025
- 12.3.1 Top 5 Companies Market Share Analysis
- 12.3.2 Top 3 Companies Market Share Analysis
- 12.4. List of Potential Customers
- 13. Research Methodology
List of Figures
- Figure 1: Global Calcined Petroleum Coke Industry Revenue Breakdown (Billion, %) by Region 2025 & 2033
- Figure 2: Global Calcined Petroleum Coke Industry Volume Breakdown (K Tons, %) by Region 2025 & 2033
- Figure 3: Asia Pacific Calcined Petroleum Coke Industry Revenue (Billion), by Type 2025 & 2033
- Figure 4: Asia Pacific Calcined Petroleum Coke Industry Volume (K Tons), by Type 2025 & 2033
- Figure 5: Asia Pacific Calcined Petroleum Coke Industry Revenue Share (%), by Type 2025 & 2033
- Figure 6: Asia Pacific Calcined Petroleum Coke Industry Volume Share (%), by Type 2025 & 2033
- Figure 7: Asia Pacific Calcined Petroleum Coke Industry Revenue (Billion), by Application 2025 & 2033
- Figure 8: Asia Pacific Calcined Petroleum Coke Industry Volume (K Tons), by Application 2025 & 2033
- Figure 9: Asia Pacific Calcined Petroleum Coke Industry Revenue Share (%), by Application 2025 & 2033
- Figure 10: Asia Pacific Calcined Petroleum Coke Industry Volume Share (%), by Application 2025 & 2033
- Figure 11: Asia Pacific Calcined Petroleum Coke Industry Revenue (Billion), by Country 2025 & 2033
- Figure 12: Asia Pacific Calcined Petroleum Coke Industry Volume (K Tons), by Country 2025 & 2033
- Figure 13: Asia Pacific Calcined Petroleum Coke Industry Revenue Share (%), by Country 2025 & 2033
- Figure 14: Asia Pacific Calcined Petroleum Coke Industry Volume Share (%), by Country 2025 & 2033
- Figure 15: North America Calcined Petroleum Coke Industry Revenue (Billion), by Type 2025 & 2033
- Figure 16: North America Calcined Petroleum Coke Industry Volume (K Tons), by Type 2025 & 2033
- Figure 17: North America Calcined Petroleum Coke Industry Revenue Share (%), by Type 2025 & 2033
- Figure 18: North America Calcined Petroleum Coke Industry Volume Share (%), by Type 2025 & 2033
- Figure 19: North America Calcined Petroleum Coke Industry Revenue (Billion), by Application 2025 & 2033
- Figure 20: North America Calcined Petroleum Coke Industry Volume (K Tons), by Application 2025 & 2033
- Figure 21: North America Calcined Petroleum Coke Industry Revenue Share (%), by Application 2025 & 2033
- Figure 22: North America Calcined Petroleum Coke Industry Volume Share (%), by Application 2025 & 2033
- Figure 23: North America Calcined Petroleum Coke Industry Revenue (Billion), by Country 2025 & 2033
- Figure 24: North America Calcined Petroleum Coke Industry Volume (K Tons), by Country 2025 & 2033
- Figure 25: North America Calcined Petroleum Coke Industry Revenue Share (%), by Country 2025 & 2033
- Figure 26: North America Calcined Petroleum Coke Industry Volume Share (%), by Country 2025 & 2033
- Figure 27: Europe Calcined Petroleum Coke Industry Revenue (Billion), by Type 2025 & 2033
- Figure 28: Europe Calcined Petroleum Coke Industry Volume (K Tons), by Type 2025 & 2033
- Figure 29: Europe Calcined Petroleum Coke Industry Revenue Share (%), by Type 2025 & 2033
- Figure 30: Europe Calcined Petroleum Coke Industry Volume Share (%), by Type 2025 & 2033
- Figure 31: Europe Calcined Petroleum Coke Industry Revenue (Billion), by Application 2025 & 2033
- Figure 32: Europe Calcined Petroleum Coke Industry Volume (K Tons), by Application 2025 & 2033
- Figure 33: Europe Calcined Petroleum Coke Industry Revenue Share (%), by Application 2025 & 2033
- Figure 34: Europe Calcined Petroleum Coke Industry Volume Share (%), by Application 2025 & 2033
- Figure 35: Europe Calcined Petroleum Coke Industry Revenue (Billion), by Country 2025 & 2033
- Figure 36: Europe Calcined Petroleum Coke Industry Volume (K Tons), by Country 2025 & 2033
- Figure 37: Europe Calcined Petroleum Coke Industry Revenue Share (%), by Country 2025 & 2033
- Figure 38: Europe Calcined Petroleum Coke Industry Volume Share (%), by Country 2025 & 2033
- Figure 39: South America Calcined Petroleum Coke Industry Revenue (Billion), by Type 2025 & 2033
- Figure 40: South America Calcined Petroleum Coke Industry Volume (K Tons), by Type 2025 & 2033
- Figure 41: South America Calcined Petroleum Coke Industry Revenue Share (%), by Type 2025 & 2033
- Figure 42: South America Calcined Petroleum Coke Industry Volume Share (%), by Type 2025 & 2033
- Figure 43: South America Calcined Petroleum Coke Industry Revenue (Billion), by Application 2025 & 2033
- Figure 44: South America Calcined Petroleum Coke Industry Volume (K Tons), by Application 2025 & 2033
- Figure 45: South America Calcined Petroleum Coke Industry Revenue Share (%), by Application 2025 & 2033
- Figure 46: South America Calcined Petroleum Coke Industry Volume Share (%), by Application 2025 & 2033
- Figure 47: South America Calcined Petroleum Coke Industry Revenue (Billion), by Country 2025 & 2033
- Figure 48: South America Calcined Petroleum Coke Industry Volume (K Tons), by Country 2025 & 2033
- Figure 49: South America Calcined Petroleum Coke Industry Revenue Share (%), by Country 2025 & 2033
- Figure 50: South America Calcined Petroleum Coke Industry Volume Share (%), by Country 2025 & 2033
- Figure 51: Middle East and Africa Calcined Petroleum Coke Industry Revenue (Billion), by Type 2025 & 2033
- Figure 52: Middle East and Africa Calcined Petroleum Coke Industry Volume (K Tons), by Type 2025 & 2033
- Figure 53: Middle East and Africa Calcined Petroleum Coke Industry Revenue Share (%), by Type 2025 & 2033
- Figure 54: Middle East and Africa Calcined Petroleum Coke Industry Volume Share (%), by Type 2025 & 2033
- Figure 55: Middle East and Africa Calcined Petroleum Coke Industry Revenue (Billion), by Application 2025 & 2033
- Figure 56: Middle East and Africa Calcined Petroleum Coke Industry Volume (K Tons), by Application 2025 & 2033
- Figure 57: Middle East and Africa Calcined Petroleum Coke Industry Revenue Share (%), by Application 2025 & 2033
- Figure 58: Middle East and Africa Calcined Petroleum Coke Industry Volume Share (%), by Application 2025 & 2033
- Figure 59: Middle East and Africa Calcined Petroleum Coke Industry Revenue (Billion), by Country 2025 & 2033
- Figure 60: Middle East and Africa Calcined Petroleum Coke Industry Volume (K Tons), by Country 2025 & 2033
- Figure 61: Middle East and Africa Calcined Petroleum Coke Industry Revenue Share (%), by Country 2025 & 2033
- Figure 62: Middle East and Africa Calcined Petroleum Coke Industry Volume Share (%), by Country 2025 & 2033
List of Tables
- Table 1: Global Calcined Petroleum Coke Industry Revenue Billion Forecast, by Type 2020 & 2033
- Table 2: Global Calcined Petroleum Coke Industry Volume K Tons Forecast, by Type 2020 & 2033
- Table 3: Global Calcined Petroleum Coke Industry Revenue Billion Forecast, by Application 2020 & 2033
- Table 4: Global Calcined Petroleum Coke Industry Volume K Tons Forecast, by Application 2020 & 2033
- Table 5: Global Calcined Petroleum Coke Industry Revenue Billion Forecast, by Region 2020 & 2033
- Table 6: Global Calcined Petroleum Coke Industry Volume K Tons Forecast, by Region 2020 & 2033
- Table 7: Global Calcined Petroleum Coke Industry Revenue Billion Forecast, by Type 2020 & 2033
- Table 8: Global Calcined Petroleum Coke Industry Volume K Tons Forecast, by Type 2020 & 2033
- Table 9: Global Calcined Petroleum Coke Industry Revenue Billion Forecast, by Application 2020 & 2033
- Table 10: Global Calcined Petroleum Coke Industry Volume K Tons Forecast, by Application 2020 & 2033
- Table 11: Global Calcined Petroleum Coke Industry Revenue Billion Forecast, by Country 2020 & 2033
- Table 12: Global Calcined Petroleum Coke Industry Volume K Tons Forecast, by Country 2020 & 2033
- Table 13: China Calcined Petroleum Coke Industry Revenue (Billion) Forecast, by Application 2020 & 2033
- Table 14: China Calcined Petroleum Coke Industry Volume (K Tons) Forecast, by Application 2020 & 2033
- Table 15: India Calcined Petroleum Coke Industry Revenue (Billion) Forecast, by Application 2020 & 2033
- Table 16: India Calcined Petroleum Coke Industry Volume (K Tons) Forecast, by Application 2020 & 2033
- Table 17: Japan Calcined Petroleum Coke Industry Revenue (Billion) Forecast, by Application 2020 & 2033
- Table 18: Japan Calcined Petroleum Coke Industry Volume (K Tons) Forecast, by Application 2020 & 2033
- Table 19: South Korea Calcined Petroleum Coke Industry Revenue (Billion) Forecast, by Application 2020 & 2033
- Table 20: South Korea Calcined Petroleum Coke Industry Volume (K Tons) Forecast, by Application 2020 & 2033
- Table 21: ASEAN Countries Calcined Petroleum Coke Industry Revenue (Billion) Forecast, by Application 2020 & 2033
- Table 22: ASEAN Countries Calcined Petroleum Coke Industry Volume (K Tons) Forecast, by Application 2020 & 2033
- Table 23: Rest of Asia Pacific Calcined Petroleum Coke Industry Revenue (Billion) Forecast, by Application 2020 & 2033
- Table 24: Rest of Asia Pacific Calcined Petroleum Coke Industry Volume (K Tons) Forecast, by Application 2020 & 2033
- Table 25: Global Calcined Petroleum Coke Industry Revenue Billion Forecast, by Type 2020 & 2033
- Table 26: Global Calcined Petroleum Coke Industry Volume K Tons Forecast, by Type 2020 & 2033
- Table 27: Global Calcined Petroleum Coke Industry Revenue Billion Forecast, by Application 2020 & 2033
- Table 28: Global Calcined Petroleum Coke Industry Volume K Tons Forecast, by Application 2020 & 2033
- Table 29: Global Calcined Petroleum Coke Industry Revenue Billion Forecast, by Country 2020 & 2033
- Table 30: Global Calcined Petroleum Coke Industry Volume K Tons Forecast, by Country 2020 & 2033
- Table 31: United States Calcined Petroleum Coke Industry Revenue (Billion) Forecast, by Application 2020 & 2033
- Table 32: United States Calcined Petroleum Coke Industry Volume (K Tons) Forecast, by Application 2020 & 2033
- Table 33: Canada Calcined Petroleum Coke Industry Revenue (Billion) Forecast, by Application 2020 & 2033
- Table 34: Canada Calcined Petroleum Coke Industry Volume (K Tons) Forecast, by Application 2020 & 2033
- Table 35: Mexico Calcined Petroleum Coke Industry Revenue (Billion) Forecast, by Application 2020 & 2033
- Table 36: Mexico Calcined Petroleum Coke Industry Volume (K Tons) Forecast, by Application 2020 & 2033
- Table 37: Global Calcined Petroleum Coke Industry Revenue Billion Forecast, by Type 2020 & 2033
- Table 38: Global Calcined Petroleum Coke Industry Volume K Tons Forecast, by Type 2020 & 2033
- Table 39: Global Calcined Petroleum Coke Industry Revenue Billion Forecast, by Application 2020 & 2033
- Table 40: Global Calcined Petroleum Coke Industry Volume K Tons Forecast, by Application 2020 & 2033
- Table 41: Global Calcined Petroleum Coke Industry Revenue Billion Forecast, by Country 2020 & 2033
- Table 42: Global Calcined Petroleum Coke Industry Volume K Tons Forecast, by Country 2020 & 2033
- Table 43: Germany Calcined Petroleum Coke Industry Revenue (Billion) Forecast, by Application 2020 & 2033
- Table 44: Germany Calcined Petroleum Coke Industry Volume (K Tons) Forecast, by Application 2020 & 2033
- Table 45: United Kingdom Calcined Petroleum Coke Industry Revenue (Billion) Forecast, by Application 2020 & 2033
- Table 46: United Kingdom Calcined Petroleum Coke Industry Volume (K Tons) Forecast, by Application 2020 & 2033
- Table 47: Italy Calcined Petroleum Coke Industry Revenue (Billion) Forecast, by Application 2020 & 2033
- Table 48: Italy Calcined Petroleum Coke Industry Volume (K Tons) Forecast, by Application 2020 & 2033
- Table 49: France Calcined Petroleum Coke Industry Revenue (Billion) Forecast, by Application 2020 & 2033
- Table 50: France Calcined Petroleum Coke Industry Volume (K Tons) Forecast, by Application 2020 & 2033
- Table 51: Spain Calcined Petroleum Coke Industry Revenue (Billion) Forecast, by Application 2020 & 2033
- Table 52: Spain Calcined Petroleum Coke Industry Volume (K Tons) Forecast, by Application 2020 & 2033
- Table 53: Rest of Europe Calcined Petroleum Coke Industry Revenue (Billion) Forecast, by Application 2020 & 2033
- Table 54: Rest of Europe Calcined Petroleum Coke Industry Volume (K Tons) Forecast, by Application 2020 & 2033
- Table 55: Global Calcined Petroleum Coke Industry Revenue Billion Forecast, by Type 2020 & 2033
- Table 56: Global Calcined Petroleum Coke Industry Volume K Tons Forecast, by Type 2020 & 2033
- Table 57: Global Calcined Petroleum Coke Industry Revenue Billion Forecast, by Application 2020 & 2033
- Table 58: Global Calcined Petroleum Coke Industry Volume K Tons Forecast, by Application 2020 & 2033
- Table 59: Global Calcined Petroleum Coke Industry Revenue Billion Forecast, by Country 2020 & 2033
- Table 60: Global Calcined Petroleum Coke Industry Volume K Tons Forecast, by Country 2020 & 2033
- Table 61: Brazil Calcined Petroleum Coke Industry Revenue (Billion) Forecast, by Application 2020 & 2033
- Table 62: Brazil Calcined Petroleum Coke Industry Volume (K Tons) Forecast, by Application 2020 & 2033
- Table 63: Argentina Calcined Petroleum Coke Industry Revenue (Billion) Forecast, by Application 2020 & 2033
- Table 64: Argentina Calcined Petroleum Coke Industry Volume (K Tons) Forecast, by Application 2020 & 2033
- Table 65: Rest of South America Calcined Petroleum Coke Industry Revenue (Billion) Forecast, by Application 2020 & 2033
- Table 66: Rest of South America Calcined Petroleum Coke Industry Volume (K Tons) Forecast, by Application 2020 & 2033
- Table 67: Global Calcined Petroleum Coke Industry Revenue Billion Forecast, by Type 2020 & 2033
- Table 68: Global Calcined Petroleum Coke Industry Volume K Tons Forecast, by Type 2020 & 2033
- Table 69: Global Calcined Petroleum Coke Industry Revenue Billion Forecast, by Application 2020 & 2033
- Table 70: Global Calcined Petroleum Coke Industry Volume K Tons Forecast, by Application 2020 & 2033
- Table 71: Global Calcined Petroleum Coke Industry Revenue Billion Forecast, by Country 2020 & 2033
- Table 72: Global Calcined Petroleum Coke Industry Volume K Tons Forecast, by Country 2020 & 2033
- Table 73: Saudi Arabia Calcined Petroleum Coke Industry Revenue (Billion) Forecast, by Application 2020 & 2033
- Table 74: Saudi Arabia Calcined Petroleum Coke Industry Volume (K Tons) Forecast, by Application 2020 & 2033
- Table 75: South Africa Calcined Petroleum Coke Industry Revenue (Billion) Forecast, by Application 2020 & 2033
- Table 76: South Africa Calcined Petroleum Coke Industry Volume (K Tons) Forecast, by Application 2020 & 2033
- Table 77: Rest of Middle East and Africa Calcined Petroleum Coke Industry Revenue (Billion) Forecast, by Application 2020 & 2033
- Table 78: Rest of Middle East and Africa Calcined Petroleum Coke Industry Volume (K Tons) Forecast, by Application 2020 & 2033
Frequently Asked Questions
1. What is the projected Compound Annual Growth Rate (CAGR) of the Calcined Petroleum Coke Industry?
The projected CAGR is approximately 5.45%.
2. Which companies are prominent players in the Calcined Petroleum Coke Industry?
Key companies in the market include Oxbow Corporation, Petrocoque, Zhenjiang Coking And Gas Group Co Ltd, CNOOC Limited, Rain Carbon Inc, Aluminium Bahrain B S C (Alba), Rio Tinto, Numaligarh Refinery Limited, Phillips 66 Company, Maniayargroup, Saudi Calcined Petroleum Coke Company (SCPC), BP PLC, ELSID SA.
3. What are the main segments of the Calcined Petroleum Coke Industry?
The market segments include Type, Application.
4. Can you provide details about the market size?
The market size is estimated to be USD 1.15 Billion as of 2022.
5. What are some drivers contributing to market growth?
Increasing Demand from Aluminum Applications; Other Drivers.
6. What are the notable trends driving market growth?
Aluminium Segment to Drive the Market Growth.
7. Are there any restraints impacting market growth?
Fluctuating Prices for Raw Materials; Other Restraints.
8. Can you provide examples of recent developments in the market?
January 2023: Phillips 66 and DCP Midstream, LP announced a definitive agreement under which Phillips 66 will acquire all publicly traded standard units representing limited partner interests in DCP Midstream for cash consideration of USD 41.75 per standard unit, increasing its economic interest in DCP Midstream to 86.8%. It will strengthen the corporation and, in specific ways, boost the market productivity of petroleum coke.
9. What pricing options are available for accessing the report?
Pricing options include single-user, multi-user, and enterprise licenses priced at USD 4750, USD 5250, and USD 8750 respectively.
10. Is the market size provided in terms of value or volume?
The market size is provided in terms of value, measured in Billion and volume, measured in K Tons.
11. Are there any specific market keywords associated with the report?
Yes, the market keyword associated with the report is "Calcined Petroleum Coke Industry," which aids in identifying and referencing the specific market segment covered.
12. How do I determine which pricing option suits my needs best?
The pricing options vary based on user requirements and access needs. Individual users may opt for single-user licenses, while businesses requiring broader access may choose multi-user or enterprise licenses for cost-effective access to the report.
13. Are there any additional resources or data provided in the Calcined Petroleum Coke Industry report?
While the report offers comprehensive insights, it's advisable to review the specific contents or supplementary materials provided to ascertain if additional resources or data are available.
14. How can I stay updated on further developments or reports in the Calcined Petroleum Coke Industry?
To stay informed about further developments, trends, and reports in the Calcined Petroleum Coke Industry, consider subscribing to industry newsletters, following relevant companies and organizations, or regularly checking reputable industry news sources and publications.
Methodology
Step 1 - Identification of Relevant Samples Size from Population Database


Step 2 - Approaches for Defining Global Market Size (Value, Volume* & Price*)

Note*: In applicable scenarios
Step 3 - Data Sources
Primary Research
- Web Analytics
- Survey Reports
- Research Institute
- Latest Research Reports
- Opinion Leaders
Secondary Research
- Annual Reports
- White Paper
- Latest Press Release
- Industry Association
- Paid Database
- Investor Presentations

Step 4 - Data Triangulation
Involves using different sources of information in order to increase the validity of a study
These sources are likely to be stakeholders in a program - participants, other researchers, program staff, other community members, and so on.
Then we put all data in single framework & apply various statistical tools to find out the dynamic on the market.
During the analysis stage, feedback from the stakeholder groups would be compared to determine areas of agreement as well as areas of divergence