

Key Insights
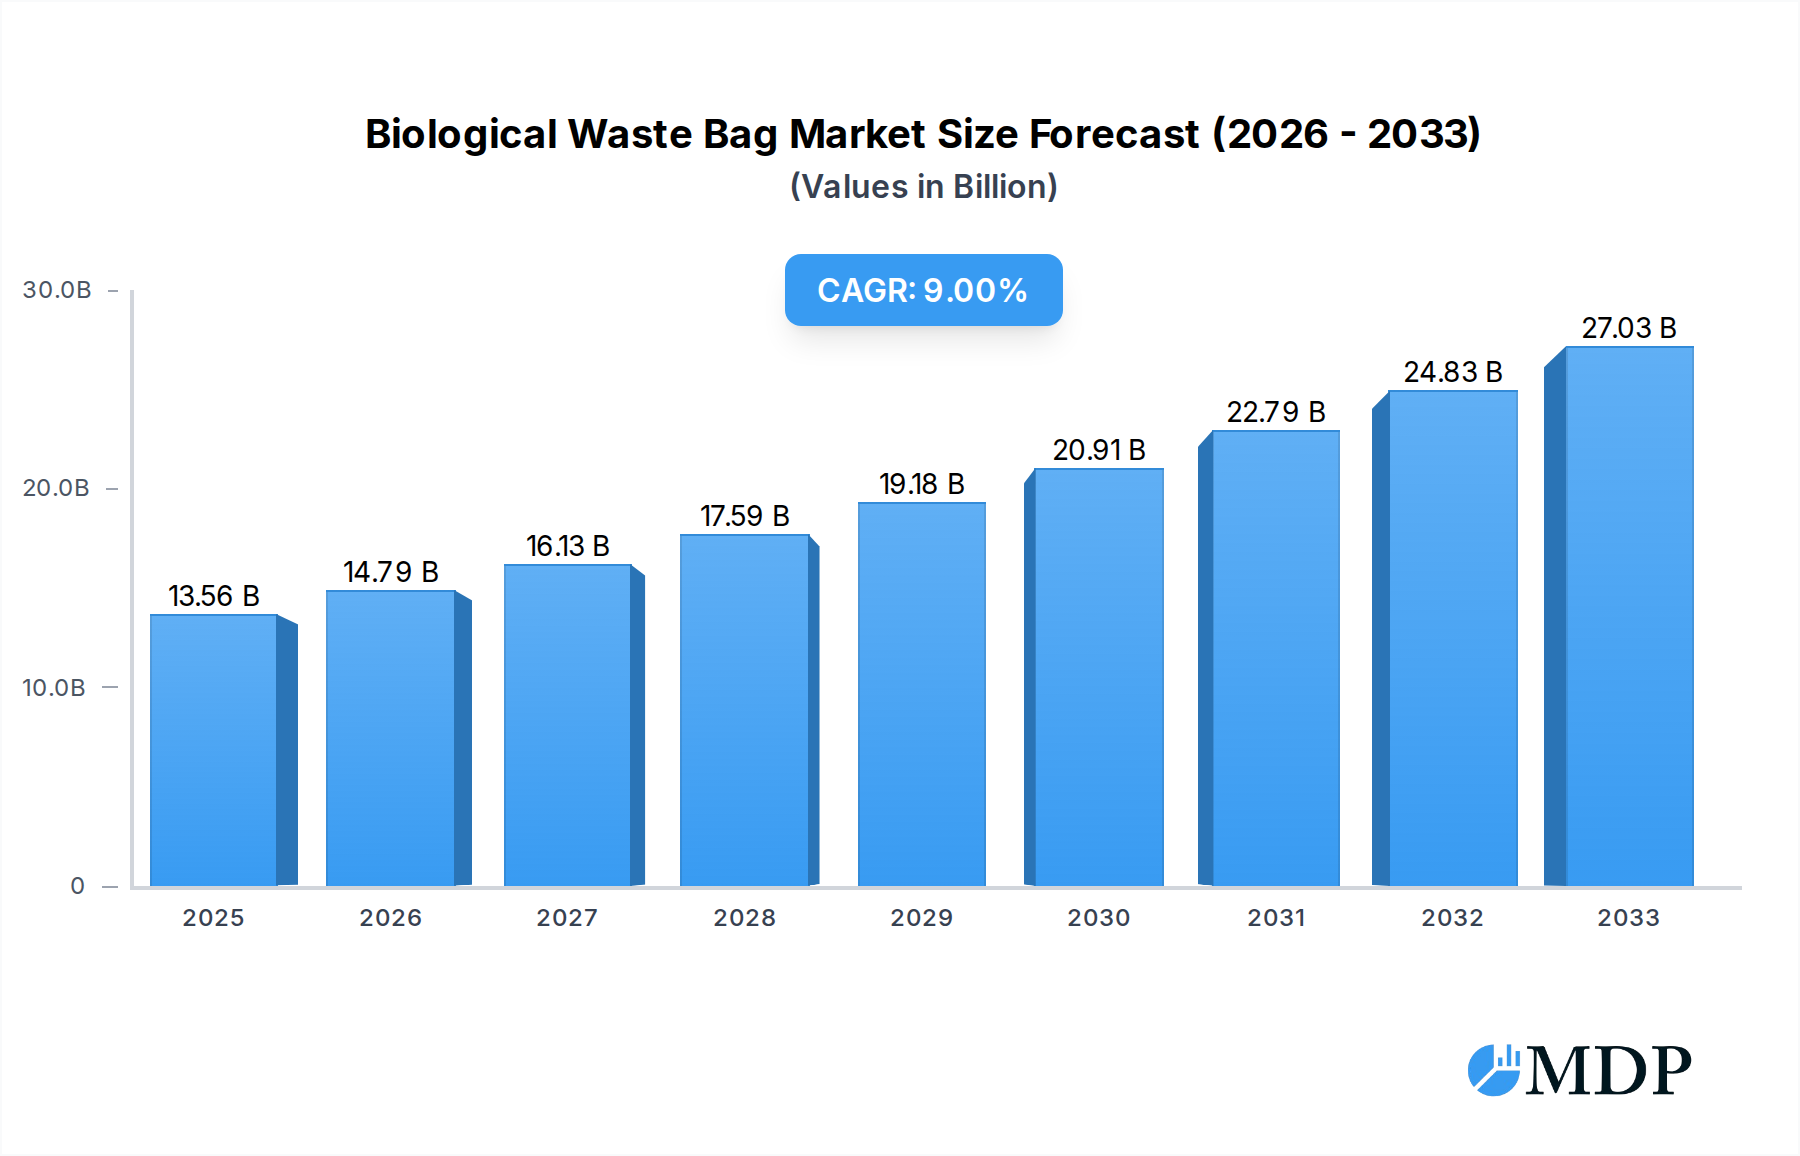
The Biological Waste Bag market is poised for significant expansion, driven by a growing global awareness of healthcare-associated infections and stringent waste management regulations. The market is estimated to reach $13.56 billion in 2025, with a robust Compound Annual Growth Rate (CAGR) of 9.05% projected from 2025 to 2033. This growth is primarily fueled by the increasing adoption of specialized biological waste bags in chemical plants, hospitals, and laboratories for the safe disposal of biohazardous materials, reducing the risk of contamination and disease transmission. The rising incidence of infectious diseases and the expanding healthcare infrastructure, particularly in emerging economies, further bolster demand. Moreover, advancements in material science are leading to the development of more durable, leak-proof, and environmentally friendly biological waste bags, catering to evolving industry needs and regulatory demands for sustainable waste management solutions.

Biological Waste Bag Market Size (In Billion)
The market's upward trajectory is further supported by key trends such as the increasing preference for color-coded bags (e.g., yellow for biohazards, red for sharps) to ensure proper segregation and disposal protocols, thereby enhancing safety and compliance. Innovations in antimicrobial coatings and barrier technologies are also contributing to market growth by offering superior protection against pathogens. While the market benefits from these strong drivers and trends, it also faces certain restraints. The primary challenges include the fluctuating costs of raw materials, such as polyethylene, which can impact profit margins for manufacturers. Additionally, the presence of a fragmented market with numerous small and medium-sized players could lead to intense price competition. However, the overarching demand for safe and compliant biohazardous waste disposal, coupled with continuous technological advancements and a focus on public health, is expected to outweigh these challenges and sustain the market's healthy growth.
Biological Waste Bag Company Market Share
Biological Waste Bag Market: A Comprehensive Industry Report (2019-2033)
This in-depth report provides a detailed analysis of the global Biological Waste Bag market, covering historical performance, current dynamics, and future projections. With an estimated market size reaching several billion by 2025, this report delves into the intricate factors shaping the industry, from regulatory landscapes to technological advancements. Our comprehensive research, spanning the study period of 2019–2033, with a base and estimated year of 2025, offers actionable insights for stakeholders seeking to navigate this crucial sector.
Biological Waste Bag Market Dynamics & Concentration
The Biological Waste Bag market, projected to reach billions in value by 2025, exhibits a moderate to high concentration, driven by a few dominant players and a growing number of specialized manufacturers. Innovation is primarily fueled by stringent regulatory requirements for biohazard waste disposal and advancements in material science, leading to the development of more robust, leak-proof, and puncture-resistant bags. Regulatory frameworks, particularly in healthcare and chemical industries, play a pivotal role, dictating standards for color-coding (e.g., yellow for biohazards, red for sharps), labeling, and disposal protocols. The presence of product substitutes, such as rigid containers for certain biohazardous materials, presents a mild competitive pressure, but the inherent convenience and cost-effectiveness of biological waste bags ensure their continued dominance. End-user trends reveal a growing demand for specialized bags tailored to specific waste streams, such as chemotherapy waste or pathological waste. Mergers and acquisitions (M&A) activities are a significant driver of market consolidation, with recent deals demonstrating strategic moves to expand product portfolios and market reach. For instance, recent M&A activities in the past five years have seen an average of xx deals annually, signaling a dynamic consolidation phase. Key M&A strategies focus on acquiring innovative material technologies or expanding distribution networks in high-growth regions. Market share distribution is characterized by leading players holding substantial portions, while niche players focus on specific applications and regional markets.
Biological Waste Bag Industry Trends & Analysis
The global Biological Waste Bag market is poised for substantial growth, driven by an escalating need for safe and efficient biohazardous waste management across diverse sectors. The market is projected to expand at a Compound Annual Growth Rate (CAGR) of xx.xx% during the forecast period of 2025–2033, with an estimated market value reaching several billions. This growth is underpinned by several key factors. Firstly, the increasing global incidence of infectious diseases and a heightened awareness regarding their containment are paramount. This surge in awareness, particularly post-pandemic, has significantly boosted the demand for reliable biohazard containment solutions. Secondly, advancements in healthcare infrastructure, coupled with a growing number of hospitals, diagnostic laboratories, and research facilities worldwide, directly translate into higher consumption of biological waste bags. The continuous expansion of healthcare services in emerging economies further accentuates this trend. Thirdly, stringent governmental regulations and international guidelines concerning the safe handling and disposal of medical and biohazardous waste are acting as powerful catalysts for market expansion. These regulations often mandate the use of specific types of waste bags, driving demand for compliant products.
Technological disruptions are also playing a crucial role. Innovations in polymer technology are leading to the development of stronger, more durable, and environmentally conscious biological waste bags. For example, the introduction of antimicrobial additives and enhanced puncture resistance is improving safety and reducing the risk of contamination. Furthermore, the integration of smart technologies, such as RFID tagging for tracking and management of waste, is an emerging trend that could revolutionize waste management practices. Consumer preferences are shifting towards eco-friendly and sustainable solutions. While traditional plastic bags remain dominant, there is a growing interest in biodegradable or recyclable alternatives, prompting manufacturers to invest in research and development for such materials. However, the cost-effectiveness and performance of conventional materials currently maintain their market leadership. Competitive dynamics within the industry are characterized by a mix of large, established players and agile, specialized manufacturers. Companies are increasingly focusing on product differentiation, superior quality, and competitive pricing to capture market share. The market penetration for biological waste bags is already high in developed regions, with significant growth opportunities lying in untapped emerging markets. The historical period from 2019 to 2024 witnessed a steady growth trajectory, laying a strong foundation for the anticipated expansion in the coming years.
Leading Markets & Segments in Biological Waste Bag
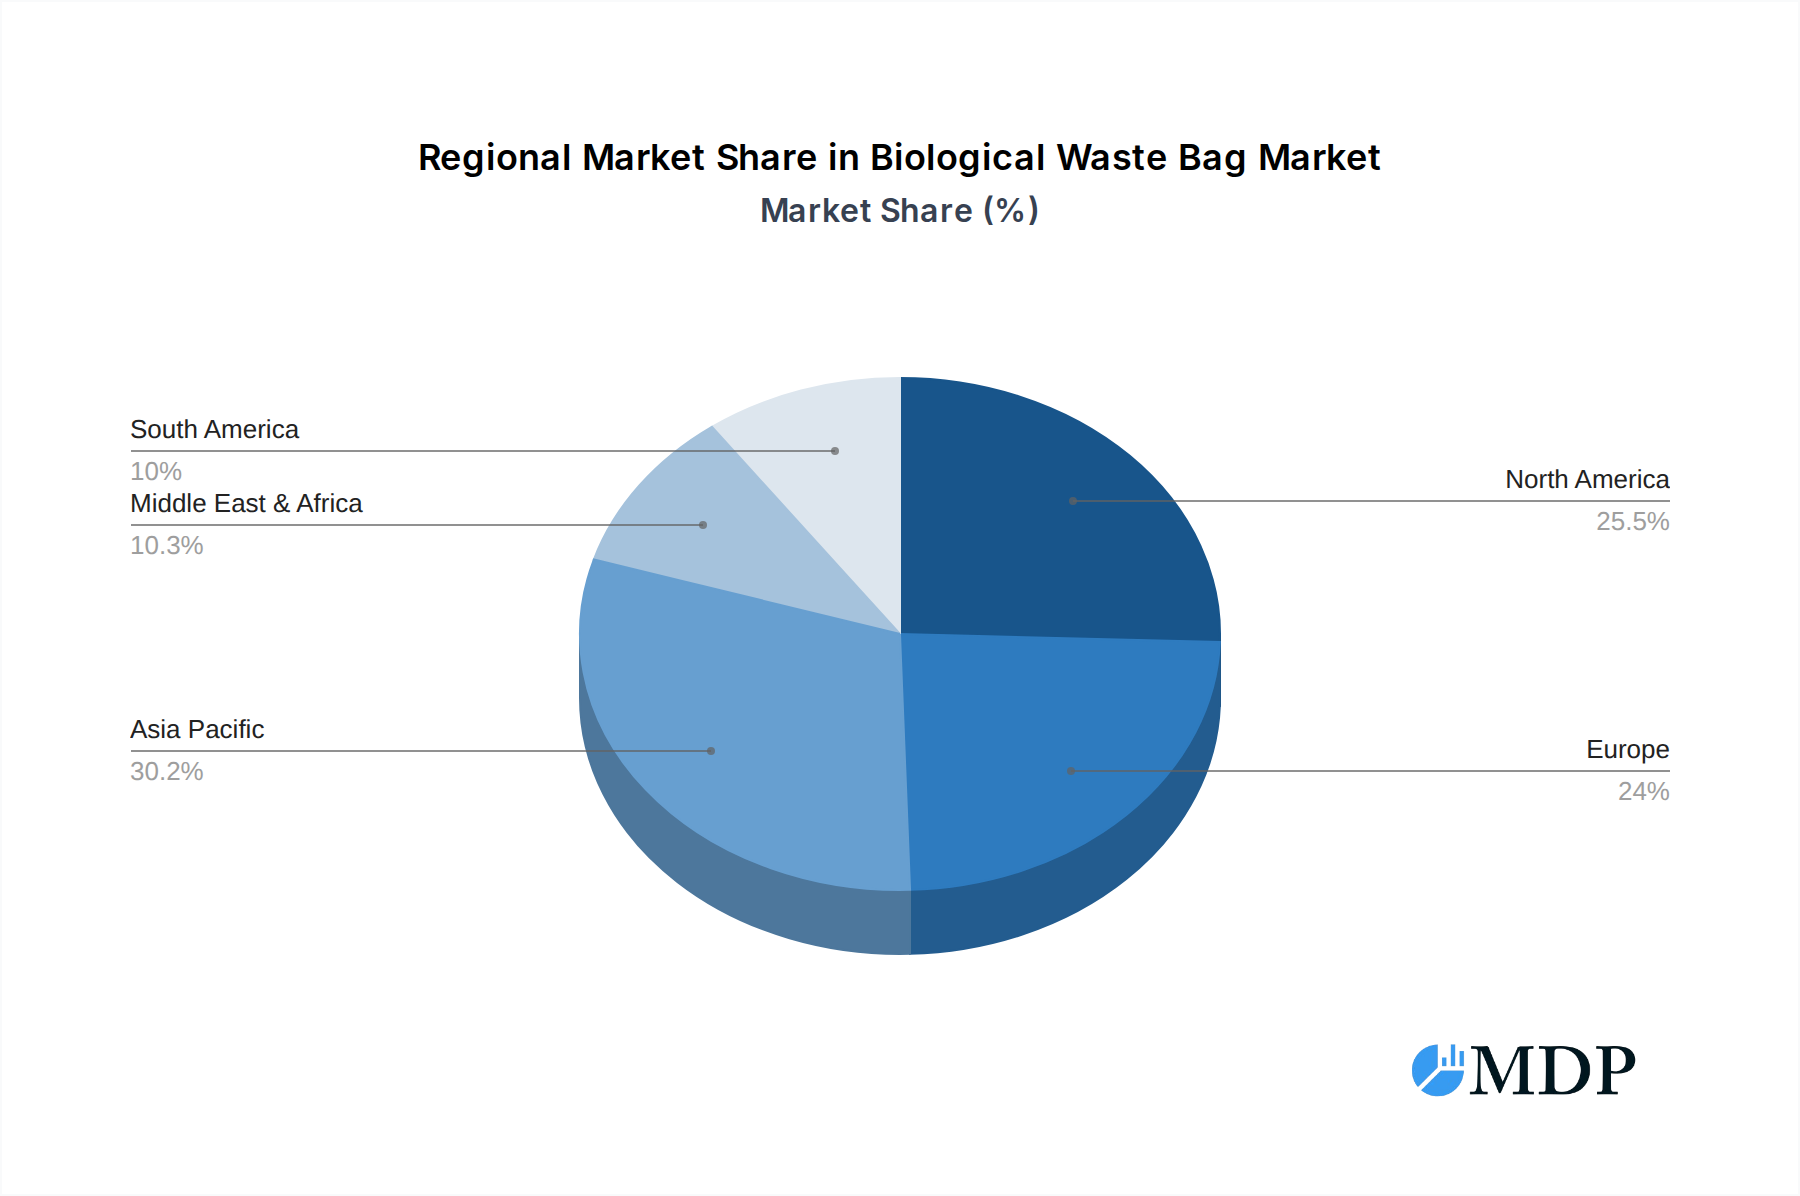
The Biological Waste Bag market's dominance is multifaceted, with specific regions and applications taking precedence. North America currently holds a significant market share, driven by advanced healthcare infrastructure, stringent regulatory enforcement, and a high concentration of research and development facilities. The United States, in particular, is a key market owing to its extensive hospital networks and robust chemical industry. Emerging economies in Asia-Pacific are rapidly gaining traction, fueled by increasing healthcare expenditure, expanding industrial sectors, and a growing awareness of biohazard waste management.
Within the Application segment, Hospitals represent the largest consumer of biological waste bags. The sheer volume of biological waste generated by patient care, surgical procedures, and diagnostic testing in hospital settings necessitates a consistent and high demand for these products. The Laboratory segment follows closely, driven by research institutions, diagnostic labs, and pharmaceutical companies that handle a wide array of infectious agents and chemical waste. The Chemical Plant application is also a significant contributor, particularly for managing hazardous chemical by-products that require specialized containment.
The Type segment is clearly led by Yellow biological waste bags, which are universally recognized for the disposal of infectious waste and biohazards in healthcare and laboratory environments. Red biological waste bags are also crucial, primarily designated for the disposal of sharps, such as needles and syringes, to prevent accidental punctures and injuries. While "Others" encompass a range of specialized bags (e.g., chemotherapy waste bags, pharmaceutical waste bags), yellow and red variants command the largest market share due to their widespread regulatory adoption and critical safety functions.
Key drivers for the dominance of these regions and segments include:
- Economic Policies: Government initiatives supporting healthcare expansion, investments in research infrastructure, and environmental protection policies significantly influence demand.
- Infrastructure Development: The presence of advanced healthcare facilities, well-equipped laboratories, and robust industrial setups directly correlates with higher consumption of biological waste bags.
- Regulatory Frameworks: Strict adherence to biohazard waste disposal regulations, such as those mandated by OSHA in the US and similar bodies globally, enforces the use of specific types and colors of waste bags.
- Technological Adoption: The uptake of advanced waste management technologies and the increasing complexity of research activities in laboratories necessitate specialized and reliable waste containment solutions.
- Public Health Initiatives: Campaigns promoting sanitation, disease prevention, and safe waste disposal practices further augment the demand for biological waste bags.
Biological Waste Bag Product Developments
Product innovation in the Biological Waste Bag sector is primarily focused on enhancing safety, durability, and compliance. Manufacturers are developing bags with superior puncture and tear resistance, utilizing advanced polymer blends to prevent leaks and spills of hazardous materials. Antimicrobial additives are being incorporated to inhibit microbial growth within the bags, adding an extra layer of protection. Furthermore, there's a growing trend towards specialized bags designed for specific waste streams, such as those for chemotherapy drugs or radioactive materials, offering tailored containment solutions. The development of bags with integrated sealing mechanisms and clear, compliant labeling further streamlines the waste disposal process, ensuring user safety and regulatory adherence.
Key Drivers of Biological Waste Bag Growth
Several factors are propelling the growth of the Biological Waste Bag market. The escalating global healthcare expenditure, leading to the expansion of hospitals and diagnostic facilities, directly increases the volume of biohazardous waste generated. Stringent government regulations and international guidelines mandating the safe disposal of medical and biohazardous waste are significant growth accelerators, compelling organizations to adopt compliant waste bags. Technological advancements in material science, resulting in more durable, leak-proof, and specialized waste bags, are enhancing product offerings and driving demand. Furthermore, the rising awareness of infectious disease control and the imperative for environmental protection are bolstering the need for effective biohazard waste management solutions. The increasing prevalence of chronic diseases and the growing volume of research in life sciences further contribute to sustained demand.
Challenges in the Biological Waste Bag Market
Despite robust growth prospects, the Biological Waste Bag market faces several challenges. Strict regulatory compliance, while a driver, also imposes significant costs on manufacturers for testing, certification, and adherence to evolving standards. The disposal of traditional plastic waste bags raises environmental concerns, leading to pressure for more sustainable alternatives, which may come with higher production costs or performance compromises. Supply chain disruptions, including raw material price volatility and logistical complexities, can impact manufacturing and delivery efficiency. Intense competition among numerous players can lead to price wars, potentially squeezing profit margins. Furthermore, the initial cost of implementing advanced waste management systems and investing in specialized bags can be a barrier for smaller organizations or those in price-sensitive markets.
Emerging Opportunities in Biological Waste Bag
Emerging opportunities in the Biological Waste Bag market are primarily driven by innovation and expanding applications. The growing demand for eco-friendly and biodegradable waste bags presents a significant avenue for growth, catering to environmentally conscious consumers and businesses. Advancements in smart packaging, including integrated sensors for tracking waste origin, volume, and disposal, offer potential for more efficient and transparent waste management systems. The increasing adoption of telemedicine and home healthcare services necessitates the development of convenient and safe biohazard disposal solutions for domestic use. Furthermore, the expansion of industrial sectors in developing economies, coupled with stricter environmental regulations, creates substantial untapped market potential. Strategic partnerships between waste management companies and bag manufacturers can unlock new distribution channels and co-develop innovative solutions.
Leading Players in the Biological Waste Bag Sector
- Inteplast Group
- Cromwell Polythene
- Thermo Fisher Scientific
- Medline Industries
- Stericycle
- Seroat International Inc
- Rumoma Industries
- Lithey
- Alte-Rego
- Novolex
- Bel-Art Products
- Plascon Group
- Universal Plastic Bag Co
- Justrite
- bagbarn.com
- Maco PKG
- C-P Flexible Packaging
- Envision
- New York Packaging Corp
- Vonco Products, Inc
- Inmark
- Elkay Plastics Co., Inc
- Carolina CoverTech
- Medegen Medical Products
- Excellent Poly, Inc
- SupplyOne, Inc
- Weifang Lifuyuan Packaging Products Co., Ltd.
- Zhejiang Tailin Biotechnology Co., Ltd.
- Anhui Jiesuri Industrial Equipment Co., Ltd.
Key Milestones in Biological Waste Bag Industry
- 2019: Increased global focus on biosecurity and pandemic preparedness leads to a surge in demand for high-quality biological waste bags.
- 2020: The COVID-19 pandemic significantly escalates the need for medical waste containment, driving innovation in infection control solutions and boosting sales of specialized biohazard bags.
- 2021: Growing environmental consciousness sparks increased research and development into biodegradable and compostable biological waste bag alternatives.
- 2022: Introduction of advanced polymer technologies offering enhanced puncture and tear resistance in biological waste bags, improving safety for healthcare workers.
- 2023: Increased implementation of stricter regulatory frameworks for biohazardous waste management in emerging economies, creating new market opportunities.
- 2024: Development and initial market introduction of smart biological waste bags with embedded tracking and identification features for enhanced waste management efficiency.
Strategic Outlook for Biological Waste Bag Market
The strategic outlook for the Biological Waste Bag market remains exceptionally positive, driven by an unwavering global emphasis on public health and environmental safety. The persistent rise in healthcare expenditure, coupled with the continuous expansion of research and industrial sectors, ensures a sustained demand for effective biohazard containment solutions. The future growth trajectory will be significantly shaped by ongoing innovation in material science, particularly in the development of more sustainable and high-performance biodegradable options. Strategic alliances and acquisitions will continue to play a crucial role in market consolidation and expanding geographical reach. Furthermore, the increasing implementation of digital technologies for waste tracking and management presents a significant opportunity for integrated solutions, offering enhanced efficiency and transparency for stakeholders across the value chain.
Biological Waste Bag Segmentation
-
1. Application
- 1.1. Chemical Plant
- 1.2. Hospital
- 1.3. Laboratory
- 1.4. Others
-
2. Type
- 2.1. Yellow
- 2.2. Red
- 2.3. Others
Biological Waste Bag Segmentation By Geography
-
1. North America
- 1.1. United States
- 1.2. Canada
- 1.3. Mexico
-
2. South America
- 2.1. Brazil
- 2.2. Argentina
- 2.3. Rest of South America
-
3. Europe
- 3.1. United Kingdom
- 3.2. Germany
- 3.3. France
- 3.4. Italy
- 3.5. Spain
- 3.6. Russia
- 3.7. Benelux
- 3.8. Nordics
- 3.9. Rest of Europe
-
4. Middle East & Africa
- 4.1. Turkey
- 4.2. Israel
- 4.3. GCC
- 4.4. North Africa
- 4.5. South Africa
- 4.6. Rest of Middle East & Africa
-
5. Asia Pacific
- 5.1. China
- 5.2. India
- 5.3. Japan
- 5.4. South Korea
- 5.5. ASEAN
- 5.6. Oceania
- 5.7. Rest of Asia Pacific
Biological Waste Bag Regional Market Share
Geographic Coverage of Biological Waste Bag
Biological Waste Bag REPORT HIGHLIGHTS
| Aspects | Details |
|---|---|
| Study Period | 2020-2034 |
| Base Year | 2025 |
| Estimated Year | 2026 |
| Forecast Period | 2026-2034 |
| Historical Period | 2020-2025 |
| Growth Rate | CAGR of 9.05% from 2020-2034 |
| Segmentation |
|
Table of Contents
- 1. Introduction
- 1.1. Research Scope
- 1.2. Market Segmentation
- 1.3. Research Methodology
- 1.4. Definitions and Assumptions
- 2. Executive Summary
- 2.1. Introduction
- 3. Market Dynamics
- 3.1. Introduction
- 3.2. Market Drivers
- 3.3. Market Restrains
- 3.4. Market Trends
- 4. Market Factor Analysis
- 4.1. Porters Five Forces
- 4.2. Supply/Value Chain
- 4.3. PESTEL analysis
- 4.4. Market Entropy
- 4.5. Patent/Trademark Analysis
- 5. Global Biological Waste Bag Analysis, Insights and Forecast, 2020-2032
- 5.1. Market Analysis, Insights and Forecast - by Application
- 5.1.1. Chemical Plant
- 5.1.2. Hospital
- 5.1.3. Laboratory
- 5.1.4. Others
- 5.2. Market Analysis, Insights and Forecast - by Type
- 5.2.1. Yellow
- 5.2.2. Red
- 5.2.3. Others
- 5.3. Market Analysis, Insights and Forecast - by Region
- 5.3.1. North America
- 5.3.2. South America
- 5.3.3. Europe
- 5.3.4. Middle East & Africa
- 5.3.5. Asia Pacific
- 5.1. Market Analysis, Insights and Forecast - by Application
- 6. North America Biological Waste Bag Analysis, Insights and Forecast, 2020-2032
- 6.1. Market Analysis, Insights and Forecast - by Application
- 6.1.1. Chemical Plant
- 6.1.2. Hospital
- 6.1.3. Laboratory
- 6.1.4. Others
- 6.2. Market Analysis, Insights and Forecast - by Type
- 6.2.1. Yellow
- 6.2.2. Red
- 6.2.3. Others
- 6.1. Market Analysis, Insights and Forecast - by Application
- 7. South America Biological Waste Bag Analysis, Insights and Forecast, 2020-2032
- 7.1. Market Analysis, Insights and Forecast - by Application
- 7.1.1. Chemical Plant
- 7.1.2. Hospital
- 7.1.3. Laboratory
- 7.1.4. Others
- 7.2. Market Analysis, Insights and Forecast - by Type
- 7.2.1. Yellow
- 7.2.2. Red
- 7.2.3. Others
- 7.1. Market Analysis, Insights and Forecast - by Application
- 8. Europe Biological Waste Bag Analysis, Insights and Forecast, 2020-2032
- 8.1. Market Analysis, Insights and Forecast - by Application
- 8.1.1. Chemical Plant
- 8.1.2. Hospital
- 8.1.3. Laboratory
- 8.1.4. Others
- 8.2. Market Analysis, Insights and Forecast - by Type
- 8.2.1. Yellow
- 8.2.2. Red
- 8.2.3. Others
- 8.1. Market Analysis, Insights and Forecast - by Application
- 9. Middle East & Africa Biological Waste Bag Analysis, Insights and Forecast, 2020-2032
- 9.1. Market Analysis, Insights and Forecast - by Application
- 9.1.1. Chemical Plant
- 9.1.2. Hospital
- 9.1.3. Laboratory
- 9.1.4. Others
- 9.2. Market Analysis, Insights and Forecast - by Type
- 9.2.1. Yellow
- 9.2.2. Red
- 9.2.3. Others
- 9.1. Market Analysis, Insights and Forecast - by Application
- 10. Asia Pacific Biological Waste Bag Analysis, Insights and Forecast, 2020-2032
- 10.1. Market Analysis, Insights and Forecast - by Application
- 10.1.1. Chemical Plant
- 10.1.2. Hospital
- 10.1.3. Laboratory
- 10.1.4. Others
- 10.2. Market Analysis, Insights and Forecast - by Type
- 10.2.1. Yellow
- 10.2.2. Red
- 10.2.3. Others
- 10.1. Market Analysis, Insights and Forecast - by Application
- 11. Competitive Analysis
- 11.1. Global Market Share Analysis 2025
- 11.2. Company Profiles
- 11.2.1 Inteplast Group
- 11.2.1.1. Overview
- 11.2.1.2. Products
- 11.2.1.3. SWOT Analysis
- 11.2.1.4. Recent Developments
- 11.2.1.5. Financials (Based on Availability)
- 11.2.2 Cromwell Polythene
- 11.2.2.1. Overview
- 11.2.2.2. Products
- 11.2.2.3. SWOT Analysis
- 11.2.2.4. Recent Developments
- 11.2.2.5. Financials (Based on Availability)
- 11.2.3 Thermo Fisher Scientific
- 11.2.3.1. Overview
- 11.2.3.2. Products
- 11.2.3.3. SWOT Analysis
- 11.2.3.4. Recent Developments
- 11.2.3.5. Financials (Based on Availability)
- 11.2.4 Medline Industries
- 11.2.4.1. Overview
- 11.2.4.2. Products
- 11.2.4.3. SWOT Analysis
- 11.2.4.4. Recent Developments
- 11.2.4.5. Financials (Based on Availability)
- 11.2.5 Stericycle
- 11.2.5.1. Overview
- 11.2.5.2. Products
- 11.2.5.3. SWOT Analysis
- 11.2.5.4. Recent Developments
- 11.2.5.5. Financials (Based on Availability)
- 11.2.6 Seroat International Inc
- 11.2.6.1. Overview
- 11.2.6.2. Products
- 11.2.6.3. SWOT Analysis
- 11.2.6.4. Recent Developments
- 11.2.6.5. Financials (Based on Availability)
- 11.2.7 Rumoma Industries
- 11.2.7.1. Overview
- 11.2.7.2. Products
- 11.2.7.3. SWOT Analysis
- 11.2.7.4. Recent Developments
- 11.2.7.5. Financials (Based on Availability)
- 11.2.8 Lithey
- 11.2.8.1. Overview
- 11.2.8.2. Products
- 11.2.8.3. SWOT Analysis
- 11.2.8.4. Recent Developments
- 11.2.8.5. Financials (Based on Availability)
- 11.2.9 Alte-Rego
- 11.2.9.1. Overview
- 11.2.9.2. Products
- 11.2.9.3. SWOT Analysis
- 11.2.9.4. Recent Developments
- 11.2.9.5. Financials (Based on Availability)
- 11.2.10 Novolex
- 11.2.10.1. Overview
- 11.2.10.2. Products
- 11.2.10.3. SWOT Analysis
- 11.2.10.4. Recent Developments
- 11.2.10.5. Financials (Based on Availability)
- 11.2.11 Bel-Art Products
- 11.2.11.1. Overview
- 11.2.11.2. Products
- 11.2.11.3. SWOT Analysis
- 11.2.11.4. Recent Developments
- 11.2.11.5. Financials (Based on Availability)
- 11.2.12 Plascon Group
- 11.2.12.1. Overview
- 11.2.12.2. Products
- 11.2.12.3. SWOT Analysis
- 11.2.12.4. Recent Developments
- 11.2.12.5. Financials (Based on Availability)
- 11.2.13 Universal Plastic Bag Co
- 11.2.13.1. Overview
- 11.2.13.2. Products
- 11.2.13.3. SWOT Analysis
- 11.2.13.4. Recent Developments
- 11.2.13.5. Financials (Based on Availability)
- 11.2.14 Justrite
- 11.2.14.1. Overview
- 11.2.14.2. Products
- 11.2.14.3. SWOT Analysis
- 11.2.14.4. Recent Developments
- 11.2.14.5. Financials (Based on Availability)
- 11.2.15 bagbarn.com
- 11.2.15.1. Overview
- 11.2.15.2. Products
- 11.2.15.3. SWOT Analysis
- 11.2.15.4. Recent Developments
- 11.2.15.5. Financials (Based on Availability)
- 11.2.16 Maco PKG
- 11.2.16.1. Overview
- 11.2.16.2. Products
- 11.2.16.3. SWOT Analysis
- 11.2.16.4. Recent Developments
- 11.2.16.5. Financials (Based on Availability)
- 11.2.17 C-P Flexible Packaging
- 11.2.17.1. Overview
- 11.2.17.2. Products
- 11.2.17.3. SWOT Analysis
- 11.2.17.4. Recent Developments
- 11.2.17.5. Financials (Based on Availability)
- 11.2.18 Envision
- 11.2.18.1. Overview
- 11.2.18.2. Products
- 11.2.18.3. SWOT Analysis
- 11.2.18.4. Recent Developments
- 11.2.18.5. Financials (Based on Availability)
- 11.2.19 New York Packaging Corp
- 11.2.19.1. Overview
- 11.2.19.2. Products
- 11.2.19.3. SWOT Analysis
- 11.2.19.4. Recent Developments
- 11.2.19.5. Financials (Based on Availability)
- 11.2.20 Vonco Products Inc
- 11.2.20.1. Overview
- 11.2.20.2. Products
- 11.2.20.3. SWOT Analysis
- 11.2.20.4. Recent Developments
- 11.2.20.5. Financials (Based on Availability)
- 11.2.21 Inmark
- 11.2.21.1. Overview
- 11.2.21.2. Products
- 11.2.21.3. SWOT Analysis
- 11.2.21.4. Recent Developments
- 11.2.21.5. Financials (Based on Availability)
- 11.2.22 Elkay Plastics Co. Inc
- 11.2.22.1. Overview
- 11.2.22.2. Products
- 11.2.22.3. SWOT Analysis
- 11.2.22.4. Recent Developments
- 11.2.22.5. Financials (Based on Availability)
- 11.2.23 Carolina CoverTech
- 11.2.23.1. Overview
- 11.2.23.2. Products
- 11.2.23.3. SWOT Analysis
- 11.2.23.4. Recent Developments
- 11.2.23.5. Financials (Based on Availability)
- 11.2.24 Medegen Medical Products
- 11.2.24.1. Overview
- 11.2.24.2. Products
- 11.2.24.3. SWOT Analysis
- 11.2.24.4. Recent Developments
- 11.2.24.5. Financials (Based on Availability)
- 11.2.25 Excellent Poly Inc
- 11.2.25.1. Overview
- 11.2.25.2. Products
- 11.2.25.3. SWOT Analysis
- 11.2.25.4. Recent Developments
- 11.2.25.5. Financials (Based on Availability)
- 11.2.26 SupplyOne Inc
- 11.2.26.1. Overview
- 11.2.26.2. Products
- 11.2.26.3. SWOT Analysis
- 11.2.26.4. Recent Developments
- 11.2.26.5. Financials (Based on Availability)
- 11.2.27 Weifang Lifuyuan Packaging Products Co. Ltd.
- 11.2.27.1. Overview
- 11.2.27.2. Products
- 11.2.27.3. SWOT Analysis
- 11.2.27.4. Recent Developments
- 11.2.27.5. Financials (Based on Availability)
- 11.2.28 Zhejiang Tailin Biotechnology Co. Ltd.
- 11.2.28.1. Overview
- 11.2.28.2. Products
- 11.2.28.3. SWOT Analysis
- 11.2.28.4. Recent Developments
- 11.2.28.5. Financials (Based on Availability)
- 11.2.29 Anhui Jiesuri Industrial Equipment Co. Ltd.
- 11.2.29.1. Overview
- 11.2.29.2. Products
- 11.2.29.3. SWOT Analysis
- 11.2.29.4. Recent Developments
- 11.2.29.5. Financials (Based on Availability)
- 11.2.1 Inteplast Group
List of Figures
- Figure 1: Global Biological Waste Bag Revenue Breakdown (billion, %) by Region 2025 & 2033
- Figure 2: North America Biological Waste Bag Revenue (billion), by Application 2025 & 2033
- Figure 3: North America Biological Waste Bag Revenue Share (%), by Application 2025 & 2033
- Figure 4: North America Biological Waste Bag Revenue (billion), by Type 2025 & 2033
- Figure 5: North America Biological Waste Bag Revenue Share (%), by Type 2025 & 2033
- Figure 6: North America Biological Waste Bag Revenue (billion), by Country 2025 & 2033
- Figure 7: North America Biological Waste Bag Revenue Share (%), by Country 2025 & 2033
- Figure 8: South America Biological Waste Bag Revenue (billion), by Application 2025 & 2033
- Figure 9: South America Biological Waste Bag Revenue Share (%), by Application 2025 & 2033
- Figure 10: South America Biological Waste Bag Revenue (billion), by Type 2025 & 2033
- Figure 11: South America Biological Waste Bag Revenue Share (%), by Type 2025 & 2033
- Figure 12: South America Biological Waste Bag Revenue (billion), by Country 2025 & 2033
- Figure 13: South America Biological Waste Bag Revenue Share (%), by Country 2025 & 2033
- Figure 14: Europe Biological Waste Bag Revenue (billion), by Application 2025 & 2033
- Figure 15: Europe Biological Waste Bag Revenue Share (%), by Application 2025 & 2033
- Figure 16: Europe Biological Waste Bag Revenue (billion), by Type 2025 & 2033
- Figure 17: Europe Biological Waste Bag Revenue Share (%), by Type 2025 & 2033
- Figure 18: Europe Biological Waste Bag Revenue (billion), by Country 2025 & 2033
- Figure 19: Europe Biological Waste Bag Revenue Share (%), by Country 2025 & 2033
- Figure 20: Middle East & Africa Biological Waste Bag Revenue (billion), by Application 2025 & 2033
- Figure 21: Middle East & Africa Biological Waste Bag Revenue Share (%), by Application 2025 & 2033
- Figure 22: Middle East & Africa Biological Waste Bag Revenue (billion), by Type 2025 & 2033
- Figure 23: Middle East & Africa Biological Waste Bag Revenue Share (%), by Type 2025 & 2033
- Figure 24: Middle East & Africa Biological Waste Bag Revenue (billion), by Country 2025 & 2033
- Figure 25: Middle East & Africa Biological Waste Bag Revenue Share (%), by Country 2025 & 2033
- Figure 26: Asia Pacific Biological Waste Bag Revenue (billion), by Application 2025 & 2033
- Figure 27: Asia Pacific Biological Waste Bag Revenue Share (%), by Application 2025 & 2033
- Figure 28: Asia Pacific Biological Waste Bag Revenue (billion), by Type 2025 & 2033
- Figure 29: Asia Pacific Biological Waste Bag Revenue Share (%), by Type 2025 & 2033
- Figure 30: Asia Pacific Biological Waste Bag Revenue (billion), by Country 2025 & 2033
- Figure 31: Asia Pacific Biological Waste Bag Revenue Share (%), by Country 2025 & 2033
List of Tables
- Table 1: Global Biological Waste Bag Revenue billion Forecast, by Application 2020 & 2033
- Table 2: Global Biological Waste Bag Revenue billion Forecast, by Type 2020 & 2033
- Table 3: Global Biological Waste Bag Revenue billion Forecast, by Region 2020 & 2033
- Table 4: Global Biological Waste Bag Revenue billion Forecast, by Application 2020 & 2033
- Table 5: Global Biological Waste Bag Revenue billion Forecast, by Type 2020 & 2033
- Table 6: Global Biological Waste Bag Revenue billion Forecast, by Country 2020 & 2033
- Table 7: United States Biological Waste Bag Revenue (billion) Forecast, by Application 2020 & 2033
- Table 8: Canada Biological Waste Bag Revenue (billion) Forecast, by Application 2020 & 2033
- Table 9: Mexico Biological Waste Bag Revenue (billion) Forecast, by Application 2020 & 2033
- Table 10: Global Biological Waste Bag Revenue billion Forecast, by Application 2020 & 2033
- Table 11: Global Biological Waste Bag Revenue billion Forecast, by Type 2020 & 2033
- Table 12: Global Biological Waste Bag Revenue billion Forecast, by Country 2020 & 2033
- Table 13: Brazil Biological Waste Bag Revenue (billion) Forecast, by Application 2020 & 2033
- Table 14: Argentina Biological Waste Bag Revenue (billion) Forecast, by Application 2020 & 2033
- Table 15: Rest of South America Biological Waste Bag Revenue (billion) Forecast, by Application 2020 & 2033
- Table 16: Global Biological Waste Bag Revenue billion Forecast, by Application 2020 & 2033
- Table 17: Global Biological Waste Bag Revenue billion Forecast, by Type 2020 & 2033
- Table 18: Global Biological Waste Bag Revenue billion Forecast, by Country 2020 & 2033
- Table 19: United Kingdom Biological Waste Bag Revenue (billion) Forecast, by Application 2020 & 2033
- Table 20: Germany Biological Waste Bag Revenue (billion) Forecast, by Application 2020 & 2033
- Table 21: France Biological Waste Bag Revenue (billion) Forecast, by Application 2020 & 2033
- Table 22: Italy Biological Waste Bag Revenue (billion) Forecast, by Application 2020 & 2033
- Table 23: Spain Biological Waste Bag Revenue (billion) Forecast, by Application 2020 & 2033
- Table 24: Russia Biological Waste Bag Revenue (billion) Forecast, by Application 2020 & 2033
- Table 25: Benelux Biological Waste Bag Revenue (billion) Forecast, by Application 2020 & 2033
- Table 26: Nordics Biological Waste Bag Revenue (billion) Forecast, by Application 2020 & 2033
- Table 27: Rest of Europe Biological Waste Bag Revenue (billion) Forecast, by Application 2020 & 2033
- Table 28: Global Biological Waste Bag Revenue billion Forecast, by Application 2020 & 2033
- Table 29: Global Biological Waste Bag Revenue billion Forecast, by Type 2020 & 2033
- Table 30: Global Biological Waste Bag Revenue billion Forecast, by Country 2020 & 2033
- Table 31: Turkey Biological Waste Bag Revenue (billion) Forecast, by Application 2020 & 2033
- Table 32: Israel Biological Waste Bag Revenue (billion) Forecast, by Application 2020 & 2033
- Table 33: GCC Biological Waste Bag Revenue (billion) Forecast, by Application 2020 & 2033
- Table 34: North Africa Biological Waste Bag Revenue (billion) Forecast, by Application 2020 & 2033
- Table 35: South Africa Biological Waste Bag Revenue (billion) Forecast, by Application 2020 & 2033
- Table 36: Rest of Middle East & Africa Biological Waste Bag Revenue (billion) Forecast, by Application 2020 & 2033
- Table 37: Global Biological Waste Bag Revenue billion Forecast, by Application 2020 & 2033
- Table 38: Global Biological Waste Bag Revenue billion Forecast, by Type 2020 & 2033
- Table 39: Global Biological Waste Bag Revenue billion Forecast, by Country 2020 & 2033
- Table 40: China Biological Waste Bag Revenue (billion) Forecast, by Application 2020 & 2033
- Table 41: India Biological Waste Bag Revenue (billion) Forecast, by Application 2020 & 2033
- Table 42: Japan Biological Waste Bag Revenue (billion) Forecast, by Application 2020 & 2033
- Table 43: South Korea Biological Waste Bag Revenue (billion) Forecast, by Application 2020 & 2033
- Table 44: ASEAN Biological Waste Bag Revenue (billion) Forecast, by Application 2020 & 2033
- Table 45: Oceania Biological Waste Bag Revenue (billion) Forecast, by Application 2020 & 2033
- Table 46: Rest of Asia Pacific Biological Waste Bag Revenue (billion) Forecast, by Application 2020 & 2033
Frequently Asked Questions
1. What is the projected Compound Annual Growth Rate (CAGR) of the Biological Waste Bag?
The projected CAGR is approximately 9.05%.
2. Which companies are prominent players in the Biological Waste Bag?
Key companies in the market include Inteplast Group, Cromwell Polythene, Thermo Fisher Scientific, Medline Industries, Stericycle, Seroat International Inc, Rumoma Industries, Lithey, Alte-Rego, Novolex, Bel-Art Products, Plascon Group, Universal Plastic Bag Co, Justrite, bagbarn.com, Maco PKG, C-P Flexible Packaging, Envision, New York Packaging Corp, Vonco Products, Inc, Inmark, Elkay Plastics Co., Inc, Carolina CoverTech, Medegen Medical Products, Excellent Poly, Inc, SupplyOne, Inc, Weifang Lifuyuan Packaging Products Co., Ltd., Zhejiang Tailin Biotechnology Co., Ltd., Anhui Jiesuri Industrial Equipment Co., Ltd..
3. What are the main segments of the Biological Waste Bag?
The market segments include Application, Type.
4. Can you provide details about the market size?
The market size is estimated to be USD 13.56 billion as of 2022.
5. What are some drivers contributing to market growth?
N/A
6. What are the notable trends driving market growth?
N/A
7. Are there any restraints impacting market growth?
N/A
8. Can you provide examples of recent developments in the market?
N/A
9. What pricing options are available for accessing the report?
Pricing options include single-user, multi-user, and enterprise licenses priced at USD 2900.00, USD 4350.00, and USD 5800.00 respectively.
10. Is the market size provided in terms of value or volume?
The market size is provided in terms of value, measured in billion.
11. Are there any specific market keywords associated with the report?
Yes, the market keyword associated with the report is "Biological Waste Bag," which aids in identifying and referencing the specific market segment covered.
12. How do I determine which pricing option suits my needs best?
The pricing options vary based on user requirements and access needs. Individual users may opt for single-user licenses, while businesses requiring broader access may choose multi-user or enterprise licenses for cost-effective access to the report.
13. Are there any additional resources or data provided in the Biological Waste Bag report?
While the report offers comprehensive insights, it's advisable to review the specific contents or supplementary materials provided to ascertain if additional resources or data are available.
14. How can I stay updated on further developments or reports in the Biological Waste Bag?
To stay informed about further developments, trends, and reports in the Biological Waste Bag, consider subscribing to industry newsletters, following relevant companies and organizations, or regularly checking reputable industry news sources and publications.
Methodology
Step 1 - Identification of Relevant Samples Size from Population Database


Step 2 - Approaches for Defining Global Market Size (Value, Volume* & Price*)

Note*: In applicable scenarios
Step 3 - Data Sources
Primary Research
- Web Analytics
- Survey Reports
- Research Institute
- Latest Research Reports
- Opinion Leaders
Secondary Research
- Annual Reports
- White Paper
- Latest Press Release
- Industry Association
- Paid Database
- Investor Presentations

Step 4 - Data Triangulation
Involves using different sources of information in order to increase the validity of a study
These sources are likely to be stakeholders in a program - participants, other researchers, program staff, other community members, and so on.
Then we put all data in single framework & apply various statistical tools to find out the dynamic on the market.
During the analysis stage, feedback from the stakeholder groups would be compared to determine areas of agreement as well as areas of divergence