

Key Insights
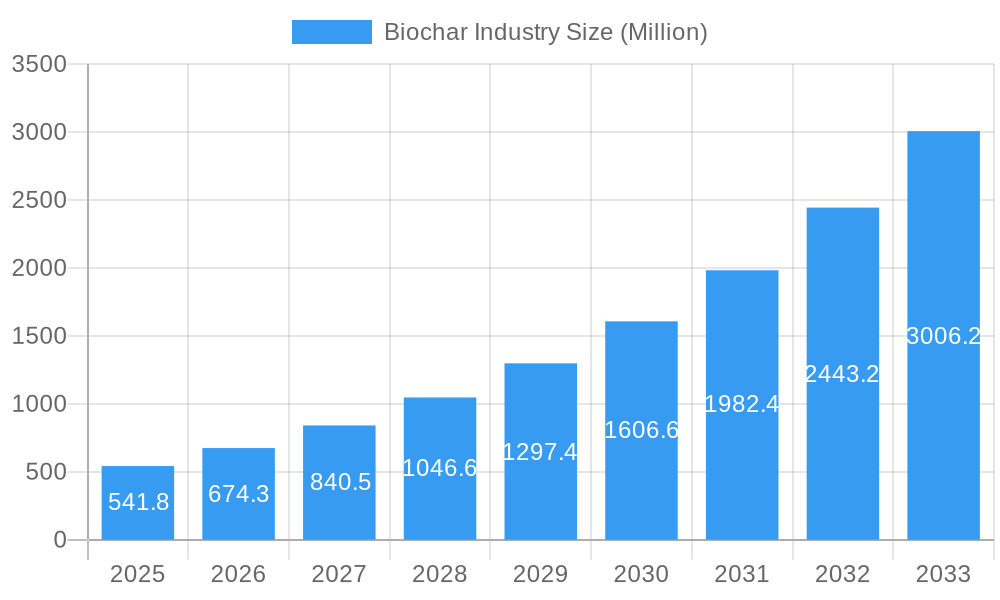
The biochar industry is experiencing rapid growth, projected to reach a market size of $541.8 million in 2025 and exhibiting a Compound Annual Growth Rate (CAGR) exceeding 24.50%. This robust expansion is fueled by several key drivers. Increasing concerns about climate change and the need for sustainable soil improvement are driving demand for biochar as a carbon sequestration agent and soil amendment. The agricultural sector is a major adopter, utilizing biochar to enhance soil fertility, water retention, and crop yields. Furthermore, the burgeoning animal farming industry is employing biochar for odor control and improved livestock health. Industrial applications, including its use in wastewater treatment and as a component in various materials, are also contributing to market growth. Technological advancements in pyrolysis and gasification systems are improving biochar production efficiency and reducing costs, further stimulating market expansion. However, the industry faces challenges such as high initial investment costs for production facilities and the need for standardized quality control measures. The geographical distribution of the market is diverse, with North America, Europe, and Asia-Pacific representing significant regions of growth. The competitive landscape is dynamic, featuring both established players and emerging companies focused on innovative production technologies and applications.

Biochar Industry Market Size (In Million)
The forecast period of 2025-2033 anticipates continued strong growth, driven by increased awareness of biochar's environmental benefits and technological innovation leading to more cost-effective production methods. Expanding applications into diverse industrial segments, such as biofuel production and construction materials, will also contribute to market expansion. Geographic expansion into developing economies with large agricultural sectors presents considerable untapped potential. However, challenges related to consistent regulatory frameworks and public awareness regarding biochar's benefits will require careful navigation to achieve sustained growth. Future success hinges on the industry's ability to effectively address these challenges and capitalize on the opportunities presented by a growing global focus on sustainability and environmental remediation.
Biochar Industry Company Market Share
Biochar Industry Market Report: 2019-2033 - A Comprehensive Analysis
This comprehensive report provides a detailed analysis of the Biochar Industry, projecting a market valuation exceeding $XX Million by 2033. The study period covers 2019-2033, with a base year of 2025 and a forecast period of 2025-2033. This in-depth analysis is crucial for industry stakeholders, investors, and researchers seeking actionable insights into this rapidly expanding market. Leveraging extensive data analysis, we uncover key trends, challenges, and opportunities for growth.
Biochar Industry Market Dynamics & Concentration
The global biochar industry, projected to reach a valuation of $XXX Million by 2028, exhibits a moderately concentrated market structure. While established industry leaders hold significant market share, a dynamic ecosystem of innovative smaller companies and agile startups is continuously pushing the boundaries of this burgeoning sector. The estimated market share of the top five players stands at approximately XX% in 2028, signaling ample room for both strategic consolidation and the emergence of disruptive new entrants.
Key Market Concentration Metrics:
- Top 5 Players Market Share: XX% (2028 projection)
- Estimated Number of Mergers & Acquisitions (2020-2025): XX
Catalysts for Innovation:
- Significant advancements in the efficiency and scalability of pyrolysis and gasification technologies, enabling more cost-effective production.
- Escalating global demand for sustainable agricultural inputs and robust carbon sequestration solutions to combat climate change.
- Increasingly stringent government regulations and ambitious carbon neutrality targets worldwide, creating a favorable policy environment.
Navigating the Regulatory Landscape:
- A complex and evolving tapestry of national and regional policies significantly influences market expansion and investment.
- The burgeoning carbon credit markets present both substantial opportunities for revenue generation and intricate challenges in accreditation and verification.
Competitive Landscape & Substitutes:
- Traditional soil amendments, while established, face increasing competition from biochar's superior and multi-faceted benefits.
- Emerging carbon sequestration technologies, such as direct air capture, are also vying for investment and market attention, underscoring the need for biochar to highlight its unique value proposition.
Evolving End-User Demands:
- A marked surge in adoption within the agricultural sector, primarily driven by demonstrably improved soil health, enhanced crop yields, and reduced fertilizer dependency.
- Growing interest from industrial sectors for applications in advanced water purification, stormwater management, and materials science.
Strategic M&A Activity: The biochar industry has witnessed a discernible uptick in merger and acquisition activities in recent years. This trend underscores a strategic drive towards industry consolidation, enabling companies to achieve greater scale, enhance technological capabilities, and secure broader market reach. The forecast period anticipates a continued rise in M&A deals as companies aim to capitalize on economies of scale and solidify their competitive positions.
Biochar Industry Industry Trends & Analysis
The Biochar market exhibits a robust Compound Annual Growth Rate (CAGR) of XX% during the forecast period (2025-2033). This growth is propelled by several key factors, including increasing awareness of biochar's environmental benefits and its potential role in carbon sequestration. Market penetration in key applications, particularly agriculture, remains relatively low, indicating significant untapped potential for expansion.
- Market Size (2025): $XX Million
- Projected Market Size (2033): $XX Million
- CAGR (2025-2033): XX%
Technological advancements, such as improvements in pyrolysis and gasification systems, are continuously driving down production costs and increasing efficiency. Consumer preferences are shifting towards environmentally sustainable products, further boosting the demand for biochar. Intense competition among market players is fostering innovation and driving down prices, making biochar more accessible to a wider range of consumers.
Leading Markets & Segments in Biochar Industry
The agricultural sector stands as the undisputed leader within the biochar market, commanding an estimated XX% of the total market value in 2028. This dominance is propelled by the widespread recognition of biochar's capacity to foster sustainable agricultural practices, dramatically improve soil structure and fertility, and ultimately boost crop yields. In terms of production technology, pyrolysis continues to lead, owing to its established maturity, inherent cost-effectiveness, and broad applicability across various feedstock sources. Geographically, North America and Europe are currently at the forefront of biochar adoption, buoyed by supportive governmental policies, robust environmental regulations, and a highly aware consumer base.
Key Drivers Propelling the Agricultural Segment:
- Heightened global awareness of biochar's profound benefits for soil health, nutrient retention, and water management.
- Governmental incentives and subsidies encouraging the adoption of sustainable and climate-resilient agricultural practices.
- A sustained and growing demand for high-quality, sustainably produced agricultural products.
Key Drivers Favoring Pyrolysis Technology:
- A well-established and proven technology with a track record of reliable performance.
- Generally lower capital investment requirements compared to more nascent production methods.
- Exceptional versatility in feedstock utilization and inherent scalability to meet diverse production demands.
Geographic Market Dominance and Growth Potential: North America and Europe currently hold the largest market shares due to their advanced infrastructure, supportive regulatory environments, and a strong public commitment to environmental sustainability. However, the Asia-Pacific region is poised for rapid growth, driven by increasing agricultural demands, a burgeoning awareness of environmental challenges, and significant investments in sustainable technologies.
Biochar Industry Product Developments
Recent innovations in the biochar sector are centered on enhancing the efficiency and economic viability of pyrolysis and gasification processes, leading to more cost-effective and scalable biochar production. A significant focus is also being placed on the development of novel applications across diverse sectors, including advanced water treatment solutions and specialized industrial processes. The key to achieving competitive advantage lies in the ability to produce high-quality biochar with precisely tailored properties optimized for specific end-use applications, coupled with sustainable and economically sound production methodologies. Market acceptance and success are ultimately dictated by a product's cost-effectiveness, its demonstrable environmental benefits, and its tangible value proposition for the targeted application.
Key Drivers of Biochar Industry Growth
The Biochar industry's growth is driven by several factors:
- Technological advancements: Improved pyrolysis and gasification systems lower production costs and enhance efficiency.
- Economic incentives: Government subsidies and carbon credit markets encourage biochar adoption.
- Regulatory frameworks: Stricter environmental regulations mandate sustainable solutions, increasing biochar's appeal.
Challenges in the Biochar Industry Market
Challenges facing the industry include:
- High initial investment costs for biochar production facilities.
- Inconsistent product quality due to variations in feedstock and production processes.
- Lack of standardized quality control measures, hindering widespread acceptance and market trust.
- Limited public awareness of biochar's benefits.
Emerging Opportunities in Biochar Industry
The future trajectory of the biochar industry is exceptionally promising, fueled by significant technological breakthroughs in carbon capture and utilization (CCU), the rapid expansion of credible carbon credit markets, and a growing global consensus on biochar's crucial role in mitigating climate change impacts. The establishment of strategic collaborations between biochar producers, agricultural enterprises, and carbon offset developers is set to be a pivotal factor in accelerating market expansion and fostering widespread adoption across various industries.
Leading Players in the Biochar Industry Sector
- Arsta Eco
- Biochar Industries
- Diacarbon Energy Inc
- Biochar Now LLC
- Swiss Biochar
- PyroCore
- Sunriver Biochar
- Airex Energy
- Phoenix Energy
- Karr Group
- Wonjin Group
- Carbon Gold Ltd
- Biochar Supreme
- BIOSORRA
- Pyreg GmbH
Key Milestones in Biochar Industry Industry
- November 2023: BIOSORRA launched a biochar production plant in Kenya, supplying biochar to Kenya Nut Company. This significantly expands the market reach of biochar in East Africa.
- November 2023: Pyreg GmbH launched its Biochar Carbon Removal (BCR) program, accelerating biochar adoption in agriculture through its Climate Finance Solutions (PCFS). This initiative is expected to drive significant growth in the agricultural sector.
- June 2022: Airex Energy's partnership with the BDO Zone Strategic Alliance enhances its market position and de-risks biobased project development. This partnership provides access to key industry players and promotes wider adoption of Airex Energy's technologies.
Strategic Outlook for Biochar Industry Market
The Biochar market is poised for substantial growth, driven by increasing demand for sustainable solutions and innovations in production technologies. Strategic partnerships, focused research and development, and government support will be crucial in unlocking the full potential of biochar. Expansion into new markets and applications will be key to maximizing the long-term growth of this promising sector.
Biochar Industry Segmentation
-
1. Technology
- 1.1. Pyrolysis
- 1.2. Gasification Systems
- 1.3. Other Technologies (Hydrothermal Carbonization)
-
2. Application
- 2.1. Agriculture
- 2.2. Animal Farming
- 2.3. Industrial Uses
- 2.4. Other Applications (Environmental Remediation)
Biochar Industry Segmentation By Geography
-
1. Asia Pacific
- 1.1. China
- 1.2. Australia
- 1.3. South Korea
- 1.4. Rest of Asia Pacific
-
2. North America
- 2.1. United States
- 2.2. Canada
-
3. Europe
- 3.1. Germany
- 3.2. Sweden
- 3.3. Austria
- 3.4. Switzerland
- 3.5. United Kingdom
- 3.6. Rest of Europe
- 4. Rest of the World
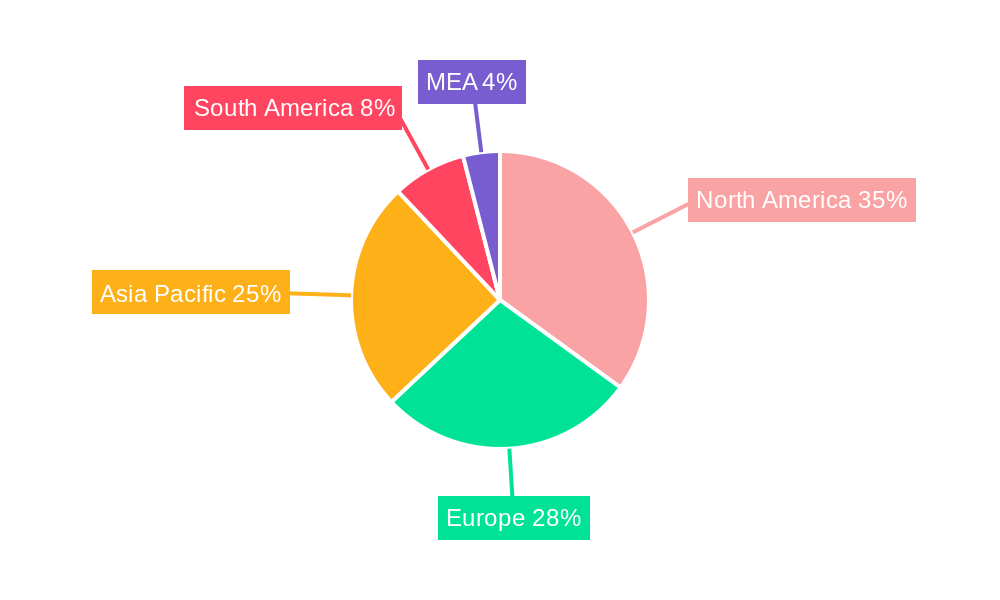
Biochar Industry Regional Market Share
Geographic Coverage of Biochar Industry
Biochar Industry REPORT HIGHLIGHTS
| Aspects | Details |
|---|---|
| Study Period | 2020-2034 |
| Base Year | 2025 |
| Estimated Year | 2026 |
| Forecast Period | 2026-2034 |
| Historical Period | 2020-2025 |
| Growth Rate | CAGR of > 24.50% from 2020-2034 |
| Segmentation |
|
Table of Contents
- 1. Introduction
- 1.1. Research Scope
- 1.2. Market Segmentation
- 1.3. Research Objective
- 1.4. Definitions and Assumptions
- 2. Executive Summary
- 2.1. Market Snapshot
- 3. Market Dynamics
- 3.1. Market Drivers
- 3.2. Market Restrains
- 3.3. Market Trends
- 3.4. Market Opportunities
- 4. Market Factor Analysis
- 4.1. Porters Five Forces
- 4.1.1. Bargaining Power of Suppliers
- 4.1.2. Bargaining Power of Buyers
- 4.1.3. Threat of New Entrants
- 4.1.4. Threat of Substitutes
- 4.1.5. Competitive Rivalry
- 4.2. PESTEL analysis
- 4.3. BCG Analysis
- 4.3.1. Stars (High Growth, High Market Share)
- 4.3.2. Cash Cows (Low Growth, High Market Share)
- 4.3.3. Question Mark (High Growth, Low Market Share)
- 4.3.4. Dogs (Low Growth, Low Market Share)
- 4.4. Ansoff Matrix Analysis
- 4.5. Supply Chain Analysis
- 4.6. Regulatory Landscape
- 4.7. Current Market Potential and Opportunity Assessment (TAM–SAM–SOM Framework)
- 4.8. MDP Analyst Note
- 4.1. Porters Five Forces
- 5. Market Analysis, Insights and Forecast 2021-2033
- 5.1. Market Analysis, Insights and Forecast - by Technology
- 5.1.1. Pyrolysis
- 5.1.2. Gasification Systems
- 5.1.3. Other Technologies (Hydrothermal Carbonization)
- 5.2. Market Analysis, Insights and Forecast - by Application
- 5.2.1. Agriculture
- 5.2.2. Animal Farming
- 5.2.3. Industrial Uses
- 5.2.4. Other Applications (Environmental Remediation)
- 5.3. Market Analysis, Insights and Forecast - by Region
- 5.3.1. Asia Pacific
- 5.3.2. North America
- 5.3.3. Europe
- 5.3.4. Rest of the World
- 5.1. Market Analysis, Insights and Forecast - by Technology
- 6. Global Biochar Industry Analysis, Insights and Forecast, 2021-2033
- 6.1. Market Analysis, Insights and Forecast - by Technology
- 6.1.1. Pyrolysis
- 6.1.2. Gasification Systems
- 6.1.3. Other Technologies (Hydrothermal Carbonization)
- 6.2. Market Analysis, Insights and Forecast - by Application
- 6.2.1. Agriculture
- 6.2.2. Animal Farming
- 6.2.3. Industrial Uses
- 6.2.4. Other Applications (Environmental Remediation)
- 6.1. Market Analysis, Insights and Forecast - by Technology
- 7. Asia Pacific Biochar Industry Analysis, Insights and Forecast, 2020-2032
- 7.1. Market Analysis, Insights and Forecast - by Technology
- 7.1.1. Pyrolysis
- 7.1.2. Gasification Systems
- 7.1.3. Other Technologies (Hydrothermal Carbonization)
- 7.2. Market Analysis, Insights and Forecast - by Application
- 7.2.1. Agriculture
- 7.2.2. Animal Farming
- 7.2.3. Industrial Uses
- 7.2.4. Other Applications (Environmental Remediation)
- 7.1. Market Analysis, Insights and Forecast - by Technology
- 8. North America Biochar Industry Analysis, Insights and Forecast, 2020-2032
- 8.1. Market Analysis, Insights and Forecast - by Technology
- 8.1.1. Pyrolysis
- 8.1.2. Gasification Systems
- 8.1.3. Other Technologies (Hydrothermal Carbonization)
- 8.2. Market Analysis, Insights and Forecast - by Application
- 8.2.1. Agriculture
- 8.2.2. Animal Farming
- 8.2.3. Industrial Uses
- 8.2.4. Other Applications (Environmental Remediation)
- 8.1. Market Analysis, Insights and Forecast - by Technology
- 9. Europe Biochar Industry Analysis, Insights and Forecast, 2020-2032
- 9.1. Market Analysis, Insights and Forecast - by Technology
- 9.1.1. Pyrolysis
- 9.1.2. Gasification Systems
- 9.1.3. Other Technologies (Hydrothermal Carbonization)
- 9.2. Market Analysis, Insights and Forecast - by Application
- 9.2.1. Agriculture
- 9.2.2. Animal Farming
- 9.2.3. Industrial Uses
- 9.2.4. Other Applications (Environmental Remediation)
- 9.1. Market Analysis, Insights and Forecast - by Technology
- 10. Rest of the World Biochar Industry Analysis, Insights and Forecast, 2020-2032
- 10.1. Market Analysis, Insights and Forecast - by Technology
- 10.1.1. Pyrolysis
- 10.1.2. Gasification Systems
- 10.1.3. Other Technologies (Hydrothermal Carbonization)
- 10.2. Market Analysis, Insights and Forecast - by Application
- 10.2.1. Agriculture
- 10.2.2. Animal Farming
- 10.2.3. Industrial Uses
- 10.2.4. Other Applications (Environmental Remediation)
- 10.1. Market Analysis, Insights and Forecast - by Technology
- 11. Competitive Analysis
- 11.1. Company Profiles
- 11.1.1 Arsta Eco
- 11.1.1.1. Company Overview
- 11.1.1.2. Products
- 11.1.1.3. Company Financials
- 11.1.1.4. SWOT Analysis
- 11.1.2 Biochar Industries
- 11.1.2.1. Company Overview
- 11.1.2.2. Products
- 11.1.2.3. Company Financials
- 11.1.2.4. SWOT Analysis
- 11.1.3 Diacarbon Energy Inc
- 11.1.3.1. Company Overview
- 11.1.3.2. Products
- 11.1.3.3. Company Financials
- 11.1.3.4. SWOT Analysis
- 11.1.4 Biochar Now LLC
- 11.1.4.1. Company Overview
- 11.1.4.2. Products
- 11.1.4.3. Company Financials
- 11.1.4.4. SWOT Analysis
- 11.1.5 Swiss Biochar
- 11.1.5.1. Company Overview
- 11.1.5.2. Products
- 11.1.5.3. Company Financials
- 11.1.5.4. SWOT Analysis
- 11.1.6 PyroCore
- 11.1.6.1. Company Overview
- 11.1.6.2. Products
- 11.1.6.3. Company Financials
- 11.1.6.4. SWOT Analysis
- 11.1.7 Sunriver Biochar
- 11.1.7.1. Company Overview
- 11.1.7.2. Products
- 11.1.7.3. Company Financials
- 11.1.7.4. SWOT Analysis
- 11.1.8 Airex Energy
- 11.1.8.1. Company Overview
- 11.1.8.2. Products
- 11.1.8.3. Company Financials
- 11.1.8.4. SWOT Analysis
- 11.1.9 Phoenix Energy
- 11.1.9.1. Company Overview
- 11.1.9.2. Products
- 11.1.9.3. Company Financials
- 11.1.9.4. SWOT Analysis
- 11.1.10 Karr Group
- 11.1.10.1. Company Overview
- 11.1.10.2. Products
- 11.1.10.3. Company Financials
- 11.1.10.4. SWOT Analysis
- 11.1.11 Wonjin Group*List Not Exhaustive
- 11.1.11.1. Company Overview
- 11.1.11.2. Products
- 11.1.11.3. Company Financials
- 11.1.11.4. SWOT Analysis
- 11.1.12 Carbon Gold Ltd
- 11.1.12.1. Company Overview
- 11.1.12.2. Products
- 11.1.12.3. Company Financials
- 11.1.12.4. SWOT Analysis
- 11.1.13 Biochar Supreme
- 11.1.13.1. Company Overview
- 11.1.13.2. Products
- 11.1.13.3. Company Financials
- 11.1.13.4. SWOT Analysis
- 11.1.14 BIOSORRA
- 11.1.14.1. Company Overview
- 11.1.14.2. Products
- 11.1.14.3. Company Financials
- 11.1.14.4. SWOT Analysis
- 11.1.15 Pyreg GmbH
- 11.1.15.1. Company Overview
- 11.1.15.2. Products
- 11.1.15.3. Company Financials
- 11.1.15.4. SWOT Analysis
- 11.1.1 Arsta Eco
- 11.2. Market Entropy
- 11.2.1 Company's Key Areas Served
- 11.2.2 Recent Developments
- 11.3. Company Market Share Analysis 2025
- 11.3.1 Top 5 Companies Market Share Analysis
- 11.3.2 Top 3 Companies Market Share Analysis
- 11.4. List of Potential Customers
- 12. Research Methodology
List of Figures
- Figure 1: Global Biochar Industry Revenue Breakdown (Million, %) by Region 2025 & 2033
- Figure 2: Global Biochar Industry Volume Breakdown (K Tons, %) by Region 2025 & 2033
- Figure 3: Asia Pacific Biochar Industry Revenue (Million), by Technology 2025 & 2033
- Figure 4: Asia Pacific Biochar Industry Volume (K Tons), by Technology 2025 & 2033
- Figure 5: Asia Pacific Biochar Industry Revenue Share (%), by Technology 2025 & 2033
- Figure 6: Asia Pacific Biochar Industry Volume Share (%), by Technology 2025 & 2033
- Figure 7: Asia Pacific Biochar Industry Revenue (Million), by Application 2025 & 2033
- Figure 8: Asia Pacific Biochar Industry Volume (K Tons), by Application 2025 & 2033
- Figure 9: Asia Pacific Biochar Industry Revenue Share (%), by Application 2025 & 2033
- Figure 10: Asia Pacific Biochar Industry Volume Share (%), by Application 2025 & 2033
- Figure 11: Asia Pacific Biochar Industry Revenue (Million), by Country 2025 & 2033
- Figure 12: Asia Pacific Biochar Industry Volume (K Tons), by Country 2025 & 2033
- Figure 13: Asia Pacific Biochar Industry Revenue Share (%), by Country 2025 & 2033
- Figure 14: Asia Pacific Biochar Industry Volume Share (%), by Country 2025 & 2033
- Figure 15: North America Biochar Industry Revenue (Million), by Technology 2025 & 2033
- Figure 16: North America Biochar Industry Volume (K Tons), by Technology 2025 & 2033
- Figure 17: North America Biochar Industry Revenue Share (%), by Technology 2025 & 2033
- Figure 18: North America Biochar Industry Volume Share (%), by Technology 2025 & 2033
- Figure 19: North America Biochar Industry Revenue (Million), by Application 2025 & 2033
- Figure 20: North America Biochar Industry Volume (K Tons), by Application 2025 & 2033
- Figure 21: North America Biochar Industry Revenue Share (%), by Application 2025 & 2033
- Figure 22: North America Biochar Industry Volume Share (%), by Application 2025 & 2033
- Figure 23: North America Biochar Industry Revenue (Million), by Country 2025 & 2033
- Figure 24: North America Biochar Industry Volume (K Tons), by Country 2025 & 2033
- Figure 25: North America Biochar Industry Revenue Share (%), by Country 2025 & 2033
- Figure 26: North America Biochar Industry Volume Share (%), by Country 2025 & 2033
- Figure 27: Europe Biochar Industry Revenue (Million), by Technology 2025 & 2033
- Figure 28: Europe Biochar Industry Volume (K Tons), by Technology 2025 & 2033
- Figure 29: Europe Biochar Industry Revenue Share (%), by Technology 2025 & 2033
- Figure 30: Europe Biochar Industry Volume Share (%), by Technology 2025 & 2033
- Figure 31: Europe Biochar Industry Revenue (Million), by Application 2025 & 2033
- Figure 32: Europe Biochar Industry Volume (K Tons), by Application 2025 & 2033
- Figure 33: Europe Biochar Industry Revenue Share (%), by Application 2025 & 2033
- Figure 34: Europe Biochar Industry Volume Share (%), by Application 2025 & 2033
- Figure 35: Europe Biochar Industry Revenue (Million), by Country 2025 & 2033
- Figure 36: Europe Biochar Industry Volume (K Tons), by Country 2025 & 2033
- Figure 37: Europe Biochar Industry Revenue Share (%), by Country 2025 & 2033
- Figure 38: Europe Biochar Industry Volume Share (%), by Country 2025 & 2033
- Figure 39: Rest of the World Biochar Industry Revenue (Million), by Technology 2025 & 2033
- Figure 40: Rest of the World Biochar Industry Volume (K Tons), by Technology 2025 & 2033
- Figure 41: Rest of the World Biochar Industry Revenue Share (%), by Technology 2025 & 2033
- Figure 42: Rest of the World Biochar Industry Volume Share (%), by Technology 2025 & 2033
- Figure 43: Rest of the World Biochar Industry Revenue (Million), by Application 2025 & 2033
- Figure 44: Rest of the World Biochar Industry Volume (K Tons), by Application 2025 & 2033
- Figure 45: Rest of the World Biochar Industry Revenue Share (%), by Application 2025 & 2033
- Figure 46: Rest of the World Biochar Industry Volume Share (%), by Application 2025 & 2033
- Figure 47: Rest of the World Biochar Industry Revenue (Million), by Country 2025 & 2033
- Figure 48: Rest of the World Biochar Industry Volume (K Tons), by Country 2025 & 2033
- Figure 49: Rest of the World Biochar Industry Revenue Share (%), by Country 2025 & 2033
- Figure 50: Rest of the World Biochar Industry Volume Share (%), by Country 2025 & 2033
List of Tables
- Table 1: Global Biochar Industry Revenue Million Forecast, by Technology 2020 & 2033
- Table 2: Global Biochar Industry Volume K Tons Forecast, by Technology 2020 & 2033
- Table 3: Global Biochar Industry Revenue Million Forecast, by Application 2020 & 2033
- Table 4: Global Biochar Industry Volume K Tons Forecast, by Application 2020 & 2033
- Table 5: Global Biochar Industry Revenue Million Forecast, by Region 2020 & 2033
- Table 6: Global Biochar Industry Volume K Tons Forecast, by Region 2020 & 2033
- Table 7: Global Biochar Industry Revenue Million Forecast, by Technology 2020 & 2033
- Table 8: Global Biochar Industry Volume K Tons Forecast, by Technology 2020 & 2033
- Table 9: Global Biochar Industry Revenue Million Forecast, by Application 2020 & 2033
- Table 10: Global Biochar Industry Volume K Tons Forecast, by Application 2020 & 2033
- Table 11: Global Biochar Industry Revenue Million Forecast, by Country 2020 & 2033
- Table 12: Global Biochar Industry Volume K Tons Forecast, by Country 2020 & 2033
- Table 13: China Biochar Industry Revenue (Million) Forecast, by Application 2020 & 2033
- Table 14: China Biochar Industry Volume (K Tons) Forecast, by Application 2020 & 2033
- Table 15: Australia Biochar Industry Revenue (Million) Forecast, by Application 2020 & 2033
- Table 16: Australia Biochar Industry Volume (K Tons) Forecast, by Application 2020 & 2033
- Table 17: South Korea Biochar Industry Revenue (Million) Forecast, by Application 2020 & 2033
- Table 18: South Korea Biochar Industry Volume (K Tons) Forecast, by Application 2020 & 2033
- Table 19: Rest of Asia Pacific Biochar Industry Revenue (Million) Forecast, by Application 2020 & 2033
- Table 20: Rest of Asia Pacific Biochar Industry Volume (K Tons) Forecast, by Application 2020 & 2033
- Table 21: Global Biochar Industry Revenue Million Forecast, by Technology 2020 & 2033
- Table 22: Global Biochar Industry Volume K Tons Forecast, by Technology 2020 & 2033
- Table 23: Global Biochar Industry Revenue Million Forecast, by Application 2020 & 2033
- Table 24: Global Biochar Industry Volume K Tons Forecast, by Application 2020 & 2033
- Table 25: Global Biochar Industry Revenue Million Forecast, by Country 2020 & 2033
- Table 26: Global Biochar Industry Volume K Tons Forecast, by Country 2020 & 2033
- Table 27: United States Biochar Industry Revenue (Million) Forecast, by Application 2020 & 2033
- Table 28: United States Biochar Industry Volume (K Tons) Forecast, by Application 2020 & 2033
- Table 29: Canada Biochar Industry Revenue (Million) Forecast, by Application 2020 & 2033
- Table 30: Canada Biochar Industry Volume (K Tons) Forecast, by Application 2020 & 2033
- Table 31: Global Biochar Industry Revenue Million Forecast, by Technology 2020 & 2033
- Table 32: Global Biochar Industry Volume K Tons Forecast, by Technology 2020 & 2033
- Table 33: Global Biochar Industry Revenue Million Forecast, by Application 2020 & 2033
- Table 34: Global Biochar Industry Volume K Tons Forecast, by Application 2020 & 2033
- Table 35: Global Biochar Industry Revenue Million Forecast, by Country 2020 & 2033
- Table 36: Global Biochar Industry Volume K Tons Forecast, by Country 2020 & 2033
- Table 37: Germany Biochar Industry Revenue (Million) Forecast, by Application 2020 & 2033
- Table 38: Germany Biochar Industry Volume (K Tons) Forecast, by Application 2020 & 2033
- Table 39: Sweden Biochar Industry Revenue (Million) Forecast, by Application 2020 & 2033
- Table 40: Sweden Biochar Industry Volume (K Tons) Forecast, by Application 2020 & 2033
- Table 41: Austria Biochar Industry Revenue (Million) Forecast, by Application 2020 & 2033
- Table 42: Austria Biochar Industry Volume (K Tons) Forecast, by Application 2020 & 2033
- Table 43: Switzerland Biochar Industry Revenue (Million) Forecast, by Application 2020 & 2033
- Table 44: Switzerland Biochar Industry Volume (K Tons) Forecast, by Application 2020 & 2033
- Table 45: United Kingdom Biochar Industry Revenue (Million) Forecast, by Application 2020 & 2033
- Table 46: United Kingdom Biochar Industry Volume (K Tons) Forecast, by Application 2020 & 2033
- Table 47: Rest of Europe Biochar Industry Revenue (Million) Forecast, by Application 2020 & 2033
- Table 48: Rest of Europe Biochar Industry Volume (K Tons) Forecast, by Application 2020 & 2033
- Table 49: Global Biochar Industry Revenue Million Forecast, by Technology 2020 & 2033
- Table 50: Global Biochar Industry Volume K Tons Forecast, by Technology 2020 & 2033
- Table 51: Global Biochar Industry Revenue Million Forecast, by Application 2020 & 2033
- Table 52: Global Biochar Industry Volume K Tons Forecast, by Application 2020 & 2033
- Table 53: Global Biochar Industry Revenue Million Forecast, by Country 2020 & 2033
- Table 54: Global Biochar Industry Volume K Tons Forecast, by Country 2020 & 2033
Frequently Asked Questions
1. What is the projected Compound Annual Growth Rate (CAGR) of the Biochar Industry?
The projected CAGR is approximately > 24.50%.
2. Which companies are prominent players in the Biochar Industry?
Key companies in the market include Arsta Eco, Biochar Industries, Diacarbon Energy Inc, Biochar Now LLC, Swiss Biochar, PyroCore, Sunriver Biochar, Airex Energy, Phoenix Energy, Karr Group, Wonjin Group*List Not Exhaustive, Carbon Gold Ltd, Biochar Supreme, BIOSORRA, Pyreg GmbH.
3. What are the main segments of the Biochar Industry?
The market segments include Technology, Application.
4. Can you provide details about the market size?
The market size is estimated to be USD 541.8 Million as of 2022.
5. What are some drivers contributing to market growth?
Increasing Applications for Plant Growth and Development; Growing Demand for Organic Foods in Developing Countries.
6. What are the notable trends driving market growth?
Agriculture Segment to Dominate the Market.
7. Are there any restraints impacting market growth?
High Production Costs; Competition from Alternative Products.
8. Can you provide examples of recent developments in the market?
November 2023: BIOSORRA launched a production plant for biochar in East Africa at Thika in Kiambu County, Kenya. This biochar would be provided to Kenya Nut Company, a multinational agribusiness company involved in growing a wide range of products.
9. What pricing options are available for accessing the report?
Pricing options include single-user, multi-user, and enterprise licenses priced at USD 4750, USD 5250, and USD 8750 respectively.
10. Is the market size provided in terms of value or volume?
The market size is provided in terms of value, measured in Million and volume, measured in K Tons.
11. Are there any specific market keywords associated with the report?
Yes, the market keyword associated with the report is "Biochar Industry," which aids in identifying and referencing the specific market segment covered.
12. How do I determine which pricing option suits my needs best?
The pricing options vary based on user requirements and access needs. Individual users may opt for single-user licenses, while businesses requiring broader access may choose multi-user or enterprise licenses for cost-effective access to the report.
13. Are there any additional resources or data provided in the Biochar Industry report?
While the report offers comprehensive insights, it's advisable to review the specific contents or supplementary materials provided to ascertain if additional resources or data are available.
14. How can I stay updated on further developments or reports in the Biochar Industry?
To stay informed about further developments, trends, and reports in the Biochar Industry, consider subscribing to industry newsletters, following relevant companies and organizations, or regularly checking reputable industry news sources and publications.
Methodology
Step 1 - Identification of Relevant Samples Size from Population Database


Step 2 - Approaches for Defining Global Market Size (Value, Volume* & Price*)

Note*: In applicable scenarios
Step 3 - Data Sources
Primary Research
- Web Analytics
- Survey Reports
- Research Institute
- Latest Research Reports
- Opinion Leaders
Secondary Research
- Annual Reports
- White Paper
- Latest Press Release
- Industry Association
- Paid Database
- Investor Presentations

Step 4 - Data Triangulation
Involves using different sources of information in order to increase the validity of a study
These sources are likely to be stakeholders in a program - participants, other researchers, program staff, other community members, and so on.
Then we put all data in single framework & apply various statistical tools to find out the dynamic on the market.
During the analysis stage, feedback from the stakeholder groups would be compared to determine areas of agreement as well as areas of divergence