

Key Insights
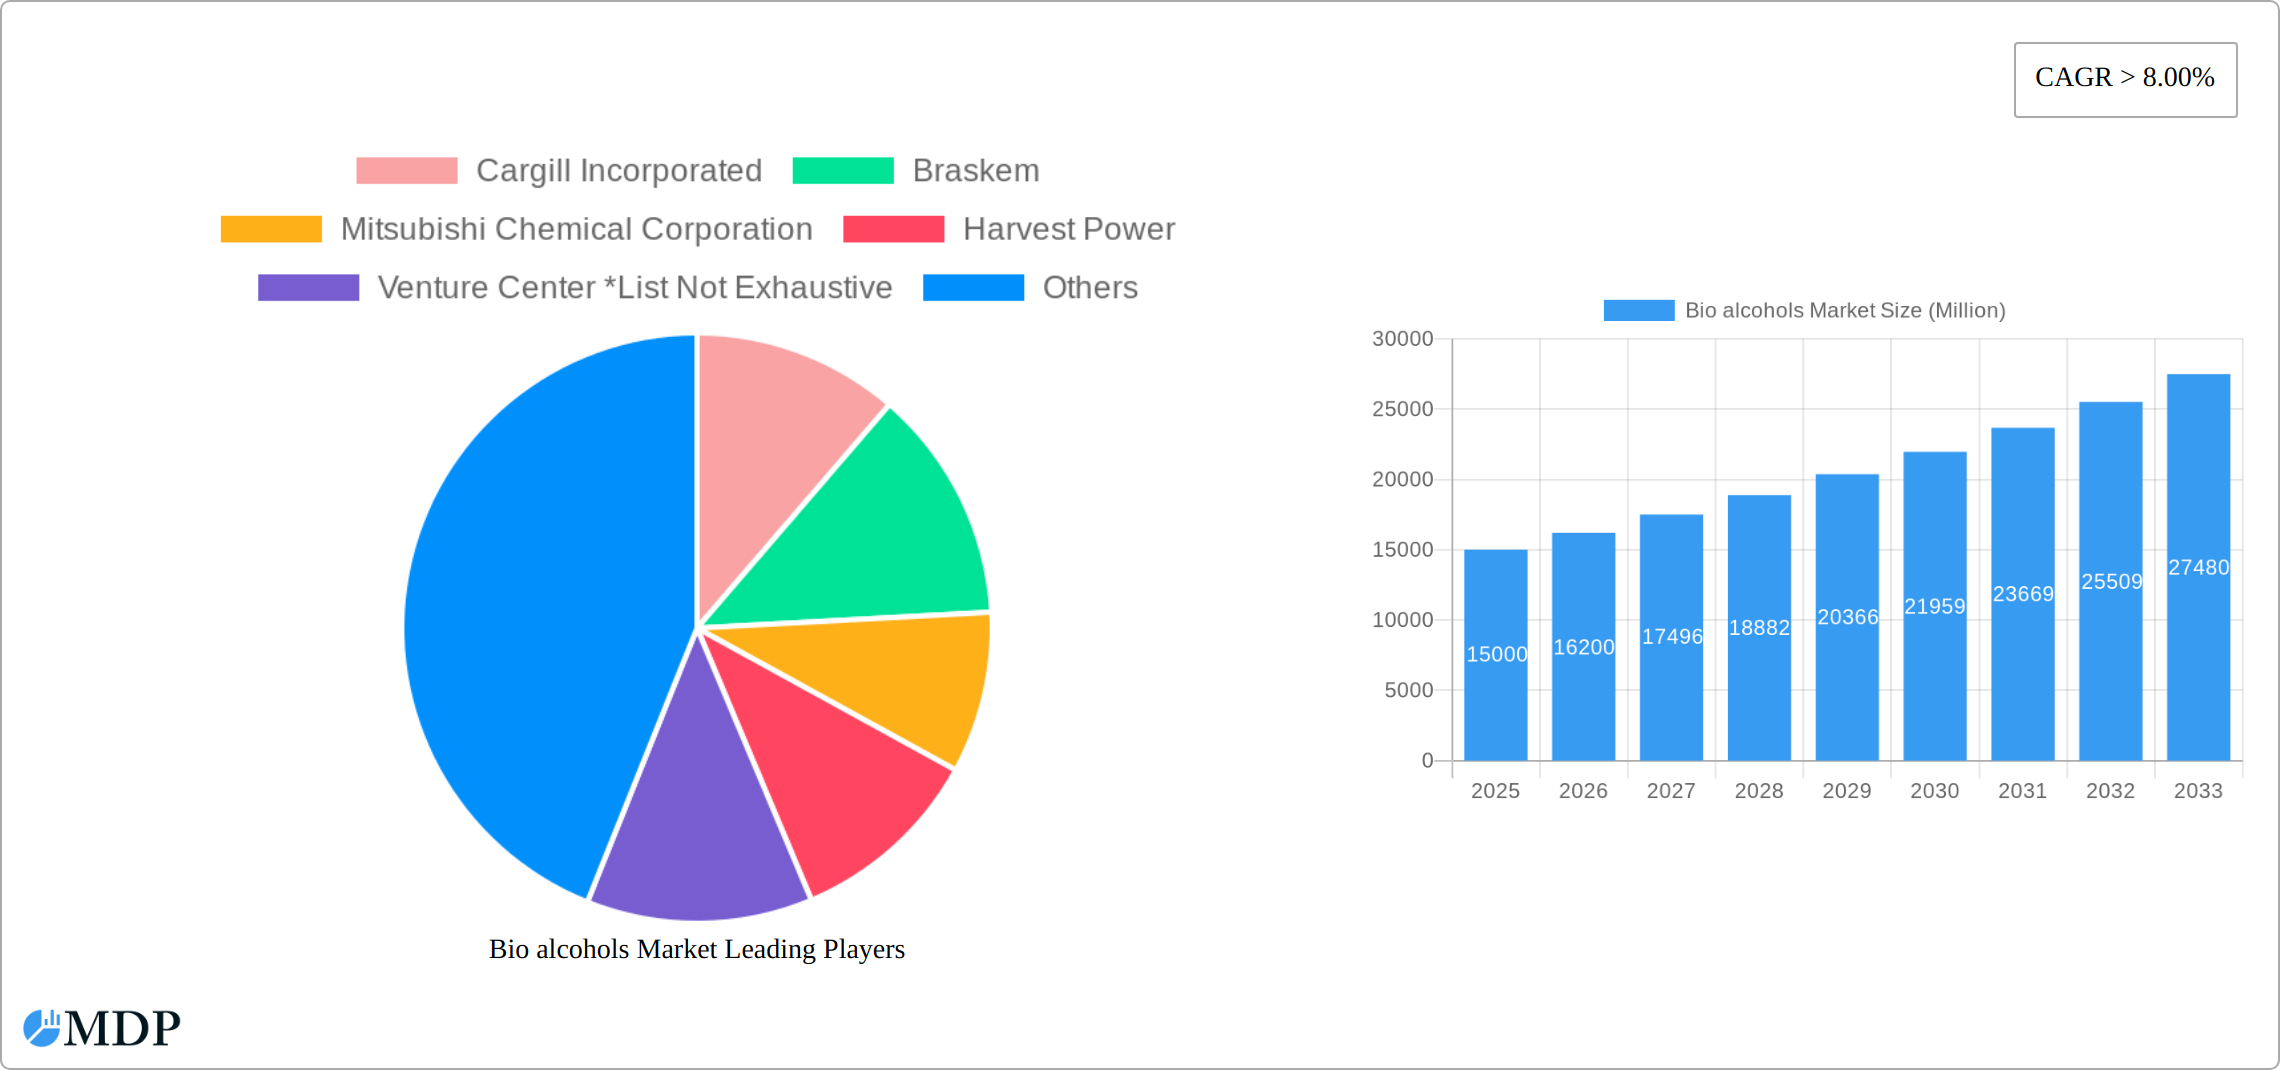
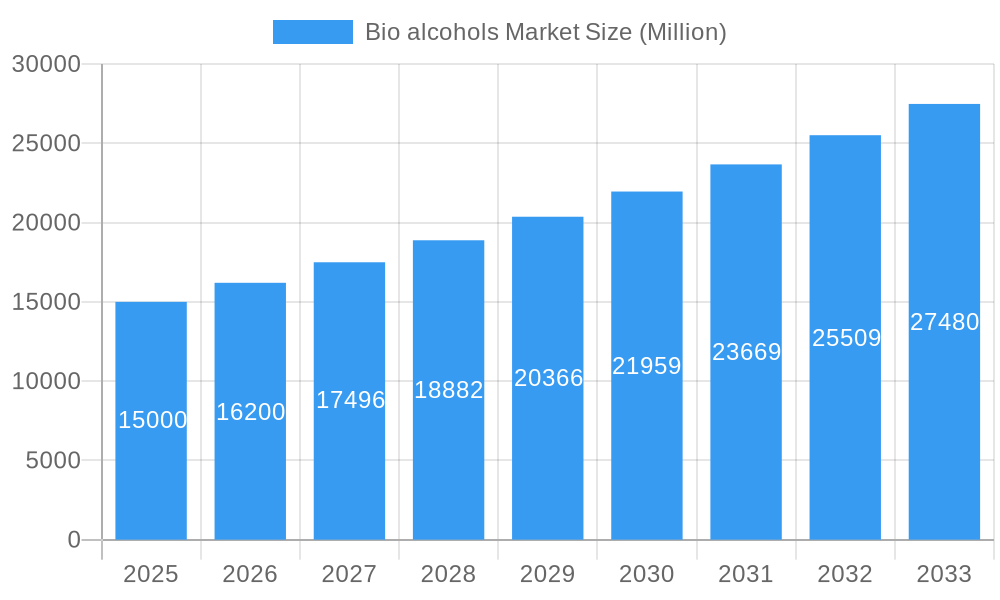
The bio-alcohols market, encompassing bio-methanol, bio-ethanol, bio-butanol, bio-BDO, and other bio-based alcohols, is experiencing robust growth, projected to maintain a Compound Annual Growth Rate (CAGR) exceeding 8% from 2025 to 2033. This expansion is fueled by several key drivers. The increasing global demand for sustainable and renewable alternatives to fossil fuels in transportation is a significant factor, particularly the rising adoption of biofuels blended with gasoline or used as pure biofuels. Furthermore, the growing awareness of environmental concerns and stricter government regulations promoting renewable energy sources are driving market adoption. The versatility of bio-alcohols across various applications, including construction (solvents, adhesives), electronics (cleaning agents), and pharmaceuticals (intermediates), further contributes to this market's growth. Technological advancements leading to improved bio-alcohol production efficiency and cost reduction are also enhancing market competitiveness.
Bio alcohols Market Market Size (In Billion)
However, the market faces certain restraints. Fluctuations in raw material prices (agricultural feedstocks) and the dependence on agricultural land for feedstock production can impact profitability and sustainability. The establishment of robust infrastructure for bio-alcohol production and distribution is crucial for market penetration, particularly in developing regions. Competition from established petrochemical-based products also poses a challenge. Despite these challenges, the long-term outlook for the bio-alcohols market remains positive, driven by the continuous shift towards a more sustainable and environmentally friendly economy. Regional variations exist, with Asia Pacific, North America, and Europe representing major market segments, each presenting unique growth opportunities based on specific government policies, technological advancements, and consumer demand. The market is expected to reach a substantial size by 2033, significantly exceeding its current valuation, driven by the factors mentioned above. Specific growth within segments like bio-ethanol (currently the dominant product type) is anticipated to be particularly strong due to its established use in transportation fuels.
Bio alcohols Market Company Market Share
Bio Alcohols Market: A Comprehensive Report (2019-2033)
Unlocking the potential of sustainable fuels and chemicals: This in-depth report provides a comprehensive analysis of the Bio Alcohols Market, offering invaluable insights for stakeholders across the value chain. The Bio Alcohols Market is projected to reach xx Million by 2033, exhibiting a CAGR of xx% during the forecast period (2025-2033). This report covers the historical period (2019-2024), with 2025 serving as the base and estimated year. Key players like Cargill Incorporated, Braskem, and BASF SE are shaping the market landscape.
Bio Alcohols Market Market Dynamics & Concentration
This section delves into the competitive dynamics of the bio alcohols market, analyzing market concentration, innovation drivers, regulatory frameworks, product substitutes, end-user trends, and M&A activities. The market exhibits a moderately concentrated structure, with the top five players holding an estimated xx% market share in 2025.
- Innovation Drivers: Advancements in fermentation technologies, enzyme engineering, and biomass pretreatment are driving efficiency improvements and cost reductions.
- Regulatory Frameworks: Government policies promoting renewable energy and reducing carbon emissions are key growth drivers. Stringent emission standards in various regions are pushing adoption.
- Product Substitutes: Fossil-based alcohols and other chemical feedstocks represent primary substitutes, but their environmental impact limits their competitiveness.
- End-User Trends: Growing demand from transportation and chemical industries is driving market expansion. The shift towards sustainable practices across various sectors fuels growth.
- M&A Activities: The past five years have witnessed xx M&A deals in the bio alcohols sector, reflecting consolidation and strategic expansion efforts among key players. These deals primarily aimed at securing feedstock supplies, expanding product portfolios, and accessing new markets.
Bio Alcohols Market Industry Trends & Analysis
This section explores the key trends shaping the bio alcohols market. The market is experiencing significant growth driven by increasing demand for renewable energy and sustainable chemicals. The rising awareness of environmental issues and government regulations supporting biofuels are accelerating adoption. Technological advancements in bio-alcohol production are reducing costs and improving efficiency, further fueling market expansion. Consumer preferences for environmentally friendly products and increasing disposable incomes are positively influencing the market. The competitive landscape is characterized by intense rivalry among established players and emerging entrants, leading to innovation and price competition. Market penetration of bio alcohols in transportation fuel is estimated at xx% in 2025, projected to reach xx% by 2033.
Leading Markets & Segments in Bio Alcohols Market
This section identifies the dominant regions, countries, and segments within the bio alcohols market. The transportation segment dominates the application landscape, driven by mandates for renewable fuel blends. Bio-ethanol is currently the leading product type due to established infrastructure and economies of scale.
Dominant Regions/Countries:
- North America: Strong government support for renewable fuels and a robust infrastructure contribute to its dominance.
- Europe: Stricter environmental regulations and growing demand for sustainable transportation fuels drive market growth.
- Asia Pacific: Rapid industrialization and economic growth in developing nations are fueling demand.
Dominant Segments:
- Product Type: Bio-ethanol holds the largest market share due to established production technologies and widespread adoption in transportation.
- Application: The transportation sector dominates owing to the use of bio-ethanol and bio-butanol as fuel additives or blends.
Key Drivers for Dominant Regions/Segments:
- Economic policies: Subsidies, tax incentives, and carbon pricing mechanisms incentivize bio alcohol production and consumption.
- Infrastructure: Availability of feedstock, production facilities, and distribution networks play a crucial role.
- Consumer awareness: Growing consumer preference for sustainable and environmentally friendly products boosts demand.
Bio Alcohols Market Product Developments
Recent product innovations focus on improving bio alcohol production efficiency, reducing costs, and expanding applications. Advancements in fermentation technologies and process optimization are yielding higher yields and lower production costs. New applications are being explored in the chemical industry, pharmaceuticals, and construction sectors. These developments reflect the increasing market demand for sustainable alternatives to petroleum-based chemicals.
Key Drivers of Bio alcohols Market Growth
Several factors drive bio alcohols market growth:
- Growing environmental concerns: The increasing awareness of climate change and greenhouse gas emissions is pushing the adoption of bio alcohols as cleaner alternatives to fossil fuels.
- Government policies and regulations: Government incentives, mandates, and emission standards promote the use of renewable fuels.
- Technological advancements: Improvements in fermentation technologies and biomass conversion processes reduce costs and improve efficiency.
- Rising demand from diverse industries: Bio alcohols find applications in various industries, including transportation, chemicals, and pharmaceuticals, contributing to market growth.
Challenges in the Bio alcohols Market Market
The bio alcohols market faces challenges:
- Feedstock availability and cost: The availability and cost of sustainable feedstock influence the production cost and market competitiveness of bio alcohols. Fluctuations in feedstock prices can affect profitability.
- Technological limitations: Some bio alcohol production processes are less efficient or economically viable compared to fossil fuel-based alternatives.
- Competition from fossil fuels: Fossil fuels continue to be a dominant energy source, making competition fierce. Their lower production costs represent a significant challenge for bio alcohols.
Emerging Opportunities in Bio alcohols Market
Despite the challenges, the bio alcohols market presents compelling opportunities driven by technological innovation, environmental concerns, and supportive governmental policies.
- Technological Advancements and Process Optimization: Ongoing research and development efforts are yielding more efficient and cost-effective bio alcohol production methods. These include advancements in synthetic biology, metabolic engineering, and the development of novel enzymes to enhance conversion rates and reduce production costs. Specifically, cellulosic ethanol production from lignocellulosic biomass holds significant promise for sustainability.
- Strategic Alliances and Collaborative Partnerships: Synergistic collaborations among bio alcohol producers, energy companies, agricultural stakeholders, and technology providers are accelerating innovation, fostering market growth, and enabling access to capital and expertise.
- Diversification of Applications and Market Expansion: Bio alcohols are not limited to fuel applications. Exploring and expanding into new markets, such as the production of bio-based plastics, solvents, and chemicals, creates diverse revenue streams and reduces reliance on single-use markets.
- Growing Demand Driven by Sustainability Goals: The global shift toward decarbonization and the increasing emphasis on renewable energy sources are driving significant demand for sustainable alternatives to fossil fuels. This creates a strong impetus for the growth of the bio alcohols market.
- Government Incentives and Policy Support: Many governments are implementing policies such as biofuel mandates, tax credits, and subsidies to promote the adoption of bio alcohols, further fueling market expansion.
Leading Players in the Bio alcohols Market Sector
- Cargill Incorporated
- Braskem
- Mitsubishi Chemical Corporation
- Harvest Power
- Venture Center
- BASF SE
- DSM
- Valero Marketing and Supply Company
- Mascoma LLC
- Fulcrum BioEnergy
Key Milestones in Bio alcohols Market Industry
- 2021: Significant investments were announced by major players in next-generation biofuel technologies, reflecting a growing confidence in the sector's long-term potential.
- 2022: Several countries strengthened their biofuel mandates, requiring higher blends of biofuels in transportation fuels, thereby boosting market demand.
- 2023: Continued advancements in cellulosic ethanol production demonstrated significant progress towards commercial viability, paving the way for a more sustainable biofuel landscape. This includes breakthroughs in enzymatic efficiency and cost-reduction strategies.
- 2024 (projected): Further industry consolidation is expected, with mergers and acquisitions driving scale and efficiency improvements within the bio alcohol sector.
Strategic Outlook for Bio alcohols Market Market
The bio alcohols market is poised for strong growth, driven by technological innovation, supportive government policies, and increasing demand from various sectors. Strategic investments in R&D, strategic partnerships, and expansion into new applications are key to realizing the market's full potential. The shift towards a circular economy and the need for sustainable alternatives to fossil fuels presents significant long-term opportunities.
Bio alcohols Market Segmentation
-
1. Product Type
- 1.1. Bio-methanol
- 1.2. Bio-ethanol
- 1.3. Bio-butanol
- 1.4. Bio-BDO
- 1.5. Other Product Types
-
2. Application
- 2.1. Transportation
- 2.2. Construction
- 2.3. Electronics
- 2.4. Pharmaceutical
- 2.5. Other Applications
Bio alcohols Market Segmentation By Geography
-
1. Asia Pacific
- 1.1. China
- 1.2. India
- 1.3. Japan
- 1.4. South Korea
- 1.5. ASEAN Countries
- 1.6. Rest of Asia Pacific
-
2. North America
- 2.1. United States
- 2.2. Canada
- 2.3. Mexico
-
3. Europe
- 3.1. Germany
- 3.2. United Kingdom
- 3.3. Italy
- 3.4. France
- 3.5. Rest of Europe
-
4. South America
- 4.1. Brazil
- 4.2. Argentina
- 4.3. Rest of South America
-
5. Middle East and Africa
- 5.1. Saudi Arabia
- 5.2. South Africa
- 5.3. Rest of Middle East and Africa
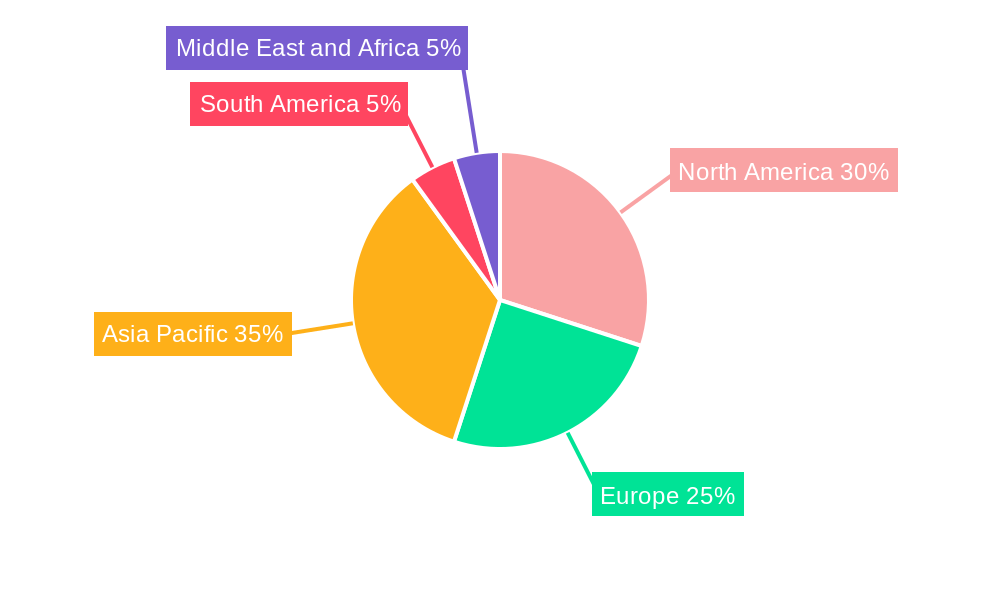
Bio alcohols Market Regional Market Share
Geographic Coverage of Bio alcohols Market
Bio alcohols Market REPORT HIGHLIGHTS
| Aspects | Details |
|---|---|
| Study Period | 2020-2034 |
| Base Year | 2025 |
| Estimated Year | 2026 |
| Forecast Period | 2026-2034 |
| Historical Period | 2020-2025 |
| Growth Rate | CAGR of 6.5% from 2020-2034 |
| Segmentation |
|
Table of Contents
- 1. Introduction
- 1.1. Research Scope
- 1.2. Market Segmentation
- 1.3. Research Objective
- 1.4. Definitions and Assumptions
- 2. Executive Summary
- 2.1. Market Snapshot
- 3. Market Dynamics
- 3.1. Market Drivers
- 3.2. Market Restrains
- 3.3. Market Trends
- 3.4. Market Opportunities
- 4. Market Factor Analysis
- 4.1. Porters Five Forces
- 4.1.1. Bargaining Power of Suppliers
- 4.1.2. Bargaining Power of Buyers
- 4.1.3. Threat of New Entrants
- 4.1.4. Threat of Substitutes
- 4.1.5. Competitive Rivalry
- 4.2. PESTEL analysis
- 4.3. BCG Analysis
- 4.3.1. Stars (High Growth, High Market Share)
- 4.3.2. Cash Cows (Low Growth, High Market Share)
- 4.3.3. Question Mark (High Growth, Low Market Share)
- 4.3.4. Dogs (Low Growth, Low Market Share)
- 4.4. Ansoff Matrix Analysis
- 4.5. Supply Chain Analysis
- 4.6. Regulatory Landscape
- 4.7. Current Market Potential and Opportunity Assessment (TAM–SAM–SOM Framework)
- 4.8. MDP Analyst Note
- 4.1. Porters Five Forces
- 5. Market Analysis, Insights and Forecast 2021-2033
- 5.1. Market Analysis, Insights and Forecast - by Product Type
- 5.1.1. Bio-methanol
- 5.1.2. Bio-ethanol
- 5.1.3. Bio-butanol
- 5.1.4. Bio-BDO
- 5.1.5. Other Product Types
- 5.2. Market Analysis, Insights and Forecast - by Application
- 5.2.1. Transportation
- 5.2.2. Construction
- 5.2.3. Electronics
- 5.2.4. Pharmaceutical
- 5.2.5. Other Applications
- 5.3. Market Analysis, Insights and Forecast - by Region
- 5.3.1. Asia Pacific
- 5.3.2. North America
- 5.3.3. Europe
- 5.3.4. South America
- 5.3.5. Middle East and Africa
- 5.1. Market Analysis, Insights and Forecast - by Product Type
- 6. Global Bio alcohols Market Analysis, Insights and Forecast, 2021-2033
- 6.1. Market Analysis, Insights and Forecast - by Product Type
- 6.1.1. Bio-methanol
- 6.1.2. Bio-ethanol
- 6.1.3. Bio-butanol
- 6.1.4. Bio-BDO
- 6.1.5. Other Product Types
- 6.2. Market Analysis, Insights and Forecast - by Application
- 6.2.1. Transportation
- 6.2.2. Construction
- 6.2.3. Electronics
- 6.2.4. Pharmaceutical
- 6.2.5. Other Applications
- 6.1. Market Analysis, Insights and Forecast - by Product Type
- 7. Asia Pacific Bio alcohols Market Analysis, Insights and Forecast, 2020-2032
- 7.1. Market Analysis, Insights and Forecast - by Product Type
- 7.1.1. Bio-methanol
- 7.1.2. Bio-ethanol
- 7.1.3. Bio-butanol
- 7.1.4. Bio-BDO
- 7.1.5. Other Product Types
- 7.2. Market Analysis, Insights and Forecast - by Application
- 7.2.1. Transportation
- 7.2.2. Construction
- 7.2.3. Electronics
- 7.2.4. Pharmaceutical
- 7.2.5. Other Applications
- 7.1. Market Analysis, Insights and Forecast - by Product Type
- 8. North America Bio alcohols Market Analysis, Insights and Forecast, 2020-2032
- 8.1. Market Analysis, Insights and Forecast - by Product Type
- 8.1.1. Bio-methanol
- 8.1.2. Bio-ethanol
- 8.1.3. Bio-butanol
- 8.1.4. Bio-BDO
- 8.1.5. Other Product Types
- 8.2. Market Analysis, Insights and Forecast - by Application
- 8.2.1. Transportation
- 8.2.2. Construction
- 8.2.3. Electronics
- 8.2.4. Pharmaceutical
- 8.2.5. Other Applications
- 8.1. Market Analysis, Insights and Forecast - by Product Type
- 9. Europe Bio alcohols Market Analysis, Insights and Forecast, 2020-2032
- 9.1. Market Analysis, Insights and Forecast - by Product Type
- 9.1.1. Bio-methanol
- 9.1.2. Bio-ethanol
- 9.1.3. Bio-butanol
- 9.1.4. Bio-BDO
- 9.1.5. Other Product Types
- 9.2. Market Analysis, Insights and Forecast - by Application
- 9.2.1. Transportation
- 9.2.2. Construction
- 9.2.3. Electronics
- 9.2.4. Pharmaceutical
- 9.2.5. Other Applications
- 9.1. Market Analysis, Insights and Forecast - by Product Type
- 10. South America Bio alcohols Market Analysis, Insights and Forecast, 2020-2032
- 10.1. Market Analysis, Insights and Forecast - by Product Type
- 10.1.1. Bio-methanol
- 10.1.2. Bio-ethanol
- 10.1.3. Bio-butanol
- 10.1.4. Bio-BDO
- 10.1.5. Other Product Types
- 10.2. Market Analysis, Insights and Forecast - by Application
- 10.2.1. Transportation
- 10.2.2. Construction
- 10.2.3. Electronics
- 10.2.4. Pharmaceutical
- 10.2.5. Other Applications
- 10.1. Market Analysis, Insights and Forecast - by Product Type
- 11. Middle East and Africa Bio alcohols Market Analysis, Insights and Forecast, 2020-2032
- 11.1. Market Analysis, Insights and Forecast - by Product Type
- 11.1.1. Bio-methanol
- 11.1.2. Bio-ethanol
- 11.1.3. Bio-butanol
- 11.1.4. Bio-BDO
- 11.1.5. Other Product Types
- 11.2. Market Analysis, Insights and Forecast - by Application
- 11.2.1. Transportation
- 11.2.2. Construction
- 11.2.3. Electronics
- 11.2.4. Pharmaceutical
- 11.2.5. Other Applications
- 11.1. Market Analysis, Insights and Forecast - by Product Type
- 12. Competitive Analysis
- 12.1. Company Profiles
- 12.1.1 Cargill Incorporated
- 12.1.1.1. Company Overview
- 12.1.1.2. Products
- 12.1.1.3. Company Financials
- 12.1.1.4. SWOT Analysis
- 12.1.2 Braskem
- 12.1.2.1. Company Overview
- 12.1.2.2. Products
- 12.1.2.3. Company Financials
- 12.1.2.4. SWOT Analysis
- 12.1.3 Mitsubishi Chemical Corporation
- 12.1.3.1. Company Overview
- 12.1.3.2. Products
- 12.1.3.3. Company Financials
- 12.1.3.4. SWOT Analysis
- 12.1.4 Harvest Power
- 12.1.4.1. Company Overview
- 12.1.4.2. Products
- 12.1.4.3. Company Financials
- 12.1.4.4. SWOT Analysis
- 12.1.5 Venture Center *List Not Exhaustive
- 12.1.5.1. Company Overview
- 12.1.5.2. Products
- 12.1.5.3. Company Financials
- 12.1.5.4. SWOT Analysis
- 12.1.6 BASF SE
- 12.1.6.1. Company Overview
- 12.1.6.2. Products
- 12.1.6.3. Company Financials
- 12.1.6.4. SWOT Analysis
- 12.1.7 DSM
- 12.1.7.1. Company Overview
- 12.1.7.2. Products
- 12.1.7.3. Company Financials
- 12.1.7.4. SWOT Analysis
- 12.1.8 Valero Marketing and Supply Company
- 12.1.8.1. Company Overview
- 12.1.8.2. Products
- 12.1.8.3. Company Financials
- 12.1.8.4. SWOT Analysis
- 12.1.9 Mascoma LLC
- 12.1.9.1. Company Overview
- 12.1.9.2. Products
- 12.1.9.3. Company Financials
- 12.1.9.4. SWOT Analysis
- 12.1.10 Fulcrum BioEnergy
- 12.1.10.1. Company Overview
- 12.1.10.2. Products
- 12.1.10.3. Company Financials
- 12.1.10.4. SWOT Analysis
- 12.1.1 Cargill Incorporated
- 12.2. Market Entropy
- 12.2.1 Company's Key Areas Served
- 12.2.2 Recent Developments
- 12.3. Company Market Share Analysis 2025
- 12.3.1 Top 5 Companies Market Share Analysis
- 12.3.2 Top 3 Companies Market Share Analysis
- 12.4. List of Potential Customers
- 13. Research Methodology
List of Figures
- Figure 1: Global Bio alcohols Market Revenue Breakdown (billion, %) by Region 2025 & 2033
- Figure 2: Asia Pacific Bio alcohols Market Revenue (billion), by Product Type 2025 & 2033
- Figure 3: Asia Pacific Bio alcohols Market Revenue Share (%), by Product Type 2025 & 2033
- Figure 4: Asia Pacific Bio alcohols Market Revenue (billion), by Application 2025 & 2033
- Figure 5: Asia Pacific Bio alcohols Market Revenue Share (%), by Application 2025 & 2033
- Figure 6: Asia Pacific Bio alcohols Market Revenue (billion), by Country 2025 & 2033
- Figure 7: Asia Pacific Bio alcohols Market Revenue Share (%), by Country 2025 & 2033
- Figure 8: North America Bio alcohols Market Revenue (billion), by Product Type 2025 & 2033
- Figure 9: North America Bio alcohols Market Revenue Share (%), by Product Type 2025 & 2033
- Figure 10: North America Bio alcohols Market Revenue (billion), by Application 2025 & 2033
- Figure 11: North America Bio alcohols Market Revenue Share (%), by Application 2025 & 2033
- Figure 12: North America Bio alcohols Market Revenue (billion), by Country 2025 & 2033
- Figure 13: North America Bio alcohols Market Revenue Share (%), by Country 2025 & 2033
- Figure 14: Europe Bio alcohols Market Revenue (billion), by Product Type 2025 & 2033
- Figure 15: Europe Bio alcohols Market Revenue Share (%), by Product Type 2025 & 2033
- Figure 16: Europe Bio alcohols Market Revenue (billion), by Application 2025 & 2033
- Figure 17: Europe Bio alcohols Market Revenue Share (%), by Application 2025 & 2033
- Figure 18: Europe Bio alcohols Market Revenue (billion), by Country 2025 & 2033
- Figure 19: Europe Bio alcohols Market Revenue Share (%), by Country 2025 & 2033
- Figure 20: South America Bio alcohols Market Revenue (billion), by Product Type 2025 & 2033
- Figure 21: South America Bio alcohols Market Revenue Share (%), by Product Type 2025 & 2033
- Figure 22: South America Bio alcohols Market Revenue (billion), by Application 2025 & 2033
- Figure 23: South America Bio alcohols Market Revenue Share (%), by Application 2025 & 2033
- Figure 24: South America Bio alcohols Market Revenue (billion), by Country 2025 & 2033
- Figure 25: South America Bio alcohols Market Revenue Share (%), by Country 2025 & 2033
- Figure 26: Middle East and Africa Bio alcohols Market Revenue (billion), by Product Type 2025 & 2033
- Figure 27: Middle East and Africa Bio alcohols Market Revenue Share (%), by Product Type 2025 & 2033
- Figure 28: Middle East and Africa Bio alcohols Market Revenue (billion), by Application 2025 & 2033
- Figure 29: Middle East and Africa Bio alcohols Market Revenue Share (%), by Application 2025 & 2033
- Figure 30: Middle East and Africa Bio alcohols Market Revenue (billion), by Country 2025 & 2033
- Figure 31: Middle East and Africa Bio alcohols Market Revenue Share (%), by Country 2025 & 2033
List of Tables
- Table 1: Global Bio alcohols Market Revenue billion Forecast, by Product Type 2020 & 2033
- Table 2: Global Bio alcohols Market Revenue billion Forecast, by Application 2020 & 2033
- Table 3: Global Bio alcohols Market Revenue billion Forecast, by Region 2020 & 2033
- Table 4: Global Bio alcohols Market Revenue billion Forecast, by Product Type 2020 & 2033
- Table 5: Global Bio alcohols Market Revenue billion Forecast, by Application 2020 & 2033
- Table 6: Global Bio alcohols Market Revenue billion Forecast, by Country 2020 & 2033
- Table 7: China Bio alcohols Market Revenue (billion) Forecast, by Application 2020 & 2033
- Table 8: India Bio alcohols Market Revenue (billion) Forecast, by Application 2020 & 2033
- Table 9: Japan Bio alcohols Market Revenue (billion) Forecast, by Application 2020 & 2033
- Table 10: South Korea Bio alcohols Market Revenue (billion) Forecast, by Application 2020 & 2033
- Table 11: ASEAN Countries Bio alcohols Market Revenue (billion) Forecast, by Application 2020 & 2033
- Table 12: Rest of Asia Pacific Bio alcohols Market Revenue (billion) Forecast, by Application 2020 & 2033
- Table 13: Global Bio alcohols Market Revenue billion Forecast, by Product Type 2020 & 2033
- Table 14: Global Bio alcohols Market Revenue billion Forecast, by Application 2020 & 2033
- Table 15: Global Bio alcohols Market Revenue billion Forecast, by Country 2020 & 2033
- Table 16: United States Bio alcohols Market Revenue (billion) Forecast, by Application 2020 & 2033
- Table 17: Canada Bio alcohols Market Revenue (billion) Forecast, by Application 2020 & 2033
- Table 18: Mexico Bio alcohols Market Revenue (billion) Forecast, by Application 2020 & 2033
- Table 19: Global Bio alcohols Market Revenue billion Forecast, by Product Type 2020 & 2033
- Table 20: Global Bio alcohols Market Revenue billion Forecast, by Application 2020 & 2033
- Table 21: Global Bio alcohols Market Revenue billion Forecast, by Country 2020 & 2033
- Table 22: Germany Bio alcohols Market Revenue (billion) Forecast, by Application 2020 & 2033
- Table 23: United Kingdom Bio alcohols Market Revenue (billion) Forecast, by Application 2020 & 2033
- Table 24: Italy Bio alcohols Market Revenue (billion) Forecast, by Application 2020 & 2033
- Table 25: France Bio alcohols Market Revenue (billion) Forecast, by Application 2020 & 2033
- Table 26: Rest of Europe Bio alcohols Market Revenue (billion) Forecast, by Application 2020 & 2033
- Table 27: Global Bio alcohols Market Revenue billion Forecast, by Product Type 2020 & 2033
- Table 28: Global Bio alcohols Market Revenue billion Forecast, by Application 2020 & 2033
- Table 29: Global Bio alcohols Market Revenue billion Forecast, by Country 2020 & 2033
- Table 30: Brazil Bio alcohols Market Revenue (billion) Forecast, by Application 2020 & 2033
- Table 31: Argentina Bio alcohols Market Revenue (billion) Forecast, by Application 2020 & 2033
- Table 32: Rest of South America Bio alcohols Market Revenue (billion) Forecast, by Application 2020 & 2033
- Table 33: Global Bio alcohols Market Revenue billion Forecast, by Product Type 2020 & 2033
- Table 34: Global Bio alcohols Market Revenue billion Forecast, by Application 2020 & 2033
- Table 35: Global Bio alcohols Market Revenue billion Forecast, by Country 2020 & 2033
- Table 36: Saudi Arabia Bio alcohols Market Revenue (billion) Forecast, by Application 2020 & 2033
- Table 37: South Africa Bio alcohols Market Revenue (billion) Forecast, by Application 2020 & 2033
- Table 38: Rest of Middle East and Africa Bio alcohols Market Revenue (billion) Forecast, by Application 2020 & 2033
Frequently Asked Questions
1. What is the projected Compound Annual Growth Rate (CAGR) of the Bio alcohols Market?
The projected CAGR is approximately 6.5%.
2. Which companies are prominent players in the Bio alcohols Market?
Key companies in the market include Cargill Incorporated, Braskem, Mitsubishi Chemical Corporation, Harvest Power, Venture Center *List Not Exhaustive, BASF SE, DSM, Valero Marketing and Supply Company, Mascoma LLC, Fulcrum BioEnergy.
3. What are the main segments of the Bio alcohols Market?
The market segments include Product Type, Application.
4. Can you provide details about the market size?
The market size is estimated to be USD 12.55 billion as of 2022.
5. What are some drivers contributing to market growth?
; Growing Demand for Bio-based Products; Other Drivers.
6. What are the notable trends driving market growth?
Bio-ethanol to Dominate the Market.
7. Are there any restraints impacting market growth?
; Declining Automotive Production; Impact of COVID-19 Pandemic.
8. Can you provide examples of recent developments in the market?
N/A
9. What pricing options are available for accessing the report?
Pricing options include single-user, multi-user, and enterprise licenses priced at USD 4750, USD 5250, and USD 8750 respectively.
10. Is the market size provided in terms of value or volume?
The market size is provided in terms of value, measured in billion.
11. Are there any specific market keywords associated with the report?
Yes, the market keyword associated with the report is "Bio alcohols Market," which aids in identifying and referencing the specific market segment covered.
12. How do I determine which pricing option suits my needs best?
The pricing options vary based on user requirements and access needs. Individual users may opt for single-user licenses, while businesses requiring broader access may choose multi-user or enterprise licenses for cost-effective access to the report.
13. Are there any additional resources or data provided in the Bio alcohols Market report?
While the report offers comprehensive insights, it's advisable to review the specific contents or supplementary materials provided to ascertain if additional resources or data are available.
14. How can I stay updated on further developments or reports in the Bio alcohols Market?
To stay informed about further developments, trends, and reports in the Bio alcohols Market, consider subscribing to industry newsletters, following relevant companies and organizations, or regularly checking reputable industry news sources and publications.
Methodology
Step 1 - Identification of Relevant Samples Size from Population Database


Step 2 - Approaches for Defining Global Market Size (Value, Volume* & Price*)

Note*: In applicable scenarios
Step 3 - Data Sources
Primary Research
- Web Analytics
- Survey Reports
- Research Institute
- Latest Research Reports
- Opinion Leaders
Secondary Research
- Annual Reports
- White Paper
- Latest Press Release
- Industry Association
- Paid Database
- Investor Presentations

Step 4 - Data Triangulation
Involves using different sources of information in order to increase the validity of a study
These sources are likely to be stakeholders in a program - participants, other researchers, program staff, other community members, and so on.
Then we put all data in single framework & apply various statistical tools to find out the dynamic on the market.
During the analysis stage, feedback from the stakeholder groups would be compared to determine areas of agreement as well as areas of divergence