

Key Insights
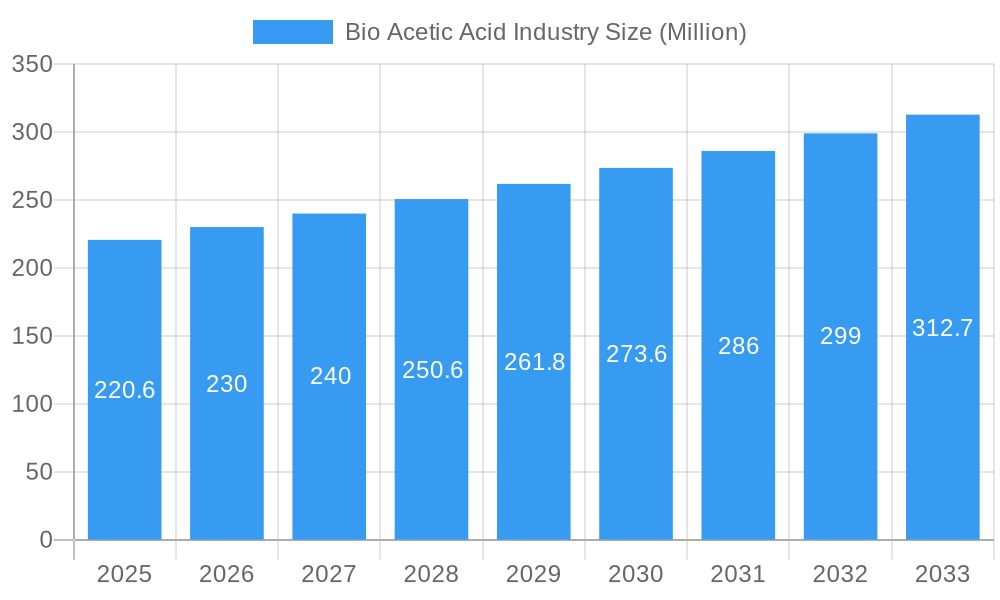
The global bio-acetic acid market, valued at $220.6 million in 2025, is projected for robust growth, exhibiting a Compound Annual Growth Rate (CAGR) exceeding 4.00% from 2025 to 2033. This expansion is fueled by several key drivers. The increasing demand for sustainable and bio-based chemicals across various industries, such as textiles and polymers, is a significant factor. Growing environmental concerns and stricter regulations regarding the use of petroleum-based chemicals are further propelling the adoption of bio-acetic acid as a greener alternative. Technological advancements in bio-based production processes, including improved fermentation techniques and enzyme catalysis, are enhancing efficiency and reducing production costs, making bio-acetic acid more competitive. The diverse applications of bio-acetic acid, spanning vinyl acetate monomer (VAM) production, acetate esters, purified terephthalic acid (PTA), and acetic anhydride, contribute to its market breadth and growth potential. Furthermore, the expanding biorefinery sector and increased availability of sustainable feedstocks like biomass, corn, maize, and sugar are supporting the market's upward trajectory.
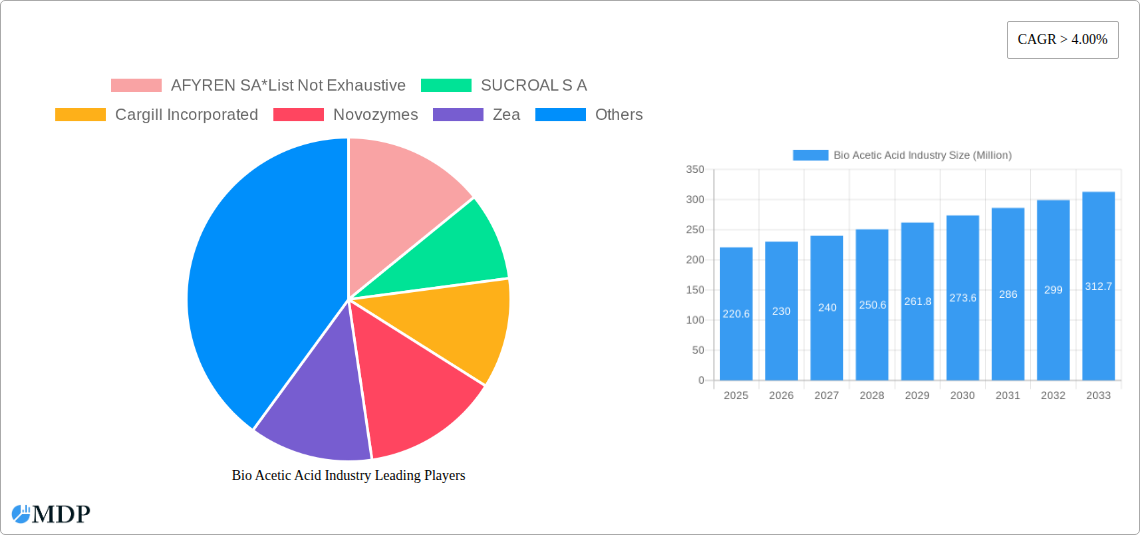
Bio Acetic Acid Industry Market Size (In Million)
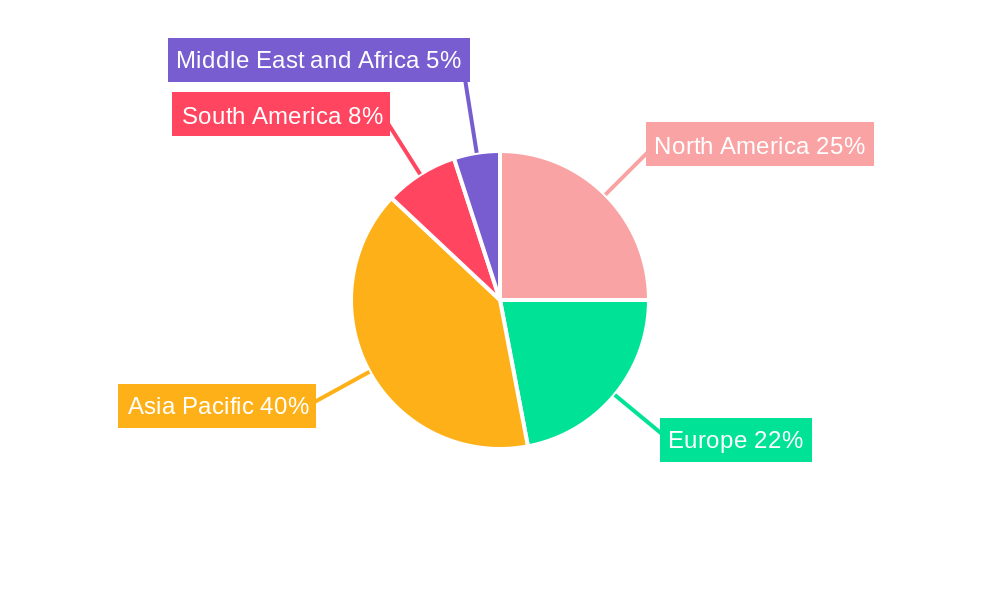
Significant regional variations exist within the market. The Asia-Pacific region, particularly China and India, is expected to dominate due to its burgeoning industrial sector and significant investments in renewable energy and bio-based technologies. North America and Europe also represent substantial markets, driven by strong environmental regulations and a growing consumer preference for eco-friendly products. However, challenges remain, including fluctuations in raw material prices and the need for further technological advancements to optimize production scalability and cost-effectiveness. Nevertheless, the overall outlook for the bio-acetic acid market is positive, with continued growth anticipated throughout the forecast period, driven by sustainable development goals and the growing need for eco-conscious solutions across various industries.
Bio Acetic Acid Industry Company Market Share
Bio Acetic Acid Industry Market Report: 2019-2033
This comprehensive report provides an in-depth analysis of the Bio Acetic Acid industry, offering valuable insights for stakeholders, investors, and industry professionals. Covering the period 2019-2033, with a focus on 2025, this report projects a market valued at xx Million by 2033, exhibiting a CAGR of xx% during the forecast period (2025-2033). The report leverages extensive market research, incorporating key data points and expert analysis to deliver actionable strategic recommendations.
Bio Acetic Acid Industry Market Dynamics & Concentration
This section analyzes the competitive landscape of the bio acetic acid market, examining market concentration, innovation drivers, regulatory landscapes, and key industry trends. The global market is characterized by a moderately consolidated structure, with key players like Cargill Incorporated, Novozymes, and BASF SE holding significant market share (xx%). However, emerging players like AFYREN SA and LanzaTech are increasingly challenging the status quo through technological innovation.
- Market Concentration: The Herfindahl-Hirschman Index (HHI) is estimated at xx, indicating a moderately concentrated market.
- Innovation Drivers: Advancements in biotechnology, particularly in fermentation technologies, are driving market growth. The development of high-yield strains and efficient bioprocesses is significantly reducing production costs.
- Regulatory Frameworks: Government policies promoting bio-based chemicals and reducing reliance on fossil fuels are fostering market expansion. Examples include the February 2022 Indian Government initiative to reduce customs duty on acetic acid.
- Product Substitutes: Petrochemically derived acetic acid remains a significant competitor, but the growing demand for sustainable alternatives is driving market share for bio-based options.
- End-User Trends: The increasing demand for bio-based materials across various sectors, including the packaging and textile industries, is bolstering the growth of the bio acetic acid market.
- M&A Activities: The number of mergers and acquisitions in the bio acetic acid industry has been steadily increasing over the past five years, averaging xx deals annually, signaling significant consolidation and expansion within the sector.
Bio Acetic Acid Industry Industry Trends & Analysis
This section delves into the factors shaping the bio acetic acid market's trajectory. The market's growth is primarily fueled by the increasing demand for sustainable and environmentally friendly alternatives to petrochemical-based acetic acid. This trend is further accelerated by stringent environmental regulations and growing consumer awareness of sustainability. Technological advancements, particularly in fermentation processes and strain engineering, are significantly improving the efficiency and cost-effectiveness of bio acetic acid production. The market is witnessing increased competition among established players and emerging biotech companies, leading to innovations in production processes and product applications. The market penetration rate for bio-acetic acid is projected to reach xx% by 2033, driven by a substantial increase in demand from various industries.
Leading Markets & Segments in Bio Acetic Acid Industry
This section identifies the dominant regions, countries, and segments within the bio acetic acid market. While specific regional dominance requires further data analysis for complete accuracy, initial projections suggest a strong presence in regions with significant agricultural output and established bio-based industries.
Raw Material Segments:
- Biomass: Biomass is expected to remain a leading raw material due to its abundance and renewability. Factors driving growth include government incentives and supportive policies for bio-based industries.
- Corn & Maize: These are key feedstocks particularly in regions with robust agricultural sectors, contributing to a significant portion of bio-acetic acid production.
- Sugar: Sugarcane and other sugar crops provide a viable alternative feedstock, particularly in regions where their cultivation is prevalent.
- Other Raw Materials: Research and development into alternative feedstocks, such as waste streams and lignocellulosic biomass, are expanding the raw material base.
Application Segments:
- Vinyl Acetate Monomer (VAM): VAM is a significant application driving market demand, due to its use in the production of polymers and adhesives.
- Acetate Esters: The use of acetate esters in solvents, coatings, and other applications contributes substantially to the overall market size.
- Purified Terephthalic Acid (PTA): PTA, a key component in polyester production, represents a growing segment driving market expansion.
- Acetic Anhydride: This intermediate chemical finds applications in various industries, contributing to moderate market demand.
- Other Applications: Emerging applications in pharmaceuticals, food processing, and other niche areas are creating opportunities for market expansion.
Bio Acetic Acid Industry Product Developments
Recent advancements in bio-based acetic acid production include the development of high-efficiency fermentation strains and advanced bioreactor technologies. These innovations are resulting in higher yields, lower production costs, and improved product quality. Novozymes’ launch of Innova Apex and Innova Turbo in July 2022 exemplifies this trend, enabling ethanol producers to enhance their fermentation processes and subsequently impact bio acetic acid production efficiency. The ongoing focus is on improving the sustainability and cost-competitiveness of bio-acetic acid to further expand its market share compared to its petrochemical counterpart.
Key Drivers of Bio Acetic Acid Industry Growth
Several factors contribute to the bio acetic acid industry's growth. Firstly, the increasing global demand for sustainable and eco-friendly alternatives to petrochemicals is a major driver. Secondly, government regulations and incentives aimed at promoting the use of bio-based materials are creating a favorable market environment. Thirdly, ongoing technological advancements in fermentation technologies are continuously improving the efficiency and cost-effectiveness of bio acetic acid production, thereby enhancing its market competitiveness.
Challenges in the Bio Acetic Acid Industry Market
The bio acetic acid industry faces challenges, including high initial investment costs associated with setting up bio-based production facilities. Competition from petrochemical-based acetic acid, particularly in terms of pricing, remains a significant hurdle. Supply chain disruptions and fluctuations in raw material prices also pose risks to market stability. The variability and inconsistent quality of biomass feedstocks can also present significant challenges to the consistent production of bio acetic acid.
Emerging Opportunities in Bio Acetic Acid Industry
The long-term prospects for the bio acetic acid industry are positive, fueled by ongoing research and development into novel fermentation technologies and cost-effective feedstocks. Strategic partnerships between biotech companies and large chemical producers will further propel market growth. Expansion into new applications, particularly in high-growth sectors like bioplastics and biofuels, presents significant opportunities for future expansion.
Leading Players in the Bio Acetic Acid Industry Sector
- AFYREN SA
- SUCROAL S A
- Cargill Incorporated
- Novozymes
- Zea
- LanzaTech
- GODAVARI BIOREFINERIES LTD
- btgbioliquids
- Airedale Chemical Company Limited
- BASF SE
Key Milestones in Bio Acetic Acid Industry Industry
- July 2022: Novozymes launched Innova Apex and Innova Turbo, advanced yeast solutions that significantly improve ethanol production efficiency, indirectly impacting bio acetic acid production.
- February 2022: The Indian Government proposed reducing customs duty on acetic acid, boosting domestic production and market competitiveness.
Strategic Outlook for Bio Acetic Acid Industry Market
The future of the bio acetic acid industry is bright. Continuous technological advancements, coupled with increasing demand for sustainable alternatives and supportive government policies, will drive market expansion. Strategic partnerships and acquisitions will further consolidate the market, fostering innovation and efficiency. The focus on developing cost-effective and scalable production technologies will be crucial in expanding market penetration and achieving broader adoption of bio-based acetic acid.
Bio Acetic Acid Industry Segmentation
-
1. Raw Material
- 1.1. Biomass
- 1.2. Corn
- 1.3. Maize
- 1.4. Sugar
- 1.5. Other Raw Materials
-
2. Application
- 2.1. Vinyl Acetate Monomer (VAM)
- 2.2. Acetate Esters
- 2.3. Purified Terephthalic Acid (PTA)
- 2.4. Acetic Anhydride
- 2.5. Other Applications
Bio Acetic Acid Industry Segmentation By Geography
-
1. Asia Pacific
- 1.1. China
- 1.2. India
- 1.3. Japan
- 1.4. South Korea
- 1.5. Malaysia
- 1.6. Thailand
- 1.7. Indonesia
- 1.8. Vietnam
- 1.9. Rest of Asia Pacific
-
2. North America
- 2.1. United States
- 2.2. Canada
- 2.3. Mexico
-
3. Europe
- 3.1. Germany
- 3.2. United Kingdom
- 3.3. Italy
- 3.4. France
- 3.5. Spain
- 3.6. NORDIC Countries
- 3.7. Turkey
- 3.8. Russia
- 3.9. Rest of Europe
-
4. South America
- 4.1. Brazil
- 4.2. Argentina
- 4.3. Colombia
- 4.4. Rest of South America
-
5. Middle East and Africa
- 5.1. Qatar
- 5.2. United Arab Emirates
- 5.3. Nigeria
- 5.4. Egypt
- 5.5. South Africa
- 5.6. Rest of Middle East and Africa
-
6. Middle East and Africa
- 6.1. Saudi Arabia
- 6.2. South Africa
- 6.3. Rest of Middle East and Africa
Bio Acetic Acid Industry Regional Market Share
Geographic Coverage of Bio Acetic Acid Industry
Bio Acetic Acid Industry REPORT HIGHLIGHTS
| Aspects | Details |
|---|---|
| Study Period | 2020-2034 |
| Base Year | 2025 |
| Estimated Year | 2026 |
| Forecast Period | 2026-2034 |
| Historical Period | 2020-2025 |
| Growth Rate | CAGR of > 4.00% from 2020-2034 |
| Segmentation |
|
Table of Contents
- 1. Introduction
- 1.1. Research Scope
- 1.2. Market Segmentation
- 1.3. Research Objective
- 1.4. Definitions and Assumptions
- 2. Executive Summary
- 2.1. Market Snapshot
- 3. Market Dynamics
- 3.1. Market Drivers
- 3.2. Market Restrains
- 3.3. Market Trends
- 3.4. Market Opportunities
- 4. Market Factor Analysis
- 4.1. Porters Five Forces
- 4.1.1. Bargaining Power of Suppliers
- 4.1.2. Bargaining Power of Buyers
- 4.1.3. Threat of New Entrants
- 4.1.4. Threat of Substitutes
- 4.1.5. Competitive Rivalry
- 4.2. PESTEL analysis
- 4.3. BCG Analysis
- 4.3.1. Stars (High Growth, High Market Share)
- 4.3.2. Cash Cows (Low Growth, High Market Share)
- 4.3.3. Question Mark (High Growth, Low Market Share)
- 4.3.4. Dogs (Low Growth, Low Market Share)
- 4.4. Ansoff Matrix Analysis
- 4.5. Supply Chain Analysis
- 4.6. Regulatory Landscape
- 4.7. Current Market Potential and Opportunity Assessment (TAM–SAM–SOM Framework)
- 4.8. MDP Analyst Note
- 4.1. Porters Five Forces
- 5. Market Analysis, Insights and Forecast 2021-2033
- 5.1. Market Analysis, Insights and Forecast - by Raw Material
- 5.1.1. Biomass
- 5.1.2. Corn
- 5.1.3. Maize
- 5.1.4. Sugar
- 5.1.5. Other Raw Materials
- 5.2. Market Analysis, Insights and Forecast - by Application
- 5.2.1. Vinyl Acetate Monomer (VAM)
- 5.2.2. Acetate Esters
- 5.2.3. Purified Terephthalic Acid (PTA)
- 5.2.4. Acetic Anhydride
- 5.2.5. Other Applications
- 5.3. Market Analysis, Insights and Forecast - by Region
- 5.3.1. Asia Pacific
- 5.3.2. North America
- 5.3.3. Europe
- 5.3.4. South America
- 5.3.5. Middle East and Africa
- 5.3.6. Middle East and Africa
- 5.1. Market Analysis, Insights and Forecast - by Raw Material
- 6. Global Bio Acetic Acid Industry Analysis, Insights and Forecast, 2021-2033
- 6.1. Market Analysis, Insights and Forecast - by Raw Material
- 6.1.1. Biomass
- 6.1.2. Corn
- 6.1.3. Maize
- 6.1.4. Sugar
- 6.1.5. Other Raw Materials
- 6.2. Market Analysis, Insights and Forecast - by Application
- 6.2.1. Vinyl Acetate Monomer (VAM)
- 6.2.2. Acetate Esters
- 6.2.3. Purified Terephthalic Acid (PTA)
- 6.2.4. Acetic Anhydride
- 6.2.5. Other Applications
- 6.1. Market Analysis, Insights and Forecast - by Raw Material
- 7. Asia Pacific Bio Acetic Acid Industry Analysis, Insights and Forecast, 2020-2032
- 7.1. Market Analysis, Insights and Forecast - by Raw Material
- 7.1.1. Biomass
- 7.1.2. Corn
- 7.1.3. Maize
- 7.1.4. Sugar
- 7.1.5. Other Raw Materials
- 7.2. Market Analysis, Insights and Forecast - by Application
- 7.2.1. Vinyl Acetate Monomer (VAM)
- 7.2.2. Acetate Esters
- 7.2.3. Purified Terephthalic Acid (PTA)
- 7.2.4. Acetic Anhydride
- 7.2.5. Other Applications
- 7.1. Market Analysis, Insights and Forecast - by Raw Material
- 8. North America Bio Acetic Acid Industry Analysis, Insights and Forecast, 2020-2032
- 8.1. Market Analysis, Insights and Forecast - by Raw Material
- 8.1.1. Biomass
- 8.1.2. Corn
- 8.1.3. Maize
- 8.1.4. Sugar
- 8.1.5. Other Raw Materials
- 8.2. Market Analysis, Insights and Forecast - by Application
- 8.2.1. Vinyl Acetate Monomer (VAM)
- 8.2.2. Acetate Esters
- 8.2.3. Purified Terephthalic Acid (PTA)
- 8.2.4. Acetic Anhydride
- 8.2.5. Other Applications
- 8.1. Market Analysis, Insights and Forecast - by Raw Material
- 9. Europe Bio Acetic Acid Industry Analysis, Insights and Forecast, 2020-2032
- 9.1. Market Analysis, Insights and Forecast - by Raw Material
- 9.1.1. Biomass
- 9.1.2. Corn
- 9.1.3. Maize
- 9.1.4. Sugar
- 9.1.5. Other Raw Materials
- 9.2. Market Analysis, Insights and Forecast - by Application
- 9.2.1. Vinyl Acetate Monomer (VAM)
- 9.2.2. Acetate Esters
- 9.2.3. Purified Terephthalic Acid (PTA)
- 9.2.4. Acetic Anhydride
- 9.2.5. Other Applications
- 9.1. Market Analysis, Insights and Forecast - by Raw Material
- 10. South America Bio Acetic Acid Industry Analysis, Insights and Forecast, 2020-2032
- 10.1. Market Analysis, Insights and Forecast - by Raw Material
- 10.1.1. Biomass
- 10.1.2. Corn
- 10.1.3. Maize
- 10.1.4. Sugar
- 10.1.5. Other Raw Materials
- 10.2. Market Analysis, Insights and Forecast - by Application
- 10.2.1. Vinyl Acetate Monomer (VAM)
- 10.2.2. Acetate Esters
- 10.2.3. Purified Terephthalic Acid (PTA)
- 10.2.4. Acetic Anhydride
- 10.2.5. Other Applications
- 10.1. Market Analysis, Insights and Forecast - by Raw Material
- 11. Middle East and Africa Bio Acetic Acid Industry Analysis, Insights and Forecast, 2020-2032
- 11.1. Market Analysis, Insights and Forecast - by Raw Material
- 11.1.1. Biomass
- 11.1.2. Corn
- 11.1.3. Maize
- 11.1.4. Sugar
- 11.1.5. Other Raw Materials
- 11.2. Market Analysis, Insights and Forecast - by Application
- 11.2.1. Vinyl Acetate Monomer (VAM)
- 11.2.2. Acetate Esters
- 11.2.3. Purified Terephthalic Acid (PTA)
- 11.2.4. Acetic Anhydride
- 11.2.5. Other Applications
- 11.1. Market Analysis, Insights and Forecast - by Raw Material
- 12. Middle East and Africa Bio Acetic Acid Industry Analysis, Insights and Forecast, 2020-2032
- 12.1. Market Analysis, Insights and Forecast - by Raw Material
- 12.1.1. Biomass
- 12.1.2. Corn
- 12.1.3. Maize
- 12.1.4. Sugar
- 12.1.5. Other Raw Materials
- 12.2. Market Analysis, Insights and Forecast - by Application
- 12.2.1. Vinyl Acetate Monomer (VAM)
- 12.2.2. Acetate Esters
- 12.2.3. Purified Terephthalic Acid (PTA)
- 12.2.4. Acetic Anhydride
- 12.2.5. Other Applications
- 12.1. Market Analysis, Insights and Forecast - by Raw Material
- 13. Competitive Analysis
- 13.1. Company Profiles
- 13.1.1 AFYREN SA*List Not Exhaustive
- 13.1.1.1. Company Overview
- 13.1.1.2. Products
- 13.1.1.3. Company Financials
- 13.1.1.4. SWOT Analysis
- 13.1.2 SUCROAL S A
- 13.1.2.1. Company Overview
- 13.1.2.2. Products
- 13.1.2.3. Company Financials
- 13.1.2.4. SWOT Analysis
- 13.1.3 Cargill Incorporated
- 13.1.3.1. Company Overview
- 13.1.3.2. Products
- 13.1.3.3. Company Financials
- 13.1.3.4. SWOT Analysis
- 13.1.4 Novozymes
- 13.1.4.1. Company Overview
- 13.1.4.2. Products
- 13.1.4.3. Company Financials
- 13.1.4.4. SWOT Analysis
- 13.1.5 Zea
- 13.1.5.1. Company Overview
- 13.1.5.2. Products
- 13.1.5.3. Company Financials
- 13.1.5.4. SWOT Analysis
- 13.1.6 LanzaTech
- 13.1.6.1. Company Overview
- 13.1.6.2. Products
- 13.1.6.3. Company Financials
- 13.1.6.4. SWOT Analysis
- 13.1.7 GODAVARI BIOREFINERIES LTD
- 13.1.7.1. Company Overview
- 13.1.7.2. Products
- 13.1.7.3. Company Financials
- 13.1.7.4. SWOT Analysis
- 13.1.8 btgbioliquids
- 13.1.8.1. Company Overview
- 13.1.8.2. Products
- 13.1.8.3. Company Financials
- 13.1.8.4. SWOT Analysis
- 13.1.9 Airedale Chemical Company Limited
- 13.1.9.1. Company Overview
- 13.1.9.2. Products
- 13.1.9.3. Company Financials
- 13.1.9.4. SWOT Analysis
- 13.1.10 BASF SE
- 13.1.10.1. Company Overview
- 13.1.10.2. Products
- 13.1.10.3. Company Financials
- 13.1.10.4. SWOT Analysis
- 13.1.1 AFYREN SA*List Not Exhaustive
- 13.2. Market Entropy
- 13.2.1 Company's Key Areas Served
- 13.2.2 Recent Developments
- 13.3. Company Market Share Analysis 2025
- 13.3.1 Top 5 Companies Market Share Analysis
- 13.3.2 Top 3 Companies Market Share Analysis
- 13.4. List of Potential Customers
- 14. Research Methodology
List of Figures
- Figure 1: Global Bio Acetic Acid Industry Revenue Breakdown (Million, %) by Region 2025 & 2033
- Figure 2: Global Bio Acetic Acid Industry Volume Breakdown (K Tons, %) by Region 2025 & 2033
- Figure 3: Asia Pacific Bio Acetic Acid Industry Revenue (Million), by Raw Material 2025 & 2033
- Figure 4: Asia Pacific Bio Acetic Acid Industry Volume (K Tons), by Raw Material 2025 & 2033
- Figure 5: Asia Pacific Bio Acetic Acid Industry Revenue Share (%), by Raw Material 2025 & 2033
- Figure 6: Asia Pacific Bio Acetic Acid Industry Volume Share (%), by Raw Material 2025 & 2033
- Figure 7: Asia Pacific Bio Acetic Acid Industry Revenue (Million), by Application 2025 & 2033
- Figure 8: Asia Pacific Bio Acetic Acid Industry Volume (K Tons), by Application 2025 & 2033
- Figure 9: Asia Pacific Bio Acetic Acid Industry Revenue Share (%), by Application 2025 & 2033
- Figure 10: Asia Pacific Bio Acetic Acid Industry Volume Share (%), by Application 2025 & 2033
- Figure 11: Asia Pacific Bio Acetic Acid Industry Revenue (Million), by Country 2025 & 2033
- Figure 12: Asia Pacific Bio Acetic Acid Industry Volume (K Tons), by Country 2025 & 2033
- Figure 13: Asia Pacific Bio Acetic Acid Industry Revenue Share (%), by Country 2025 & 2033
- Figure 14: Asia Pacific Bio Acetic Acid Industry Volume Share (%), by Country 2025 & 2033
- Figure 15: North America Bio Acetic Acid Industry Revenue (Million), by Raw Material 2025 & 2033
- Figure 16: North America Bio Acetic Acid Industry Volume (K Tons), by Raw Material 2025 & 2033
- Figure 17: North America Bio Acetic Acid Industry Revenue Share (%), by Raw Material 2025 & 2033
- Figure 18: North America Bio Acetic Acid Industry Volume Share (%), by Raw Material 2025 & 2033
- Figure 19: North America Bio Acetic Acid Industry Revenue (Million), by Application 2025 & 2033
- Figure 20: North America Bio Acetic Acid Industry Volume (K Tons), by Application 2025 & 2033
- Figure 21: North America Bio Acetic Acid Industry Revenue Share (%), by Application 2025 & 2033
- Figure 22: North America Bio Acetic Acid Industry Volume Share (%), by Application 2025 & 2033
- Figure 23: North America Bio Acetic Acid Industry Revenue (Million), by Country 2025 & 2033
- Figure 24: North America Bio Acetic Acid Industry Volume (K Tons), by Country 2025 & 2033
- Figure 25: North America Bio Acetic Acid Industry Revenue Share (%), by Country 2025 & 2033
- Figure 26: North America Bio Acetic Acid Industry Volume Share (%), by Country 2025 & 2033
- Figure 27: Europe Bio Acetic Acid Industry Revenue (Million), by Raw Material 2025 & 2033
- Figure 28: Europe Bio Acetic Acid Industry Volume (K Tons), by Raw Material 2025 & 2033
- Figure 29: Europe Bio Acetic Acid Industry Revenue Share (%), by Raw Material 2025 & 2033
- Figure 30: Europe Bio Acetic Acid Industry Volume Share (%), by Raw Material 2025 & 2033
- Figure 31: Europe Bio Acetic Acid Industry Revenue (Million), by Application 2025 & 2033
- Figure 32: Europe Bio Acetic Acid Industry Volume (K Tons), by Application 2025 & 2033
- Figure 33: Europe Bio Acetic Acid Industry Revenue Share (%), by Application 2025 & 2033
- Figure 34: Europe Bio Acetic Acid Industry Volume Share (%), by Application 2025 & 2033
- Figure 35: Europe Bio Acetic Acid Industry Revenue (Million), by Country 2025 & 2033
- Figure 36: Europe Bio Acetic Acid Industry Volume (K Tons), by Country 2025 & 2033
- Figure 37: Europe Bio Acetic Acid Industry Revenue Share (%), by Country 2025 & 2033
- Figure 38: Europe Bio Acetic Acid Industry Volume Share (%), by Country 2025 & 2033
- Figure 39: South America Bio Acetic Acid Industry Revenue (Million), by Raw Material 2025 & 2033
- Figure 40: South America Bio Acetic Acid Industry Volume (K Tons), by Raw Material 2025 & 2033
- Figure 41: South America Bio Acetic Acid Industry Revenue Share (%), by Raw Material 2025 & 2033
- Figure 42: South America Bio Acetic Acid Industry Volume Share (%), by Raw Material 2025 & 2033
- Figure 43: South America Bio Acetic Acid Industry Revenue (Million), by Application 2025 & 2033
- Figure 44: South America Bio Acetic Acid Industry Volume (K Tons), by Application 2025 & 2033
- Figure 45: South America Bio Acetic Acid Industry Revenue Share (%), by Application 2025 & 2033
- Figure 46: South America Bio Acetic Acid Industry Volume Share (%), by Application 2025 & 2033
- Figure 47: South America Bio Acetic Acid Industry Revenue (Million), by Country 2025 & 2033
- Figure 48: South America Bio Acetic Acid Industry Volume (K Tons), by Country 2025 & 2033
- Figure 49: South America Bio Acetic Acid Industry Revenue Share (%), by Country 2025 & 2033
- Figure 50: South America Bio Acetic Acid Industry Volume Share (%), by Country 2025 & 2033
- Figure 51: Middle East and Africa Bio Acetic Acid Industry Revenue (Million), by Raw Material 2025 & 2033
- Figure 52: Middle East and Africa Bio Acetic Acid Industry Volume (K Tons), by Raw Material 2025 & 2033
- Figure 53: Middle East and Africa Bio Acetic Acid Industry Revenue Share (%), by Raw Material 2025 & 2033
- Figure 54: Middle East and Africa Bio Acetic Acid Industry Volume Share (%), by Raw Material 2025 & 2033
- Figure 55: Middle East and Africa Bio Acetic Acid Industry Revenue (Million), by Application 2025 & 2033
- Figure 56: Middle East and Africa Bio Acetic Acid Industry Volume (K Tons), by Application 2025 & 2033
- Figure 57: Middle East and Africa Bio Acetic Acid Industry Revenue Share (%), by Application 2025 & 2033
- Figure 58: Middle East and Africa Bio Acetic Acid Industry Volume Share (%), by Application 2025 & 2033
- Figure 59: Middle East and Africa Bio Acetic Acid Industry Revenue (Million), by Country 2025 & 2033
- Figure 60: Middle East and Africa Bio Acetic Acid Industry Volume (K Tons), by Country 2025 & 2033
- Figure 61: Middle East and Africa Bio Acetic Acid Industry Revenue Share (%), by Country 2025 & 2033
- Figure 62: Middle East and Africa Bio Acetic Acid Industry Volume Share (%), by Country 2025 & 2033
- Figure 63: Middle East and Africa Bio Acetic Acid Industry Revenue (Million), by Raw Material 2025 & 2033
- Figure 64: Middle East and Africa Bio Acetic Acid Industry Volume (K Tons), by Raw Material 2025 & 2033
- Figure 65: Middle East and Africa Bio Acetic Acid Industry Revenue Share (%), by Raw Material 2025 & 2033
- Figure 66: Middle East and Africa Bio Acetic Acid Industry Volume Share (%), by Raw Material 2025 & 2033
- Figure 67: Middle East and Africa Bio Acetic Acid Industry Revenue (Million), by Application 2025 & 2033
- Figure 68: Middle East and Africa Bio Acetic Acid Industry Volume (K Tons), by Application 2025 & 2033
- Figure 69: Middle East and Africa Bio Acetic Acid Industry Revenue Share (%), by Application 2025 & 2033
- Figure 70: Middle East and Africa Bio Acetic Acid Industry Volume Share (%), by Application 2025 & 2033
- Figure 71: Middle East and Africa Bio Acetic Acid Industry Revenue (Million), by Country 2025 & 2033
- Figure 72: Middle East and Africa Bio Acetic Acid Industry Volume (K Tons), by Country 2025 & 2033
- Figure 73: Middle East and Africa Bio Acetic Acid Industry Revenue Share (%), by Country 2025 & 2033
- Figure 74: Middle East and Africa Bio Acetic Acid Industry Volume Share (%), by Country 2025 & 2033
List of Tables
- Table 1: Global Bio Acetic Acid Industry Revenue Million Forecast, by Raw Material 2020 & 2033
- Table 2: Global Bio Acetic Acid Industry Volume K Tons Forecast, by Raw Material 2020 & 2033
- Table 3: Global Bio Acetic Acid Industry Revenue Million Forecast, by Application 2020 & 2033
- Table 4: Global Bio Acetic Acid Industry Volume K Tons Forecast, by Application 2020 & 2033
- Table 5: Global Bio Acetic Acid Industry Revenue Million Forecast, by Region 2020 & 2033
- Table 6: Global Bio Acetic Acid Industry Volume K Tons Forecast, by Region 2020 & 2033
- Table 7: Global Bio Acetic Acid Industry Revenue Million Forecast, by Raw Material 2020 & 2033
- Table 8: Global Bio Acetic Acid Industry Volume K Tons Forecast, by Raw Material 2020 & 2033
- Table 9: Global Bio Acetic Acid Industry Revenue Million Forecast, by Application 2020 & 2033
- Table 10: Global Bio Acetic Acid Industry Volume K Tons Forecast, by Application 2020 & 2033
- Table 11: Global Bio Acetic Acid Industry Revenue Million Forecast, by Country 2020 & 2033
- Table 12: Global Bio Acetic Acid Industry Volume K Tons Forecast, by Country 2020 & 2033
- Table 13: China Bio Acetic Acid Industry Revenue (Million) Forecast, by Application 2020 & 2033
- Table 14: China Bio Acetic Acid Industry Volume (K Tons) Forecast, by Application 2020 & 2033
- Table 15: India Bio Acetic Acid Industry Revenue (Million) Forecast, by Application 2020 & 2033
- Table 16: India Bio Acetic Acid Industry Volume (K Tons) Forecast, by Application 2020 & 2033
- Table 17: Japan Bio Acetic Acid Industry Revenue (Million) Forecast, by Application 2020 & 2033
- Table 18: Japan Bio Acetic Acid Industry Volume (K Tons) Forecast, by Application 2020 & 2033
- Table 19: South Korea Bio Acetic Acid Industry Revenue (Million) Forecast, by Application 2020 & 2033
- Table 20: South Korea Bio Acetic Acid Industry Volume (K Tons) Forecast, by Application 2020 & 2033
- Table 21: Malaysia Bio Acetic Acid Industry Revenue (Million) Forecast, by Application 2020 & 2033
- Table 22: Malaysia Bio Acetic Acid Industry Volume (K Tons) Forecast, by Application 2020 & 2033
- Table 23: Thailand Bio Acetic Acid Industry Revenue (Million) Forecast, by Application 2020 & 2033
- Table 24: Thailand Bio Acetic Acid Industry Volume (K Tons) Forecast, by Application 2020 & 2033
- Table 25: Indonesia Bio Acetic Acid Industry Revenue (Million) Forecast, by Application 2020 & 2033
- Table 26: Indonesia Bio Acetic Acid Industry Volume (K Tons) Forecast, by Application 2020 & 2033
- Table 27: Vietnam Bio Acetic Acid Industry Revenue (Million) Forecast, by Application 2020 & 2033
- Table 28: Vietnam Bio Acetic Acid Industry Volume (K Tons) Forecast, by Application 2020 & 2033
- Table 29: Rest of Asia Pacific Bio Acetic Acid Industry Revenue (Million) Forecast, by Application 2020 & 2033
- Table 30: Rest of Asia Pacific Bio Acetic Acid Industry Volume (K Tons) Forecast, by Application 2020 & 2033
- Table 31: Global Bio Acetic Acid Industry Revenue Million Forecast, by Raw Material 2020 & 2033
- Table 32: Global Bio Acetic Acid Industry Volume K Tons Forecast, by Raw Material 2020 & 2033
- Table 33: Global Bio Acetic Acid Industry Revenue Million Forecast, by Application 2020 & 2033
- Table 34: Global Bio Acetic Acid Industry Volume K Tons Forecast, by Application 2020 & 2033
- Table 35: Global Bio Acetic Acid Industry Revenue Million Forecast, by Country 2020 & 2033
- Table 36: Global Bio Acetic Acid Industry Volume K Tons Forecast, by Country 2020 & 2033
- Table 37: United States Bio Acetic Acid Industry Revenue (Million) Forecast, by Application 2020 & 2033
- Table 38: United States Bio Acetic Acid Industry Volume (K Tons) Forecast, by Application 2020 & 2033
- Table 39: Canada Bio Acetic Acid Industry Revenue (Million) Forecast, by Application 2020 & 2033
- Table 40: Canada Bio Acetic Acid Industry Volume (K Tons) Forecast, by Application 2020 & 2033
- Table 41: Mexico Bio Acetic Acid Industry Revenue (Million) Forecast, by Application 2020 & 2033
- Table 42: Mexico Bio Acetic Acid Industry Volume (K Tons) Forecast, by Application 2020 & 2033
- Table 43: Global Bio Acetic Acid Industry Revenue Million Forecast, by Raw Material 2020 & 2033
- Table 44: Global Bio Acetic Acid Industry Volume K Tons Forecast, by Raw Material 2020 & 2033
- Table 45: Global Bio Acetic Acid Industry Revenue Million Forecast, by Application 2020 & 2033
- Table 46: Global Bio Acetic Acid Industry Volume K Tons Forecast, by Application 2020 & 2033
- Table 47: Global Bio Acetic Acid Industry Revenue Million Forecast, by Country 2020 & 2033
- Table 48: Global Bio Acetic Acid Industry Volume K Tons Forecast, by Country 2020 & 2033
- Table 49: Germany Bio Acetic Acid Industry Revenue (Million) Forecast, by Application 2020 & 2033
- Table 50: Germany Bio Acetic Acid Industry Volume (K Tons) Forecast, by Application 2020 & 2033
- Table 51: United Kingdom Bio Acetic Acid Industry Revenue (Million) Forecast, by Application 2020 & 2033
- Table 52: United Kingdom Bio Acetic Acid Industry Volume (K Tons) Forecast, by Application 2020 & 2033
- Table 53: Italy Bio Acetic Acid Industry Revenue (Million) Forecast, by Application 2020 & 2033
- Table 54: Italy Bio Acetic Acid Industry Volume (K Tons) Forecast, by Application 2020 & 2033
- Table 55: France Bio Acetic Acid Industry Revenue (Million) Forecast, by Application 2020 & 2033
- Table 56: France Bio Acetic Acid Industry Volume (K Tons) Forecast, by Application 2020 & 2033
- Table 57: Spain Bio Acetic Acid Industry Revenue (Million) Forecast, by Application 2020 & 2033
- Table 58: Spain Bio Acetic Acid Industry Volume (K Tons) Forecast, by Application 2020 & 2033
- Table 59: NORDIC Countries Bio Acetic Acid Industry Revenue (Million) Forecast, by Application 2020 & 2033
- Table 60: NORDIC Countries Bio Acetic Acid Industry Volume (K Tons) Forecast, by Application 2020 & 2033
- Table 61: Turkey Bio Acetic Acid Industry Revenue (Million) Forecast, by Application 2020 & 2033
- Table 62: Turkey Bio Acetic Acid Industry Volume (K Tons) Forecast, by Application 2020 & 2033
- Table 63: Russia Bio Acetic Acid Industry Revenue (Million) Forecast, by Application 2020 & 2033
- Table 64: Russia Bio Acetic Acid Industry Volume (K Tons) Forecast, by Application 2020 & 2033
- Table 65: Rest of Europe Bio Acetic Acid Industry Revenue (Million) Forecast, by Application 2020 & 2033
- Table 66: Rest of Europe Bio Acetic Acid Industry Volume (K Tons) Forecast, by Application 2020 & 2033
- Table 67: Global Bio Acetic Acid Industry Revenue Million Forecast, by Raw Material 2020 & 2033
- Table 68: Global Bio Acetic Acid Industry Volume K Tons Forecast, by Raw Material 2020 & 2033
- Table 69: Global Bio Acetic Acid Industry Revenue Million Forecast, by Application 2020 & 2033
- Table 70: Global Bio Acetic Acid Industry Volume K Tons Forecast, by Application 2020 & 2033
- Table 71: Global Bio Acetic Acid Industry Revenue Million Forecast, by Country 2020 & 2033
- Table 72: Global Bio Acetic Acid Industry Volume K Tons Forecast, by Country 2020 & 2033
- Table 73: Brazil Bio Acetic Acid Industry Revenue (Million) Forecast, by Application 2020 & 2033
- Table 74: Brazil Bio Acetic Acid Industry Volume (K Tons) Forecast, by Application 2020 & 2033
- Table 75: Argentina Bio Acetic Acid Industry Revenue (Million) Forecast, by Application 2020 & 2033
- Table 76: Argentina Bio Acetic Acid Industry Volume (K Tons) Forecast, by Application 2020 & 2033
- Table 77: Colombia Bio Acetic Acid Industry Revenue (Million) Forecast, by Application 2020 & 2033
- Table 78: Colombia Bio Acetic Acid Industry Volume (K Tons) Forecast, by Application 2020 & 2033
- Table 79: Rest of South America Bio Acetic Acid Industry Revenue (Million) Forecast, by Application 2020 & 2033
- Table 80: Rest of South America Bio Acetic Acid Industry Volume (K Tons) Forecast, by Application 2020 & 2033
- Table 81: Global Bio Acetic Acid Industry Revenue Million Forecast, by Raw Material 2020 & 2033
- Table 82: Global Bio Acetic Acid Industry Volume K Tons Forecast, by Raw Material 2020 & 2033
- Table 83: Global Bio Acetic Acid Industry Revenue Million Forecast, by Application 2020 & 2033
- Table 84: Global Bio Acetic Acid Industry Volume K Tons Forecast, by Application 2020 & 2033
- Table 85: Global Bio Acetic Acid Industry Revenue Million Forecast, by Country 2020 & 2033
- Table 86: Global Bio Acetic Acid Industry Volume K Tons Forecast, by Country 2020 & 2033
- Table 87: Qatar Bio Acetic Acid Industry Revenue (Million) Forecast, by Application 2020 & 2033
- Table 88: Qatar Bio Acetic Acid Industry Volume (K Tons) Forecast, by Application 2020 & 2033
- Table 89: United Arab Emirates Bio Acetic Acid Industry Revenue (Million) Forecast, by Application 2020 & 2033
- Table 90: United Arab Emirates Bio Acetic Acid Industry Volume (K Tons) Forecast, by Application 2020 & 2033
- Table 91: Nigeria Bio Acetic Acid Industry Revenue (Million) Forecast, by Application 2020 & 2033
- Table 92: Nigeria Bio Acetic Acid Industry Volume (K Tons) Forecast, by Application 2020 & 2033
- Table 93: Egypt Bio Acetic Acid Industry Revenue (Million) Forecast, by Application 2020 & 2033
- Table 94: Egypt Bio Acetic Acid Industry Volume (K Tons) Forecast, by Application 2020 & 2033
- Table 95: South Africa Bio Acetic Acid Industry Revenue (Million) Forecast, by Application 2020 & 2033
- Table 96: South Africa Bio Acetic Acid Industry Volume (K Tons) Forecast, by Application 2020 & 2033
- Table 97: Rest of Middle East and Africa Bio Acetic Acid Industry Revenue (Million) Forecast, by Application 2020 & 2033
- Table 98: Rest of Middle East and Africa Bio Acetic Acid Industry Volume (K Tons) Forecast, by Application 2020 & 2033
- Table 99: Global Bio Acetic Acid Industry Revenue Million Forecast, by Raw Material 2020 & 2033
- Table 100: Global Bio Acetic Acid Industry Volume K Tons Forecast, by Raw Material 2020 & 2033
- Table 101: Global Bio Acetic Acid Industry Revenue Million Forecast, by Application 2020 & 2033
- Table 102: Global Bio Acetic Acid Industry Volume K Tons Forecast, by Application 2020 & 2033
- Table 103: Global Bio Acetic Acid Industry Revenue Million Forecast, by Country 2020 & 2033
- Table 104: Global Bio Acetic Acid Industry Volume K Tons Forecast, by Country 2020 & 2033
- Table 105: Saudi Arabia Bio Acetic Acid Industry Revenue (Million) Forecast, by Application 2020 & 2033
- Table 106: Saudi Arabia Bio Acetic Acid Industry Volume (K Tons) Forecast, by Application 2020 & 2033
- Table 107: South Africa Bio Acetic Acid Industry Revenue (Million) Forecast, by Application 2020 & 2033
- Table 108: South Africa Bio Acetic Acid Industry Volume (K Tons) Forecast, by Application 2020 & 2033
- Table 109: Rest of Middle East and Africa Bio Acetic Acid Industry Revenue (Million) Forecast, by Application 2020 & 2033
- Table 110: Rest of Middle East and Africa Bio Acetic Acid Industry Volume (K Tons) Forecast, by Application 2020 & 2033
Frequently Asked Questions
1. What is the projected Compound Annual Growth Rate (CAGR) of the Bio Acetic Acid Industry?
The projected CAGR is approximately > 4.00%.
2. Which companies are prominent players in the Bio Acetic Acid Industry?
Key companies in the market include AFYREN SA*List Not Exhaustive, SUCROAL S A, Cargill Incorporated, Novozymes, Zea, LanzaTech, GODAVARI BIOREFINERIES LTD, btgbioliquids, Airedale Chemical Company Limited, BASF SE.
3. What are the main segments of the Bio Acetic Acid Industry?
The market segments include Raw Material, Application.
4. Can you provide details about the market size?
The market size is estimated to be USD 220.6 Million as of 2022.
5. What are some drivers contributing to market growth?
Rising Crude Oil Prices; Increasing Demand for Vinyl Acetate Monomer (VAM).
6. What are the notable trends driving market growth?
Vinyl Acetate Monomer (VAM) Segment to Dominate the Market.
7. Are there any restraints impacting market growth?
Scarcity and Social Constraints for Raw Materials; Environmental Concerns Regarding the Harmful Effects.
8. Can you provide examples of recent developments in the market?
July 2022: Novozymes launched Innova Apex and Innova Turbo, advanced yeast solutions that can tolerate up to 0.6% lactic acid and 0.4% acetic acid and 0.8% lactic acid, and 0.4% acetic acid, respectively. The solutions are tailored to work in specific fermentation times, enabling ethanol producers to maximize their fermentation process to achieve their desired production targets.
9. What pricing options are available for accessing the report?
Pricing options include single-user, multi-user, and enterprise licenses priced at USD 4750, USD 5250, and USD 8750 respectively.
10. Is the market size provided in terms of value or volume?
The market size is provided in terms of value, measured in Million and volume, measured in K Tons.
11. Are there any specific market keywords associated with the report?
Yes, the market keyword associated with the report is "Bio Acetic Acid Industry," which aids in identifying and referencing the specific market segment covered.
12. How do I determine which pricing option suits my needs best?
The pricing options vary based on user requirements and access needs. Individual users may opt for single-user licenses, while businesses requiring broader access may choose multi-user or enterprise licenses for cost-effective access to the report.
13. Are there any additional resources or data provided in the Bio Acetic Acid Industry report?
While the report offers comprehensive insights, it's advisable to review the specific contents or supplementary materials provided to ascertain if additional resources or data are available.
14. How can I stay updated on further developments or reports in the Bio Acetic Acid Industry?
To stay informed about further developments, trends, and reports in the Bio Acetic Acid Industry, consider subscribing to industry newsletters, following relevant companies and organizations, or regularly checking reputable industry news sources and publications.
Methodology
Step 1 - Identification of Relevant Samples Size from Population Database


Step 2 - Approaches for Defining Global Market Size (Value, Volume* & Price*)

Note*: In applicable scenarios
Step 3 - Data Sources
Primary Research
- Web Analytics
- Survey Reports
- Research Institute
- Latest Research Reports
- Opinion Leaders
Secondary Research
- Annual Reports
- White Paper
- Latest Press Release
- Industry Association
- Paid Database
- Investor Presentations

Step 4 - Data Triangulation
Involves using different sources of information in order to increase the validity of a study
These sources are likely to be stakeholders in a program - participants, other researchers, program staff, other community members, and so on.
Then we put all data in single framework & apply various statistical tools to find out the dynamic on the market.
During the analysis stage, feedback from the stakeholder groups would be compared to determine areas of agreement as well as areas of divergence