

Key Insights
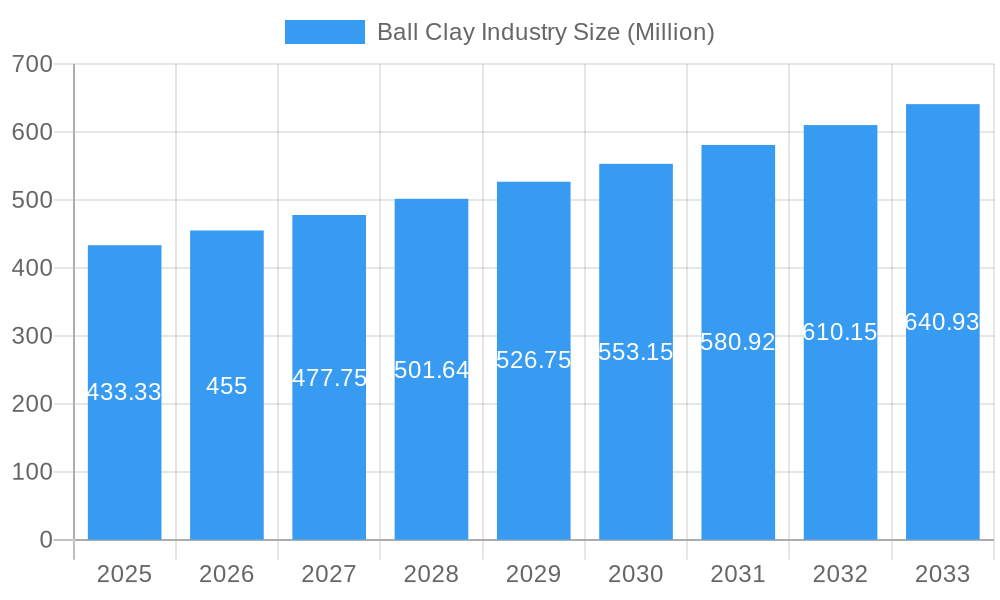
The global Ball Clay market is poised for robust growth, with a projected market size of USD 433.33 million in 2025 and a Compound Annual Growth Rate (CAGR) of 5.07% anticipated between 2025 and 2033. This expansion is significantly driven by the burgeoning demand from the ceramic sector, particularly in applications like sanitary ware, wall and floor tiles, and tableware. The inherent properties of ball clay, such as its high plasticity, binding strength, and firing characteristics, make it an indispensable component in these traditional ceramic products. Furthermore, the increasing construction activities and the rising disposable incomes in emerging economies are fueling the demand for these end-use products, thereby translating into a consistent demand for ball clay. Beyond ceramics, the non-ceramic applications are also contributing to market expansion, with adhesives and sealants, rubbers and plastics, and fertilizers and insecticides showcasing promising growth trajectories. The continued innovation in material science and the exploration of new applications for ball clay will further bolster its market presence.
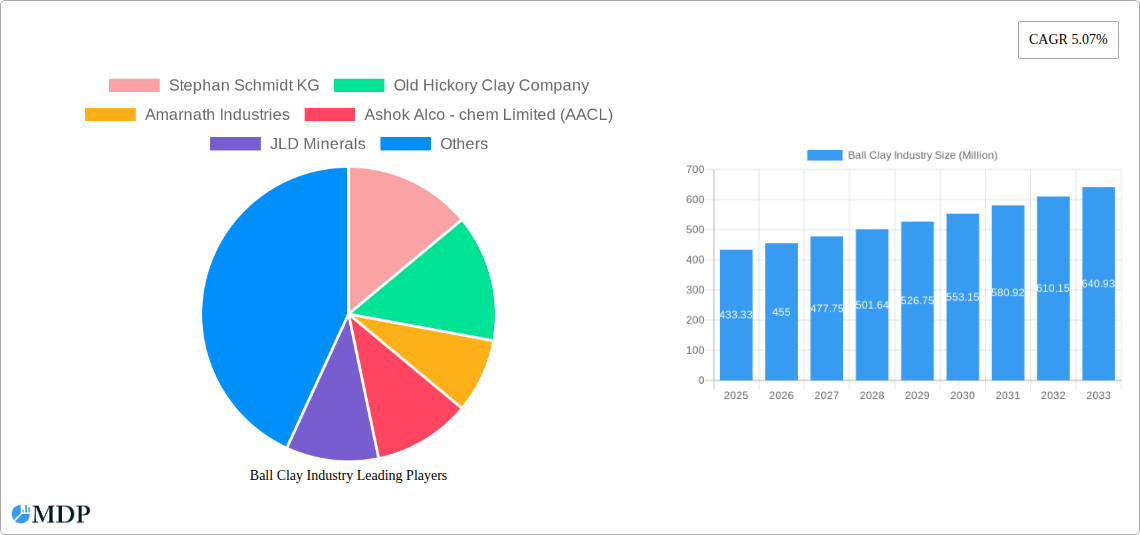
Ball Clay Industry Market Size (In Million)
The market's growth is further supported by favorable economic conditions and the increasing adoption of advanced manufacturing techniques across key regions. Asia Pacific, led by China and India, is expected to remain the dominant market, owing to its massive manufacturing base and escalating domestic consumption. North America and Europe, while mature markets, will continue to exhibit steady growth, driven by technological advancements and the demand for high-quality ceramic products. Restrains such as environmental regulations concerning mining and processing, coupled with the volatility of raw material prices, could pose challenges. However, the industry is actively working towards sustainable mining practices and exploring cost-effective alternatives. The presence of established players like Imerys, Sibelco, and Stephan Schmidt KG, along with emerging regional manufacturers, indicates a competitive yet dynamic market landscape, fostering innovation and ensuring supply chain stability.
Ball Clay Industry Company Market Share
Ball Clay Industry Report: Market Insights, Trends, and Future Outlook (2019–2033)
This comprehensive report delves into the global Ball Clay Industry, providing in-depth analysis of market dynamics, growth drivers, challenges, and future opportunities. Covering the study period from 2019 to 2033, with a base year of 2025, this report offers actionable insights for industry stakeholders, investors, and decision-makers. We analyze key players, emerging trends, and the impact of technological advancements on ceramic and non-ceramic applications.
Ball Clay Industry Market Dynamics & Concentration
The global Ball Clay Industry is characterized by moderate market concentration, with key players like Imerys and Sibelco holding significant market share. In 2025, the estimated market share of the top 5 players is projected to be around 45%. Innovation drivers are largely focused on enhancing the functional properties of ball clay for specialized applications, including improved plasticity, strength, and firing characteristics. Regulatory frameworks, particularly concerning environmental impact and mining practices, are becoming increasingly stringent, influencing production methods and market access. Product substitutes, such as alternative clays or engineered materials, pose a limited threat in core applications where ball clay's unique properties are indispensable. End-user trends indicate a growing demand for sustainable and high-performance materials in both ceramic and non-ceramic sectors. Mergers and acquisitions (M&A) activities have been sporadic but significant, aimed at consolidating market presence and expanding product portfolios. The number of reported M&A deals in the historical period (2019-2024) was approximately 15, indicating strategic consolidation efforts.
Ball Clay Industry Industry Trends & Analysis
The Ball Clay Industry is poised for steady growth, driven by escalating demand from the burgeoning construction and manufacturing sectors. The global Ball Clay Industry is projected to witness a Compound Annual Growth Rate (CAGR) of approximately 4.2% during the forecast period of 2025–2033. This expansion is fueled by the increasing consumption of ceramics, particularly in sanitary ware, wall and floor tiles, and tableware, where ball clay is a crucial raw material for its plasticity and firing properties. Technological disruptions are emerging in the form of advanced processing techniques that enhance the quality and consistency of ball clay, leading to improved product performance. Consumer preferences are shifting towards aesthetically pleasing and durable ceramic products, indirectly boosting ball clay demand. In the non-ceramic segment, ball clay finds applications in adhesives, sealants, rubber, and plastic formulations, benefiting from the growth in automotive, construction, and industrial manufacturing. Market penetration for specialized ball clay grades is increasing as manufacturers develop tailor-made solutions for niche applications. The historical period (2019-2024) saw a steady uptake in ball clay adoption across diverse industries, laying a robust foundation for future market expansion. The estimated market size in 2025 is valued at over $2.5 Billion.
Leading Markets & Segments in Ball Clay Industry
The dominant region for the Ball Clay Industry is Asia-Pacific, driven by the robust economic growth and rapid industrialization in countries like China and India. Within the End Use segments, Ceramic applications represent the largest market share.
Ceramic Segment Dominance:
- Sanitary Ware: This segment is a significant driver due to increasing urbanization and rising disposable incomes, leading to higher demand for bathroom fixtures. The market for sanitary ware is estimated to reach over $1 Billion in 2025.
- Wall and Floor Tiles: The construction boom across emerging economies fuels substantial demand for tiles, where ball clay contributes to workability and strength.
- Tableware: Growing consumer spending on home décor and kitchenware supports the demand for ceramic tableware.
- Bricks: While a more traditional application, ball clay remains essential for producing high-quality bricks in construction.
- Other Ceramics: This includes a range of industrial ceramics, electrical insulators, and technical ceramics.
Non-Ceramic Segment Growth:
- Adhesives and Sealants: Ball clay's inertness and filler properties make it valuable in these formulations for construction and industrial applications.
- Rubbers and Plastics: It acts as a reinforcing filler and processing aid, enhancing the mechanical properties of rubber and plastic products. The market for ball clay in this segment is projected to exceed $300 Million in 2025.
- Fertilizers and Insecticides: Ball clay serves as a carrier and conditioner in agricultural chemicals.
- Other Non-ceramics: Encompasses applications in paints, coatings, and pharmaceuticals.
Economic policies promoting manufacturing and infrastructure development, coupled with consumer demand for durable and aesthetically pleasing products, are key accelerators for the dominance of these segments and regions.
Ball Clay Industry Product Developments
Product development in the Ball Clay Industry is increasingly focused on enhancing functional properties and sustainability. Innovations include specialized grades with improved plasticity for intricate ceramic designs, enhanced firing characteristics for energy efficiency, and refined particle size distributions for advanced non-ceramic applications. Competitive advantages are being carved out through the development of high-purity ball clays with reduced impurities, catering to sensitive applications in electronics and specialized coatings. Technological trends are also leading to the exploration of beneficiation techniques to extract higher-value properties from existing deposits, optimizing resource utilization and market fit for a wider array of industrial needs.
Key Drivers of Ball Clay Industry Growth
The Ball Clay Industry's growth is propelled by several key factors. Economically, the sustained demand from the global construction sector, particularly for sanitary ware and tiles, is a primary driver. Technologically, advancements in processing and beneficiation techniques allow for the production of higher-quality and specialized ball clay grades, meeting stringent industry requirements. Regulatory frameworks, while sometimes posing challenges, also create opportunities for companies adopting sustainable mining and manufacturing practices. The growing demand for durable and aesthetically appealing ceramic products, coupled with the use of ball clay as an essential functional filler in various non-ceramic applications, further bolsters market expansion.
Challenges in the Ball Clay Industry Market
Despite its growth potential, the Ball Clay Industry faces several challenges. Stringent environmental regulations concerning mining operations and waste disposal can increase operational costs and limit new project developments. Supply chain disruptions, particularly those related to logistics and transportation, can impact the timely delivery of raw materials and finished products. Competitive pressures from alternative materials, though limited in core applications, can influence pricing and market share in certain segments. Fluctuations in energy prices also affect the cost of production. The estimated impact of these challenges on market growth is a potential reduction of 0.5% in the projected CAGR.
Emerging Opportunities in Ball Clay Industry
Emerging opportunities in the Ball Clay Industry lie in several key areas. Technological breakthroughs in processing and beneficiation are creating pathways for the development of novel ball clay products with unique properties, opening doors to new and high-value applications in advanced ceramics and specialized industrial materials. Strategic partnerships between mining companies and end-users can foster collaborative innovation and tailor-made product development. Market expansion into developing economies with rapidly growing construction and manufacturing sectors presents significant growth potential. Furthermore, the increasing focus on sustainability and circular economy principles is driving demand for responsibly sourced and processed ball clay.
Leading Players in the Ball Clay Industry Sector
- Stephan Schmidt KG
- Old Hickory Clay Company
- Amarnath Industries
- Ashok Alco - chem Limited (AACL)
- JLD Minerals
- Imerys
- Mota Ceramic Solutions
- Modkha Marine Sdn Bhd
- Gujarat Mineral Development Corporation Ltd
- Sibelco
- Golcha Associated (Associated Soapstone Distribution Company Pvt Ltd)
Key Milestones in Ball Clay Industry Industry
- 2019: Increased focus on sustainable mining practices and environmental compliance across major producing regions.
- 2020: Impact of global supply chain disruptions due to the pandemic, leading to price volatility.
- 2021: Emergence of advanced beneficiation techniques to improve ball clay quality and expand application potential.
- 2022: Growing demand for specialized ball clay grades in the electronics and automotive sectors.
- 2023: Increased investment in R&D for developing novel ceramic formulations utilizing enhanced ball clay properties.
- 2024: Greater emphasis on digitalization in mining operations for improved efficiency and safety.
Strategic Outlook for Ball Clay Industry Market
The strategic outlook for the Ball Clay Industry remains positive, with a strong emphasis on innovation and sustainability. Growth accelerators will stem from the continued expansion of the ceramic sector, particularly in emerging markets, and the increasing adoption of ball clay in high-performance non-ceramic applications. Companies that invest in advanced processing technologies, focus on environmental stewardship, and forge strategic partnerships will be well-positioned for success. The market is expected to witness a steady upward trajectory, driven by global infrastructure development and the ongoing demand for essential industrial raw materials.
Ball Clay Industry Segmentation
-
1. End Use
-
1.1. Ceramic
- 1.1.1. Sanitary Ware
- 1.1.2. Wall and Floor Tiles
- 1.1.3. Tableware
- 1.1.4. Bricks
- 1.1.5. Other Ce
-
1.2. Non-ceramic
- 1.2.1. Adhesives and Sealants
- 1.2.2. Rubbers and Plastics
- 1.2.3. Fertilizers and Insecticides
- 1.2.4. Other Non-ceramics
-
1.1. Ceramic
Ball Clay Industry Segmentation By Geography
-
1. Asia Pacific
- 1.1. China
- 1.2. India
- 1.3. Japan
- 1.4. South Korea
- 1.5. Rest of Asia Pacific
-
2. North America
- 2.1. United States
- 2.2. Canada
- 2.3. Mexico
-
3. Europe
- 3.1. Germany
- 3.2. United Kingdom
- 3.3. Italy
- 3.4. France
- 3.5. Spain
- 3.6. Rest of Europe
-
4. South America
- 4.1. Brazil
- 4.2. Argentina
- 4.3. Rest of South America
-
5. Middle East and Africa
- 5.1. Saudi Arabia
- 5.2. South Africa
- 5.3. Rest of Middle East and Africa
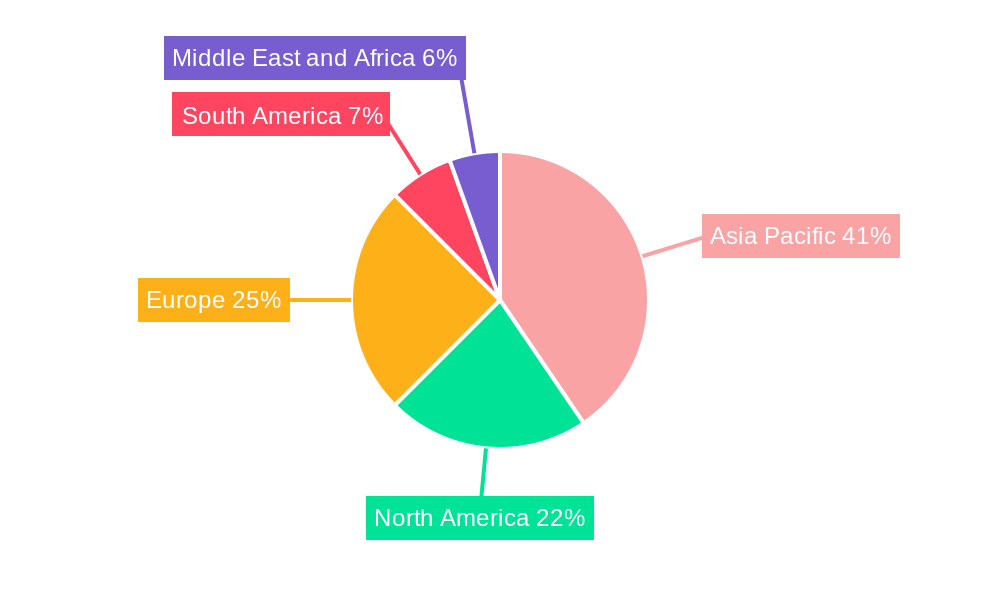
Ball Clay Industry Regional Market Share
Geographic Coverage of Ball Clay Industry
Ball Clay Industry REPORT HIGHLIGHTS
| Aspects | Details |
|---|---|
| Study Period | 2020-2034 |
| Base Year | 2025 |
| Estimated Year | 2026 |
| Forecast Period | 2026-2034 |
| Historical Period | 2020-2025 |
| Growth Rate | CAGR of 5.07% from 2020-2034 |
| Segmentation |
|
Table of Contents
- 1. Introduction
- 1.1. Research Scope
- 1.2. Market Segmentation
- 1.3. Research Objective
- 1.4. Definitions and Assumptions
- 2. Executive Summary
- 2.1. Market Snapshot
- 3. Market Dynamics
- 3.1. Market Drivers
- 3.2. Market Restrains
- 3.3. Market Trends
- 3.4. Market Opportunities
- 4. Market Factor Analysis
- 4.1. Porters Five Forces
- 4.1.1. Bargaining Power of Suppliers
- 4.1.2. Bargaining Power of Buyers
- 4.1.3. Threat of New Entrants
- 4.1.4. Threat of Substitutes
- 4.1.5. Competitive Rivalry
- 4.2. PESTEL analysis
- 4.3. BCG Analysis
- 4.3.1. Stars (High Growth, High Market Share)
- 4.3.2. Cash Cows (Low Growth, High Market Share)
- 4.3.3. Question Mark (High Growth, Low Market Share)
- 4.3.4. Dogs (Low Growth, Low Market Share)
- 4.4. Ansoff Matrix Analysis
- 4.5. Supply Chain Analysis
- 4.6. Regulatory Landscape
- 4.7. Current Market Potential and Opportunity Assessment (TAM–SAM–SOM Framework)
- 4.8. MDP Analyst Note
- 4.1. Porters Five Forces
- 5. Market Analysis, Insights and Forecast 2021-2033
- 5.1. Market Analysis, Insights and Forecast - by End Use
- 5.1.1. Ceramic
- 5.1.1.1. Sanitary Ware
- 5.1.1.2. Wall and Floor Tiles
- 5.1.1.3. Tableware
- 5.1.1.4. Bricks
- 5.1.1.5. Other Ce
- 5.1.2. Non-ceramic
- 5.1.2.1. Adhesives and Sealants
- 5.1.2.2. Rubbers and Plastics
- 5.1.2.3. Fertilizers and Insecticides
- 5.1.2.4. Other Non-ceramics
- 5.1.1. Ceramic
- 5.2. Market Analysis, Insights and Forecast - by Region
- 5.2.1. Asia Pacific
- 5.2.2. North America
- 5.2.3. Europe
- 5.2.4. South America
- 5.2.5. Middle East and Africa
- 5.1. Market Analysis, Insights and Forecast - by End Use
- 6. Global Ball Clay Industry Analysis, Insights and Forecast, 2021-2033
- 6.1. Market Analysis, Insights and Forecast - by End Use
- 6.1.1. Ceramic
- 6.1.1.1. Sanitary Ware
- 6.1.1.2. Wall and Floor Tiles
- 6.1.1.3. Tableware
- 6.1.1.4. Bricks
- 6.1.1.5. Other Ce
- 6.1.2. Non-ceramic
- 6.1.2.1. Adhesives and Sealants
- 6.1.2.2. Rubbers and Plastics
- 6.1.2.3. Fertilizers and Insecticides
- 6.1.2.4. Other Non-ceramics
- 6.1.1. Ceramic
- 6.1. Market Analysis, Insights and Forecast - by End Use
- 7. Asia Pacific Ball Clay Industry Analysis, Insights and Forecast, 2020-2032
- 7.1. Market Analysis, Insights and Forecast - by End Use
- 7.1.1. Ceramic
- 7.1.1.1. Sanitary Ware
- 7.1.1.2. Wall and Floor Tiles
- 7.1.1.3. Tableware
- 7.1.1.4. Bricks
- 7.1.1.5. Other Ce
- 7.1.2. Non-ceramic
- 7.1.2.1. Adhesives and Sealants
- 7.1.2.2. Rubbers and Plastics
- 7.1.2.3. Fertilizers and Insecticides
- 7.1.2.4. Other Non-ceramics
- 7.1.1. Ceramic
- 7.1. Market Analysis, Insights and Forecast - by End Use
- 8. North America Ball Clay Industry Analysis, Insights and Forecast, 2020-2032
- 8.1. Market Analysis, Insights and Forecast - by End Use
- 8.1.1. Ceramic
- 8.1.1.1. Sanitary Ware
- 8.1.1.2. Wall and Floor Tiles
- 8.1.1.3. Tableware
- 8.1.1.4. Bricks
- 8.1.1.5. Other Ce
- 8.1.2. Non-ceramic
- 8.1.2.1. Adhesives and Sealants
- 8.1.2.2. Rubbers and Plastics
- 8.1.2.3. Fertilizers and Insecticides
- 8.1.2.4. Other Non-ceramics
- 8.1.1. Ceramic
- 8.1. Market Analysis, Insights and Forecast - by End Use
- 9. Europe Ball Clay Industry Analysis, Insights and Forecast, 2020-2032
- 9.1. Market Analysis, Insights and Forecast - by End Use
- 9.1.1. Ceramic
- 9.1.1.1. Sanitary Ware
- 9.1.1.2. Wall and Floor Tiles
- 9.1.1.3. Tableware
- 9.1.1.4. Bricks
- 9.1.1.5. Other Ce
- 9.1.2. Non-ceramic
- 9.1.2.1. Adhesives and Sealants
- 9.1.2.2. Rubbers and Plastics
- 9.1.2.3. Fertilizers and Insecticides
- 9.1.2.4. Other Non-ceramics
- 9.1.1. Ceramic
- 9.1. Market Analysis, Insights and Forecast - by End Use
- 10. South America Ball Clay Industry Analysis, Insights and Forecast, 2020-2032
- 10.1. Market Analysis, Insights and Forecast - by End Use
- 10.1.1. Ceramic
- 10.1.1.1. Sanitary Ware
- 10.1.1.2. Wall and Floor Tiles
- 10.1.1.3. Tableware
- 10.1.1.4. Bricks
- 10.1.1.5. Other Ce
- 10.1.2. Non-ceramic
- 10.1.2.1. Adhesives and Sealants
- 10.1.2.2. Rubbers and Plastics
- 10.1.2.3. Fertilizers and Insecticides
- 10.1.2.4. Other Non-ceramics
- 10.1.1. Ceramic
- 10.1. Market Analysis, Insights and Forecast - by End Use
- 11. Middle East and Africa Ball Clay Industry Analysis, Insights and Forecast, 2020-2032
- 11.1. Market Analysis, Insights and Forecast - by End Use
- 11.1.1. Ceramic
- 11.1.1.1. Sanitary Ware
- 11.1.1.2. Wall and Floor Tiles
- 11.1.1.3. Tableware
- 11.1.1.4. Bricks
- 11.1.1.5. Other Ce
- 11.1.2. Non-ceramic
- 11.1.2.1. Adhesives and Sealants
- 11.1.2.2. Rubbers and Plastics
- 11.1.2.3. Fertilizers and Insecticides
- 11.1.2.4. Other Non-ceramics
- 11.1.1. Ceramic
- 11.1. Market Analysis, Insights and Forecast - by End Use
- 12. Competitive Analysis
- 12.1. Company Profiles
- 12.1.1 Stephan Schmidt KG
- 12.1.1.1. Company Overview
- 12.1.1.2. Products
- 12.1.1.3. Company Financials
- 12.1.1.4. SWOT Analysis
- 12.1.2 Old Hickory Clay Company
- 12.1.2.1. Company Overview
- 12.1.2.2. Products
- 12.1.2.3. Company Financials
- 12.1.2.4. SWOT Analysis
- 12.1.3 Amarnath Industries
- 12.1.3.1. Company Overview
- 12.1.3.2. Products
- 12.1.3.3. Company Financials
- 12.1.3.4. SWOT Analysis
- 12.1.4 Ashok Alco - chem Limited (AACL)
- 12.1.4.1. Company Overview
- 12.1.4.2. Products
- 12.1.4.3. Company Financials
- 12.1.4.4. SWOT Analysis
- 12.1.5 JLD Minerals
- 12.1.5.1. Company Overview
- 12.1.5.2. Products
- 12.1.5.3. Company Financials
- 12.1.5.4. SWOT Analysis
- 12.1.6 Imerys
- 12.1.6.1. Company Overview
- 12.1.6.2. Products
- 12.1.6.3. Company Financials
- 12.1.6.4. SWOT Analysis
- 12.1.7 Mota Ceramic Solutions
- 12.1.7.1. Company Overview
- 12.1.7.2. Products
- 12.1.7.3. Company Financials
- 12.1.7.4. SWOT Analysis
- 12.1.8 Modkha Marine Sdn Bhd
- 12.1.8.1. Company Overview
- 12.1.8.2. Products
- 12.1.8.3. Company Financials
- 12.1.8.4. SWOT Analysis
- 12.1.9 Gujarat Mineral Development Corporation Ltd
- 12.1.9.1. Company Overview
- 12.1.9.2. Products
- 12.1.9.3. Company Financials
- 12.1.9.4. SWOT Analysis
- 12.1.10 Sibelco
- 12.1.10.1. Company Overview
- 12.1.10.2. Products
- 12.1.10.3. Company Financials
- 12.1.10.4. SWOT Analysis
- 12.1.11 Golcha Associated (Associated Soapstone Distribution Company Pvt Ltd)
- 12.1.11.1. Company Overview
- 12.1.11.2. Products
- 12.1.11.3. Company Financials
- 12.1.11.4. SWOT Analysis
- 12.1.1 Stephan Schmidt KG
- 12.2. Market Entropy
- 12.2.1 Company's Key Areas Served
- 12.2.2 Recent Developments
- 12.3. Company Market Share Analysis 2025
- 12.3.1 Top 5 Companies Market Share Analysis
- 12.3.2 Top 3 Companies Market Share Analysis
- 12.4. List of Potential Customers
- 13. Research Methodology
List of Figures
- Figure 1: Global Ball Clay Industry Revenue Breakdown (Million, %) by Region 2025 & 2033
- Figure 2: Global Ball Clay Industry Volume Breakdown (K Tons, %) by Region 2025 & 2033
- Figure 3: Asia Pacific Ball Clay Industry Revenue (Million), by End Use 2025 & 2033
- Figure 4: Asia Pacific Ball Clay Industry Volume (K Tons), by End Use 2025 & 2033
- Figure 5: Asia Pacific Ball Clay Industry Revenue Share (%), by End Use 2025 & 2033
- Figure 6: Asia Pacific Ball Clay Industry Volume Share (%), by End Use 2025 & 2033
- Figure 7: Asia Pacific Ball Clay Industry Revenue (Million), by Country 2025 & 2033
- Figure 8: Asia Pacific Ball Clay Industry Volume (K Tons), by Country 2025 & 2033
- Figure 9: Asia Pacific Ball Clay Industry Revenue Share (%), by Country 2025 & 2033
- Figure 10: Asia Pacific Ball Clay Industry Volume Share (%), by Country 2025 & 2033
- Figure 11: North America Ball Clay Industry Revenue (Million), by End Use 2025 & 2033
- Figure 12: North America Ball Clay Industry Volume (K Tons), by End Use 2025 & 2033
- Figure 13: North America Ball Clay Industry Revenue Share (%), by End Use 2025 & 2033
- Figure 14: North America Ball Clay Industry Volume Share (%), by End Use 2025 & 2033
- Figure 15: North America Ball Clay Industry Revenue (Million), by Country 2025 & 2033
- Figure 16: North America Ball Clay Industry Volume (K Tons), by Country 2025 & 2033
- Figure 17: North America Ball Clay Industry Revenue Share (%), by Country 2025 & 2033
- Figure 18: North America Ball Clay Industry Volume Share (%), by Country 2025 & 2033
- Figure 19: Europe Ball Clay Industry Revenue (Million), by End Use 2025 & 2033
- Figure 20: Europe Ball Clay Industry Volume (K Tons), by End Use 2025 & 2033
- Figure 21: Europe Ball Clay Industry Revenue Share (%), by End Use 2025 & 2033
- Figure 22: Europe Ball Clay Industry Volume Share (%), by End Use 2025 & 2033
- Figure 23: Europe Ball Clay Industry Revenue (Million), by Country 2025 & 2033
- Figure 24: Europe Ball Clay Industry Volume (K Tons), by Country 2025 & 2033
- Figure 25: Europe Ball Clay Industry Revenue Share (%), by Country 2025 & 2033
- Figure 26: Europe Ball Clay Industry Volume Share (%), by Country 2025 & 2033
- Figure 27: South America Ball Clay Industry Revenue (Million), by End Use 2025 & 2033
- Figure 28: South America Ball Clay Industry Volume (K Tons), by End Use 2025 & 2033
- Figure 29: South America Ball Clay Industry Revenue Share (%), by End Use 2025 & 2033
- Figure 30: South America Ball Clay Industry Volume Share (%), by End Use 2025 & 2033
- Figure 31: South America Ball Clay Industry Revenue (Million), by Country 2025 & 2033
- Figure 32: South America Ball Clay Industry Volume (K Tons), by Country 2025 & 2033
- Figure 33: South America Ball Clay Industry Revenue Share (%), by Country 2025 & 2033
- Figure 34: South America Ball Clay Industry Volume Share (%), by Country 2025 & 2033
- Figure 35: Middle East and Africa Ball Clay Industry Revenue (Million), by End Use 2025 & 2033
- Figure 36: Middle East and Africa Ball Clay Industry Volume (K Tons), by End Use 2025 & 2033
- Figure 37: Middle East and Africa Ball Clay Industry Revenue Share (%), by End Use 2025 & 2033
- Figure 38: Middle East and Africa Ball Clay Industry Volume Share (%), by End Use 2025 & 2033
- Figure 39: Middle East and Africa Ball Clay Industry Revenue (Million), by Country 2025 & 2033
- Figure 40: Middle East and Africa Ball Clay Industry Volume (K Tons), by Country 2025 & 2033
- Figure 41: Middle East and Africa Ball Clay Industry Revenue Share (%), by Country 2025 & 2033
- Figure 42: Middle East and Africa Ball Clay Industry Volume Share (%), by Country 2025 & 2033
List of Tables
- Table 1: Global Ball Clay Industry Revenue Million Forecast, by End Use 2020 & 2033
- Table 2: Global Ball Clay Industry Volume K Tons Forecast, by End Use 2020 & 2033
- Table 3: Global Ball Clay Industry Revenue Million Forecast, by Region 2020 & 2033
- Table 4: Global Ball Clay Industry Volume K Tons Forecast, by Region 2020 & 2033
- Table 5: Global Ball Clay Industry Revenue Million Forecast, by End Use 2020 & 2033
- Table 6: Global Ball Clay Industry Volume K Tons Forecast, by End Use 2020 & 2033
- Table 7: Global Ball Clay Industry Revenue Million Forecast, by Country 2020 & 2033
- Table 8: Global Ball Clay Industry Volume K Tons Forecast, by Country 2020 & 2033
- Table 9: China Ball Clay Industry Revenue (Million) Forecast, by Application 2020 & 2033
- Table 10: China Ball Clay Industry Volume (K Tons) Forecast, by Application 2020 & 2033
- Table 11: India Ball Clay Industry Revenue (Million) Forecast, by Application 2020 & 2033
- Table 12: India Ball Clay Industry Volume (K Tons) Forecast, by Application 2020 & 2033
- Table 13: Japan Ball Clay Industry Revenue (Million) Forecast, by Application 2020 & 2033
- Table 14: Japan Ball Clay Industry Volume (K Tons) Forecast, by Application 2020 & 2033
- Table 15: South Korea Ball Clay Industry Revenue (Million) Forecast, by Application 2020 & 2033
- Table 16: South Korea Ball Clay Industry Volume (K Tons) Forecast, by Application 2020 & 2033
- Table 17: Rest of Asia Pacific Ball Clay Industry Revenue (Million) Forecast, by Application 2020 & 2033
- Table 18: Rest of Asia Pacific Ball Clay Industry Volume (K Tons) Forecast, by Application 2020 & 2033
- Table 19: Global Ball Clay Industry Revenue Million Forecast, by End Use 2020 & 2033
- Table 20: Global Ball Clay Industry Volume K Tons Forecast, by End Use 2020 & 2033
- Table 21: Global Ball Clay Industry Revenue Million Forecast, by Country 2020 & 2033
- Table 22: Global Ball Clay Industry Volume K Tons Forecast, by Country 2020 & 2033
- Table 23: United States Ball Clay Industry Revenue (Million) Forecast, by Application 2020 & 2033
- Table 24: United States Ball Clay Industry Volume (K Tons) Forecast, by Application 2020 & 2033
- Table 25: Canada Ball Clay Industry Revenue (Million) Forecast, by Application 2020 & 2033
- Table 26: Canada Ball Clay Industry Volume (K Tons) Forecast, by Application 2020 & 2033
- Table 27: Mexico Ball Clay Industry Revenue (Million) Forecast, by Application 2020 & 2033
- Table 28: Mexico Ball Clay Industry Volume (K Tons) Forecast, by Application 2020 & 2033
- Table 29: Global Ball Clay Industry Revenue Million Forecast, by End Use 2020 & 2033
- Table 30: Global Ball Clay Industry Volume K Tons Forecast, by End Use 2020 & 2033
- Table 31: Global Ball Clay Industry Revenue Million Forecast, by Country 2020 & 2033
- Table 32: Global Ball Clay Industry Volume K Tons Forecast, by Country 2020 & 2033
- Table 33: Germany Ball Clay Industry Revenue (Million) Forecast, by Application 2020 & 2033
- Table 34: Germany Ball Clay Industry Volume (K Tons) Forecast, by Application 2020 & 2033
- Table 35: United Kingdom Ball Clay Industry Revenue (Million) Forecast, by Application 2020 & 2033
- Table 36: United Kingdom Ball Clay Industry Volume (K Tons) Forecast, by Application 2020 & 2033
- Table 37: Italy Ball Clay Industry Revenue (Million) Forecast, by Application 2020 & 2033
- Table 38: Italy Ball Clay Industry Volume (K Tons) Forecast, by Application 2020 & 2033
- Table 39: France Ball Clay Industry Revenue (Million) Forecast, by Application 2020 & 2033
- Table 40: France Ball Clay Industry Volume (K Tons) Forecast, by Application 2020 & 2033
- Table 41: Spain Ball Clay Industry Revenue (Million) Forecast, by Application 2020 & 2033
- Table 42: Spain Ball Clay Industry Volume (K Tons) Forecast, by Application 2020 & 2033
- Table 43: Rest of Europe Ball Clay Industry Revenue (Million) Forecast, by Application 2020 & 2033
- Table 44: Rest of Europe Ball Clay Industry Volume (K Tons) Forecast, by Application 2020 & 2033
- Table 45: Global Ball Clay Industry Revenue Million Forecast, by End Use 2020 & 2033
- Table 46: Global Ball Clay Industry Volume K Tons Forecast, by End Use 2020 & 2033
- Table 47: Global Ball Clay Industry Revenue Million Forecast, by Country 2020 & 2033
- Table 48: Global Ball Clay Industry Volume K Tons Forecast, by Country 2020 & 2033
- Table 49: Brazil Ball Clay Industry Revenue (Million) Forecast, by Application 2020 & 2033
- Table 50: Brazil Ball Clay Industry Volume (K Tons) Forecast, by Application 2020 & 2033
- Table 51: Argentina Ball Clay Industry Revenue (Million) Forecast, by Application 2020 & 2033
- Table 52: Argentina Ball Clay Industry Volume (K Tons) Forecast, by Application 2020 & 2033
- Table 53: Rest of South America Ball Clay Industry Revenue (Million) Forecast, by Application 2020 & 2033
- Table 54: Rest of South America Ball Clay Industry Volume (K Tons) Forecast, by Application 2020 & 2033
- Table 55: Global Ball Clay Industry Revenue Million Forecast, by End Use 2020 & 2033
- Table 56: Global Ball Clay Industry Volume K Tons Forecast, by End Use 2020 & 2033
- Table 57: Global Ball Clay Industry Revenue Million Forecast, by Country 2020 & 2033
- Table 58: Global Ball Clay Industry Volume K Tons Forecast, by Country 2020 & 2033
- Table 59: Saudi Arabia Ball Clay Industry Revenue (Million) Forecast, by Application 2020 & 2033
- Table 60: Saudi Arabia Ball Clay Industry Volume (K Tons) Forecast, by Application 2020 & 2033
- Table 61: South Africa Ball Clay Industry Revenue (Million) Forecast, by Application 2020 & 2033
- Table 62: South Africa Ball Clay Industry Volume (K Tons) Forecast, by Application 2020 & 2033
- Table 63: Rest of Middle East and Africa Ball Clay Industry Revenue (Million) Forecast, by Application 2020 & 2033
- Table 64: Rest of Middle East and Africa Ball Clay Industry Volume (K Tons) Forecast, by Application 2020 & 2033
Frequently Asked Questions
1. What is the projected Compound Annual Growth Rate (CAGR) of the Ball Clay Industry?
The projected CAGR is approximately 5.07%.
2. Which companies are prominent players in the Ball Clay Industry?
Key companies in the market include Stephan Schmidt KG, Old Hickory Clay Company, Amarnath Industries, Ashok Alco - chem Limited (AACL), JLD Minerals, Imerys, Mota Ceramic Solutions, Modkha Marine Sdn Bhd, Gujarat Mineral Development Corporation Ltd, Sibelco, Golcha Associated (Associated Soapstone Distribution Company Pvt Ltd).
3. What are the main segments of the Ball Clay Industry?
The market segments include End Use.
4. Can you provide details about the market size?
The market size is estimated to be USD 433.33 Million as of 2022.
5. What are some drivers contributing to market growth?
Increasing Demand for Sanitary Ware in Asia-Pacific; Other Drivers.
6. What are the notable trends driving market growth?
Use of Wall and Floor Tiles in the Construction Industry.
7. Are there any restraints impacting market growth?
Availability of Substitutes for Ball Clay; Other Restraints.
8. Can you provide examples of recent developments in the market?
N/A
9. What pricing options are available for accessing the report?
Pricing options include single-user, multi-user, and enterprise licenses priced at USD 4750, USD 5250, and USD 8750 respectively.
10. Is the market size provided in terms of value or volume?
The market size is provided in terms of value, measured in Million and volume, measured in K Tons.
11. Are there any specific market keywords associated with the report?
Yes, the market keyword associated with the report is "Ball Clay Industry," which aids in identifying and referencing the specific market segment covered.
12. How do I determine which pricing option suits my needs best?
The pricing options vary based on user requirements and access needs. Individual users may opt for single-user licenses, while businesses requiring broader access may choose multi-user or enterprise licenses for cost-effective access to the report.
13. Are there any additional resources or data provided in the Ball Clay Industry report?
While the report offers comprehensive insights, it's advisable to review the specific contents or supplementary materials provided to ascertain if additional resources or data are available.
14. How can I stay updated on further developments or reports in the Ball Clay Industry?
To stay informed about further developments, trends, and reports in the Ball Clay Industry, consider subscribing to industry newsletters, following relevant companies and organizations, or regularly checking reputable industry news sources and publications.
Methodology
Step 1 - Identification of Relevant Samples Size from Population Database


Step 2 - Approaches for Defining Global Market Size (Value, Volume* & Price*)

Note*: In applicable scenarios
Step 3 - Data Sources
Primary Research
- Web Analytics
- Survey Reports
- Research Institute
- Latest Research Reports
- Opinion Leaders
Secondary Research
- Annual Reports
- White Paper
- Latest Press Release
- Industry Association
- Paid Database
- Investor Presentations

Step 4 - Data Triangulation
Involves using different sources of information in order to increase the validity of a study
These sources are likely to be stakeholders in a program - participants, other researchers, program staff, other community members, and so on.
Then we put all data in single framework & apply various statistical tools to find out the dynamic on the market.
During the analysis stage, feedback from the stakeholder groups would be compared to determine areas of agreement as well as areas of divergence