

Key Insights
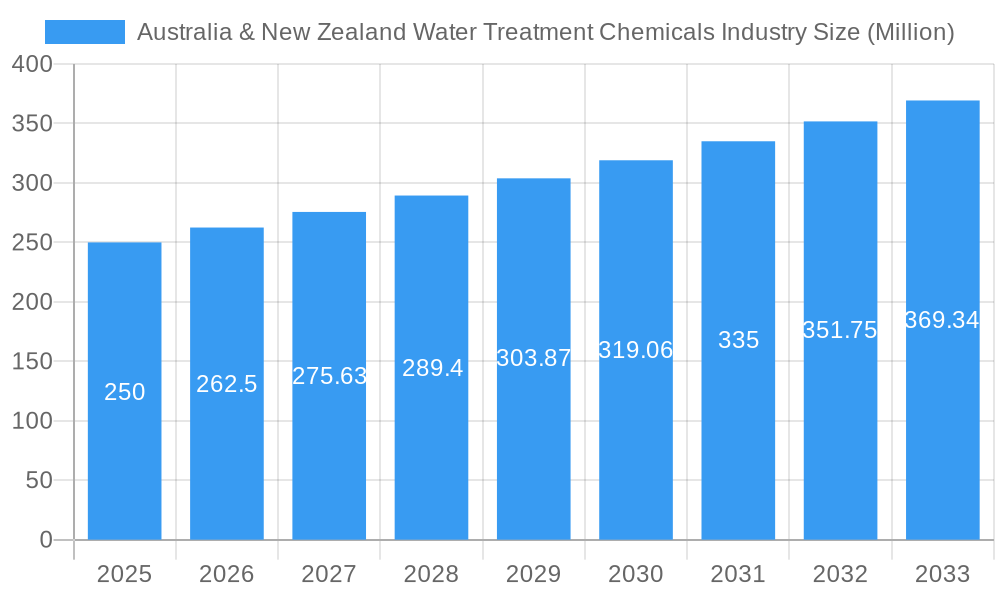
The Australia & New Zealand water treatment chemicals market is projected for robust expansion, forecasting a Compound Annual Growth Rate (CAGR) of 5.6% from 2024 to 2033. This growth is propelled by increasing industrial activity, stringent environmental mandates, and heightened awareness of water scarcity. Key market drivers include demand for biocides and disinfectants for water purity and coagulants and flocculants for purification across diverse sectors. Major end-users like power generation, oil & gas, and mining are significant contributors due to their substantial water usage and treatment needs for corrosion and scaling prevention. Municipal water projects and the growing emphasis on sustainable water management in the food & beverage and pulp & paper industries will further fuel market advancement. Despite potential challenges such as fluctuating raw material costs and evolving regulations, the long-term outlook remains highly positive.
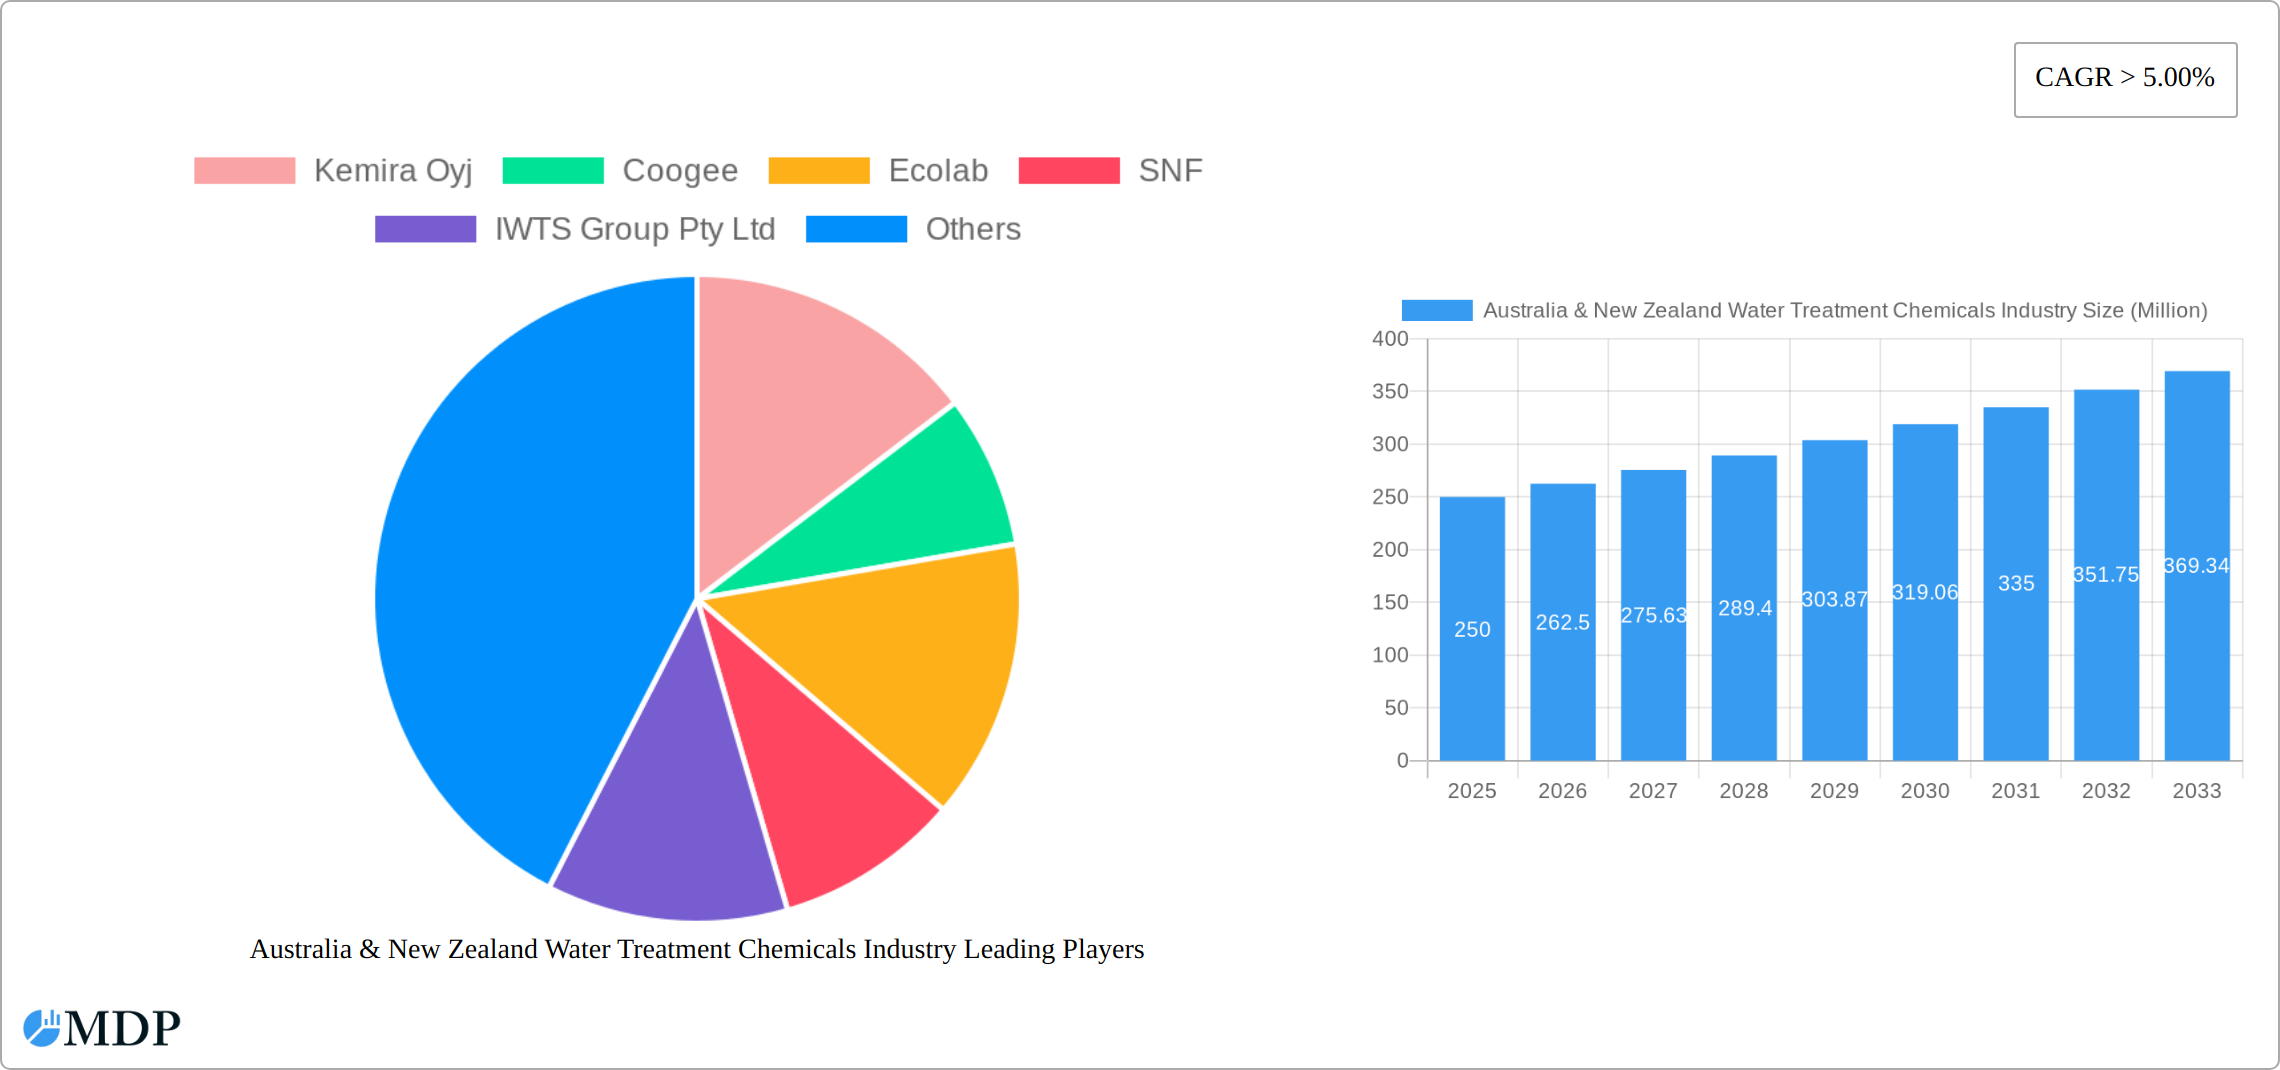
Australia & New Zealand Water Treatment Chemicals Industry Market Size (In Billion)
The market is characterized by a fragmented competitive landscape featuring both global and local enterprises. Leading companies like Kemira Oyj, Ecolab, SNF, and Solvay dominate through brand strength and technological prowess. Specialized smaller players also play a vital role, particularly in niche markets and custom solutions. Competition spans pricing strategies and the introduction of innovative, high-performance products. Future success will hinge on companies adapting to shifting industry requirements, adopting sustainable practices, and potentially offering comprehensive water treatment solutions. Tailored solutions and a focus on locally sourced materials will be crucial for gaining a competitive edge in Australia and New Zealand's distinct environmental and regulatory context. Technological innovation, especially in advanced oxidation processes and membrane filtration, presents significant opportunities for enhanced efficiency and sustainability.
Australia & New Zealand Water Treatment Chemicals Industry Company Market Share
Australia & New Zealand Water Treatment Chemicals Market Report: 2019-2033
This comprehensive report provides a detailed analysis of the Australia & New Zealand water treatment chemicals industry, offering invaluable insights for stakeholders seeking to navigate this dynamic market. With a study period spanning 2019-2033, a base year of 2025, and a forecast period of 2025-2033, this report leverages historical data (2019-2024) to predict future trends and opportunities. The report covers key market segments, leading players, and emerging trends, providing actionable intelligence for informed decision-making. Expect detailed analysis of market size (in Millions), CAGR, and market share data.
Australia & New Zealand Water Treatment Chemicals Industry Market Dynamics & Concentration
The Australian and New Zealand water treatment chemicals market is characterized by a moderately concentrated landscape, with several multinational corporations and regional players vying for market share. The market size in 2025 is estimated at xx Million, experiencing a CAGR of xx% during the forecast period. Market concentration is influenced by factors including economies of scale, technological advancements, and regulatory compliance. Innovation is a key driver, with companies investing heavily in developing advanced water treatment solutions to meet stringent environmental regulations and the growing demand for sustainable practices.
- Market Share: The top five players hold an estimated xx% market share collectively in 2025.
- M&A Activity: The historical period (2019-2024) witnessed approximately xx M&A deals, primarily focused on expanding geographic reach and acquiring specialized technologies. The forecast period is expected to see continued consolidation.
- Regulatory Landscape: Stringent environmental regulations in both countries drive the demand for efficient and eco-friendly water treatment solutions.
- Product Substitutes: The presence of substitute technologies (e.g., membrane filtration) presents a competitive challenge, but the versatility and cost-effectiveness of chemical treatments maintain their relevance.
- End-User Trends: The increasing emphasis on water conservation and reuse across various end-user industries (e.g., municipal, industrial) is fuelling market growth.
Australia & New Zealand Water Treatment Chemicals Industry Industry Trends & Analysis
The Australia & New Zealand water treatment chemicals market is experiencing robust growth, driven by factors such as increasing industrialization, urbanization, and stricter environmental regulations. The market is expected to reach xx Million by 2033, exhibiting a CAGR of xx% from 2025 to 2033. Technological disruptions are transforming the industry, with advancements in nanotechnology, AI-powered process optimization, and the development of sustainable chemicals shaping the future of water treatment. Consumer preferences are shifting toward environmentally friendly and high-performance solutions, creating opportunities for companies that prioritize sustainability and innovation. Competitive dynamics are characterized by both intense rivalry and strategic collaborations, with companies striving to differentiate their offerings through technological advancements and superior customer service. Market penetration of advanced treatment technologies is increasing steadily, with notable adoption in the municipal and industrial sectors.
Leading Markets & Segments in Australia & New Zealand Water Treatment Chemicals Industry
The municipal sector dominates the end-user industry segment, driven by the increasing need to treat large volumes of wastewater and ensure safe drinking water supplies. Within product types, coagulants and flocculants represent the largest segment due to their widespread use in various water treatment processes. The growth in these leading segments is propelled by several factors:
Key Drivers:
- Municipal Sector: Government investments in water infrastructure upgrades and expansion are significant growth catalysts.
- Coagulants & Flocculants: Their effectiveness and cost-effectiveness in removing impurities make them indispensable in water treatment.
- Economic Policies: Government incentives and subsidies promoting sustainable water management practices boost market growth.
- Infrastructure Development: Expanding urbanization and industrialization necessitate larger and more efficient water treatment facilities.
Dominance Analysis:
The dominance of the municipal sector is largely attributed to the substantial investments in upgrading water infrastructure and stringent regulations governing water quality. Similarly, the high usage rate and crucial role of coagulants and flocculants in almost all water treatment processes solidify their position as the leading product segment.
Australia & New Zealand Water Treatment Chemicals Industry Product Developments
The Australian and New Zealand water treatment chemicals industry is experiencing a surge in innovative product development, driven by the need for more sustainable, efficient, and effective solutions. This includes a growing emphasis on bio-based alternatives to traditional chemicals, minimizing environmental impact and promoting circular economy principles. Advanced formulations are being developed with enhanced performance characteristics, such as improved efficacy at lower concentrations, reduced sludge generation, and extended operational lifespan. Furthermore, the adoption of intelligent dosing systems and advanced monitoring technologies is optimizing chemical usage, reducing waste, and enhancing overall treatment efficiency. These developments are crucial in addressing increasingly stringent environmental regulations, improving operational efficiencies for water treatment plants, and ensuring compliance with evolving industry standards. The competitive landscape is rewarding companies that can demonstrably offer innovative, cost-effective, and environmentally responsible solutions, prioritizing lifecycle assessment and transparent communication of their products’ impact.
Key Drivers of Australia & New Zealand Water Treatment Chemicals Industry Growth
The robust growth of the Australia & New Zealand water treatment chemicals market is fueled by several converging factors:
- Stringent Environmental Regulations and Compliance Needs: The implementation of increasingly strict regulations regarding water quality, discharge limits, and environmental protection mandates the adoption of advanced treatment technologies and specialized chemicals. This translates to heightened demand for high-performance, compliant solutions.
- Growing Industrialization and Urbanization: Rapid population growth and industrial expansion in both countries are leading to increased water consumption and wastewater generation. This necessitates more robust and efficient water treatment infrastructure and chemical solutions.
- Technological Advancements and Digitalization: Continuous innovations in water treatment technologies, including automation, data analytics, and sensor-based monitoring, are improving efficiency, reducing operational costs, and enabling predictive maintenance, thereby enhancing the overall value proposition of water treatment chemicals.
- Government Investments in Water Infrastructure: Significant government investments in upgrading and expanding water infrastructure projects across Australia and New Zealand are creating a substantial market opportunity for water treatment chemicals suppliers.
- Focus on Water Security and Resilience: Growing awareness of the importance of water security and the need for resilient water management systems is driving investment in advanced water treatment solutions, including those utilizing innovative chemical technologies.
Challenges in the Australia & New Zealand Water Treatment Chemicals Industry Market
Despite the significant growth potential, the industry faces several key challenges:
- Fluctuating Raw Material Prices and Supply Chain Volatility: Global supply chain disruptions and volatility in the prices of key raw materials pose a significant risk to profitability and operational stability.
- Intense Competition and Market Consolidation: The market is characterized by both intense competition among established players and the emergence of new entrants, necessitating continuous innovation and differentiation to maintain market share.
- Regulatory Compliance and Evolving Standards: Staying ahead of evolving environmental regulations and industry standards requires continuous investment in research and development, regulatory compliance expertise, and robust quality control procedures.
- Sustainability Concerns and the Demand for Eco-Friendly Solutions: The industry is facing increasing pressure to adopt more sustainable practices, develop eco-friendly products, and minimize their environmental footprint throughout the product lifecycle.
Emerging Opportunities in Australia & New Zealand Water Treatment Chemicals Industry
Long-term growth opportunities arise from:
- Technological Breakthroughs: Advancements in nanotechnology and AI offer potential for more efficient and sustainable water treatment.
- Strategic Partnerships: Collaborations between chemical companies and water treatment plant operators foster innovation and market penetration.
- Market Expansion: Untapped opportunities exist in expanding into emerging markets and serving niche segments.
- Focus on Sustainability: Growing consumer preference for environmentally friendly solutions creates opportunities for green chemistry solutions.
Leading Players in the Australia & New Zealand Water Treatment Chemicals Industry Sector
- Kemira Oyj
- Coogee
- Ecolab
- SNF
- IWTS Group Pty Ltd
- Solvay
- Buckman
- Aquasol
- Dow
- Solenis
- Ixom
- Albemarle Corporation
- Veolia (Veolia Water Technologies)
Key Milestones in Australia & New Zealand Water Treatment Chemicals Industry Industry
- 2020: Introduction of stricter water quality regulations in Australia.
- 2022: Launch of a new biocide formulation by a leading chemical manufacturer.
- 2023: Acquisition of a regional water treatment company by a multinational corporation. (Specific details not available, placeholder)
- 2024: Significant investment in research and development of sustainable water treatment chemicals. (Specific details not available, placeholder)
Strategic Outlook for Australia & New Zealand Water Treatment Chemicals Industry Market
The future of the Australia & New Zealand water treatment chemicals market remains exceptionally promising, driven by long-term growth in key sectors like industrial manufacturing, agriculture, and population centers. Companies that prioritize technological innovation, sustainability, and robust customer relationships are best positioned to thrive. Strategic collaborations, substantial investments in research and development focused on sustainable solutions, and a commitment to providing tailored, high-value solutions to clients will be pivotal for success. The market is poised for a period of sustained expansion, offering lucrative opportunities for established businesses and ambitious new entrants alike. A focus on digital transformation and data-driven decision-making will be increasingly important to optimize operational efficiency, anticipate market trends, and remain competitive in this dynamic environment.
Australia & New Zealand Water Treatment Chemicals Industry Segmentation
-
1. Product Type
- 1.1. Biocides and Disinfectants
- 1.2. Coagulants and Flocculants
- 1.3. Corrosion and Scale Inhibitors
- 1.4. Defoamers and Defoaming Agents
- 1.5. pH Conditioners/Adjusters
- 1.6. Other Product Types
-
2. End-user Industry
- 2.1. Power Generation
- 2.2. Oil and Gas
- 2.3. Chemical Manufacturing
- 2.4. Mining and Mineral Processing
- 2.5. Municipal
- 2.6. Food and Beverage
- 2.7. Pulp and Paper
- 2.8. Other End-user Industries
Australia & New Zealand Water Treatment Chemicals Industry Segmentation By Geography
- 1. Australia
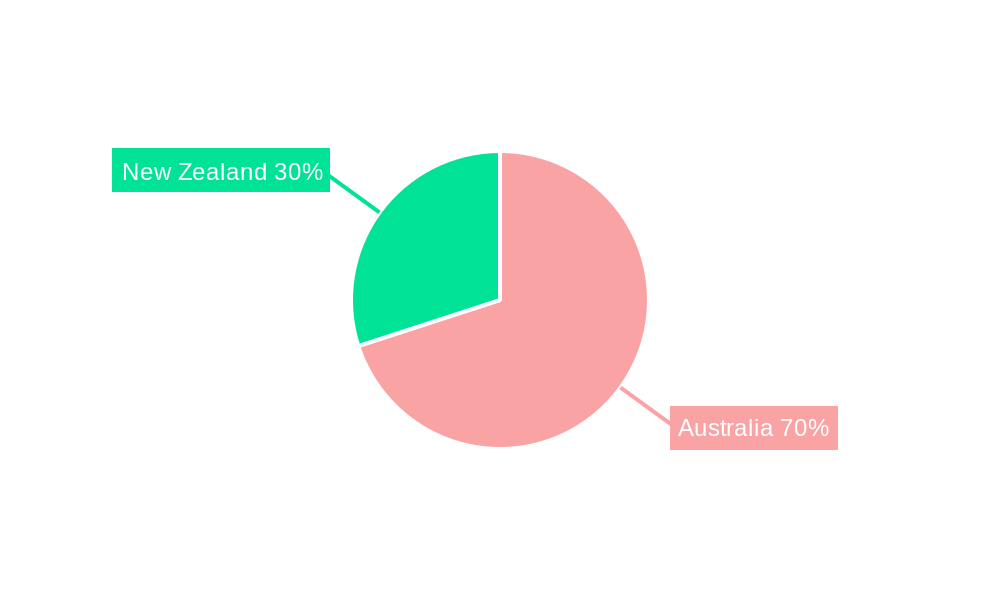
Australia & New Zealand Water Treatment Chemicals Industry Regional Market Share
Geographic Coverage of Australia & New Zealand Water Treatment Chemicals Industry
Australia & New Zealand Water Treatment Chemicals Industry REPORT HIGHLIGHTS
| Aspects | Details |
|---|---|
| Study Period | 2020-2034 |
| Base Year | 2025 |
| Estimated Year | 2026 |
| Forecast Period | 2026-2034 |
| Historical Period | 2020-2025 |
| Growth Rate | CAGR of 5.6% from 2020-2034 |
| Segmentation |
|
Table of Contents
- 1. Introduction
- 1.1. Research Scope
- 1.2. Market Segmentation
- 1.3. Research Objective
- 1.4. Definitions and Assumptions
- 2. Executive Summary
- 2.1. Market Snapshot
- 3. Market Dynamics
- 3.1. Market Drivers
- 3.2. Market Restrains
- 3.3. Market Trends
- 3.4. Market Opportunities
- 4. Market Factor Analysis
- 4.1. Porters Five Forces
- 4.1.1. Bargaining Power of Suppliers
- 4.1.2. Bargaining Power of Buyers
- 4.1.3. Threat of New Entrants
- 4.1.4. Threat of Substitutes
- 4.1.5. Competitive Rivalry
- 4.2. PESTEL analysis
- 4.3. BCG Analysis
- 4.3.1. Stars (High Growth, High Market Share)
- 4.3.2. Cash Cows (Low Growth, High Market Share)
- 4.3.3. Question Mark (High Growth, Low Market Share)
- 4.3.4. Dogs (Low Growth, Low Market Share)
- 4.4. Ansoff Matrix Analysis
- 4.5. Supply Chain Analysis
- 4.6. Regulatory Landscape
- 4.7. Current Market Potential and Opportunity Assessment (TAM–SAM–SOM Framework)
- 4.8. MDP Analyst Note
- 4.1. Porters Five Forces
- 5. Market Analysis, Insights and Forecast 2021-2033
- 5.1. Market Analysis, Insights and Forecast - by Product Type
- 5.1.1. Biocides and Disinfectants
- 5.1.2. Coagulants and Flocculants
- 5.1.3. Corrosion and Scale Inhibitors
- 5.1.4. Defoamers and Defoaming Agents
- 5.1.5. pH Conditioners/Adjusters
- 5.1.6. Other Product Types
- 5.2. Market Analysis, Insights and Forecast - by End-user Industry
- 5.2.1. Power Generation
- 5.2.2. Oil and Gas
- 5.2.3. Chemical Manufacturing
- 5.2.4. Mining and Mineral Processing
- 5.2.5. Municipal
- 5.2.6. Food and Beverage
- 5.2.7. Pulp and Paper
- 5.2.8. Other End-user Industries
- 5.3. Market Analysis, Insights and Forecast - by Region
- 5.3.1. Australia
- 5.1. Market Analysis, Insights and Forecast - by Product Type
- 6. Australia & New Zealand Water Treatment Chemicals Industry Analysis, Insights and Forecast, 2021-2033
- 6.1. Market Analysis, Insights and Forecast - by Product Type
- 6.1.1. Biocides and Disinfectants
- 6.1.2. Coagulants and Flocculants
- 6.1.3. Corrosion and Scale Inhibitors
- 6.1.4. Defoamers and Defoaming Agents
- 6.1.5. pH Conditioners/Adjusters
- 6.1.6. Other Product Types
- 6.2. Market Analysis, Insights and Forecast - by End-user Industry
- 6.2.1. Power Generation
- 6.2.2. Oil and Gas
- 6.2.3. Chemical Manufacturing
- 6.2.4. Mining and Mineral Processing
- 6.2.5. Municipal
- 6.2.6. Food and Beverage
- 6.2.7. Pulp and Paper
- 6.2.8. Other End-user Industries
- 6.1. Market Analysis, Insights and Forecast - by Product Type
- 7. Competitive Analysis
- 7.1. Company Profiles
- 7.1.1 Kemira Oyj
- 7.1.1.1. Company Overview
- 7.1.1.2. Products
- 7.1.1.3. Company Financials
- 7.1.1.4. SWOT Analysis
- 7.1.2 Coogee
- 7.1.2.1. Company Overview
- 7.1.2.2. Products
- 7.1.2.3. Company Financials
- 7.1.2.4. SWOT Analysis
- 7.1.3 Ecolab
- 7.1.3.1. Company Overview
- 7.1.3.2. Products
- 7.1.3.3. Company Financials
- 7.1.3.4. SWOT Analysis
- 7.1.4 SNF
- 7.1.4.1. Company Overview
- 7.1.4.2. Products
- 7.1.4.3. Company Financials
- 7.1.4.4. SWOT Analysis
- 7.1.5 IWTS Group Pty Ltd
- 7.1.5.1. Company Overview
- 7.1.5.2. Products
- 7.1.5.3. Company Financials
- 7.1.5.4. SWOT Analysis
- 7.1.6 Solvay
- 7.1.6.1. Company Overview
- 7.1.6.2. Products
- 7.1.6.3. Company Financials
- 7.1.6.4. SWOT Analysis
- 7.1.7 Buckman
- 7.1.7.1. Company Overview
- 7.1.7.2. Products
- 7.1.7.3. Company Financials
- 7.1.7.4. SWOT Analysis
- 7.1.8 Aquasol
- 7.1.8.1. Company Overview
- 7.1.8.2. Products
- 7.1.8.3. Company Financials
- 7.1.8.4. SWOT Analysis
- 7.1.9 Dow
- 7.1.9.1. Company Overview
- 7.1.9.2. Products
- 7.1.9.3. Company Financials
- 7.1.9.4. SWOT Analysis
- 7.1.10 Solenis
- 7.1.10.1. Company Overview
- 7.1.10.2. Products
- 7.1.10.3. Company Financials
- 7.1.10.4. SWOT Analysis
- 7.1.11 Ixom
- 7.1.11.1. Company Overview
- 7.1.11.2. Products
- 7.1.11.3. Company Financials
- 7.1.11.4. SWOT Analysis
- 7.1.12 Albemarle Corporation
- 7.1.12.1. Company Overview
- 7.1.12.2. Products
- 7.1.12.3. Company Financials
- 7.1.12.4. SWOT Analysis
- 7.1.13 Veolia (Veolia Water Technologies)
- 7.1.13.1. Company Overview
- 7.1.13.2. Products
- 7.1.13.3. Company Financials
- 7.1.13.4. SWOT Analysis
- 7.1.1 Kemira Oyj
- 7.2. Market Entropy
- 7.2.1 Company's Key Areas Served
- 7.2.2 Recent Developments
- 7.3. Company Market Share Analysis 2025
- 7.3.1 Top 5 Companies Market Share Analysis
- 7.3.2 Top 3 Companies Market Share Analysis
- 7.4. List of Potential Customers
- 8. Research Methodology
List of Figures
- Figure 1: Australia & New Zealand Water Treatment Chemicals Industry Revenue Breakdown (billion, %) by Product 2025 & 2033
- Figure 2: Australia & New Zealand Water Treatment Chemicals Industry Share (%) by Company 2025
List of Tables
- Table 1: Australia & New Zealand Water Treatment Chemicals Industry Revenue billion Forecast, by Product Type 2020 & 2033
- Table 2: Australia & New Zealand Water Treatment Chemicals Industry Volume K Tons Forecast, by Product Type 2020 & 2033
- Table 3: Australia & New Zealand Water Treatment Chemicals Industry Revenue billion Forecast, by End-user Industry 2020 & 2033
- Table 4: Australia & New Zealand Water Treatment Chemicals Industry Volume K Tons Forecast, by End-user Industry 2020 & 2033
- Table 5: Australia & New Zealand Water Treatment Chemicals Industry Revenue billion Forecast, by Region 2020 & 2033
- Table 6: Australia & New Zealand Water Treatment Chemicals Industry Volume K Tons Forecast, by Region 2020 & 2033
- Table 7: Australia & New Zealand Water Treatment Chemicals Industry Revenue billion Forecast, by Product Type 2020 & 2033
- Table 8: Australia & New Zealand Water Treatment Chemicals Industry Volume K Tons Forecast, by Product Type 2020 & 2033
- Table 9: Australia & New Zealand Water Treatment Chemicals Industry Revenue billion Forecast, by End-user Industry 2020 & 2033
- Table 10: Australia & New Zealand Water Treatment Chemicals Industry Volume K Tons Forecast, by End-user Industry 2020 & 2033
- Table 11: Australia & New Zealand Water Treatment Chemicals Industry Revenue billion Forecast, by Country 2020 & 2033
- Table 12: Australia & New Zealand Water Treatment Chemicals Industry Volume K Tons Forecast, by Country 2020 & 2033
Frequently Asked Questions
1. What is the projected Compound Annual Growth Rate (CAGR) of the Australia & New Zealand Water Treatment Chemicals Industry?
The projected CAGR is approximately 5.6%.
2. Which companies are prominent players in the Australia & New Zealand Water Treatment Chemicals Industry?
Key companies in the market include Kemira Oyj, Coogee, Ecolab, SNF, IWTS Group Pty Ltd, Solvay, Buckman, Aquasol, Dow, Solenis, Ixom, Albemarle Corporation, Veolia (Veolia Water Technologies).
3. What are the main segments of the Australia & New Zealand Water Treatment Chemicals Industry?
The market segments include Product Type, End-user Industry.
4. Can you provide details about the market size?
The market size is estimated to be USD 1.1 billion as of 2022.
5. What are some drivers contributing to market growth?
Rising Groundwater and Surface Water Pollution; Growing Demand From Power and Industrial Applications; Increasing Government Intervention in Reliable Wastewater Management; Substitution of Other Polyethylene Products.
6. What are the notable trends driving market growth?
Municipal End-user Industry to Dominate the Market.
7. Are there any restraints impacting market growth?
Hazardous Nature of Hydrazine; Emerging Alternatives to Water Treatment Chemicals.
8. Can you provide examples of recent developments in the market?
N/A
9. What pricing options are available for accessing the report?
Pricing options include single-user, multi-user, and enterprise licenses priced at USD 3,950, USD 4,950, and USD 6,950 respectively.
10. Is the market size provided in terms of value or volume?
The market size is provided in terms of value, measured in billion and volume, measured in K Tons.
11. Are there any specific market keywords associated with the report?
Yes, the market keyword associated with the report is "Australia & New Zealand Water Treatment Chemicals Industry," which aids in identifying and referencing the specific market segment covered.
12. How do I determine which pricing option suits my needs best?
The pricing options vary based on user requirements and access needs. Individual users may opt for single-user licenses, while businesses requiring broader access may choose multi-user or enterprise licenses for cost-effective access to the report.
13. Are there any additional resources or data provided in the Australia & New Zealand Water Treatment Chemicals Industry report?
While the report offers comprehensive insights, it's advisable to review the specific contents or supplementary materials provided to ascertain if additional resources or data are available.
14. How can I stay updated on further developments or reports in the Australia & New Zealand Water Treatment Chemicals Industry?
To stay informed about further developments, trends, and reports in the Australia & New Zealand Water Treatment Chemicals Industry, consider subscribing to industry newsletters, following relevant companies and organizations, or regularly checking reputable industry news sources and publications.
Methodology
Step 1 - Identification of Relevant Samples Size from Population Database


Step 2 - Approaches for Defining Global Market Size (Value, Volume* & Price*)

Note*: In applicable scenarios
Step 3 - Data Sources
Primary Research
- Web Analytics
- Survey Reports
- Research Institute
- Latest Research Reports
- Opinion Leaders
Secondary Research
- Annual Reports
- White Paper
- Latest Press Release
- Industry Association
- Paid Database
- Investor Presentations

Step 4 - Data Triangulation
Involves using different sources of information in order to increase the validity of a study
These sources are likely to be stakeholders in a program - participants, other researchers, program staff, other community members, and so on.
Then we put all data in single framework & apply various statistical tools to find out the dynamic on the market.
During the analysis stage, feedback from the stakeholder groups would be compared to determine areas of agreement as well as areas of divergence