

Key Insights
The Asia-Pacific syngas market is poised for substantial expansion, driven by escalating energy demands and industrial growth across key economies like China and India. With a projected Compound Annual Growth Rate (CAGR) of 6.4%, the market is estimated to reach a size of 44.39 billion by the base year of 2024. Coal and natural gas are the primary feedstocks, supported by abundant regional reserves. While steam reforming remains dominant, advancements in auto-thermal reforming and biomass gasification are accelerating due to stringent environmental regulations and the pursuit of renewable energy solutions. Syngas applications predominantly lie in power generation and chemical production, with growing interest in dimethyl ether (DME) as a sustainable fuel alternative.
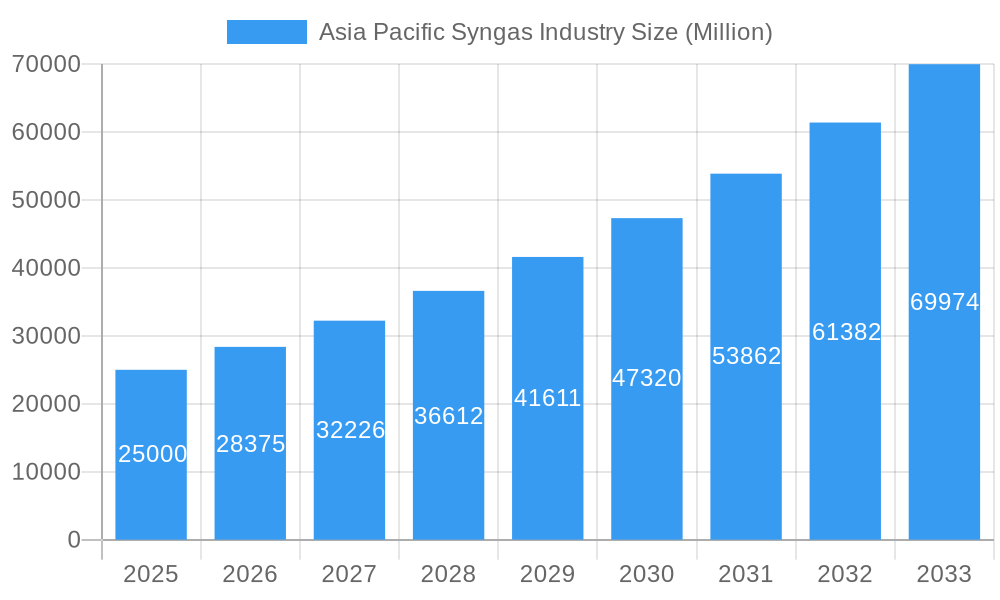
Asia Pacific Syngas Industry Market Size (In Billion)
The competitive landscape features industry leaders such as Haldor Topsoe, General Electric, and Air Products & Chemicals Inc., who are actively pursuing innovation and strategic alliances. Government initiatives promoting energy diversification and industrial development further catalyze market growth. The forecast period of 2025-2033 anticipates continued expansion, underpinned by sustained economic momentum and infrastructure investments. Despite potential headwinds from volatile feedstock prices and environmental considerations, the market outlook remains optimistic. The increasing adoption of cleaner technologies and the diversification of applications, including the production of high-value chemicals and sustainable fuels, will define the future trajectory. China and India are expected to lead regional growth, reflecting their significant energy requirements and industrial capabilities.
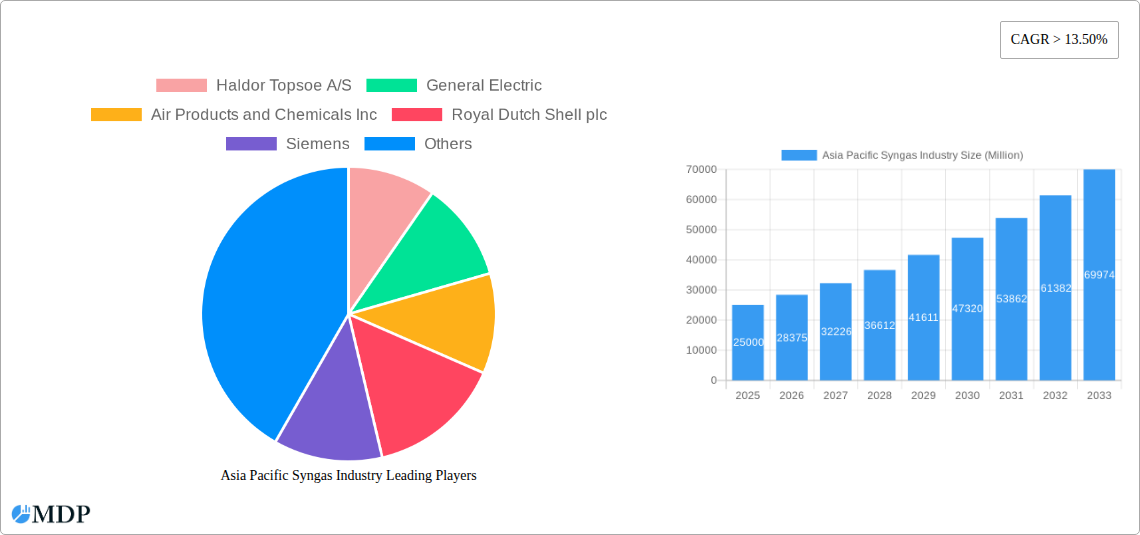
Asia Pacific Syngas Industry Company Market Share
Asia Pacific Syngas Industry Market Report: 2019-2033
This comprehensive report provides an in-depth analysis of the Asia Pacific syngas industry, offering crucial insights for stakeholders seeking to navigate this dynamic market. Covering the period 2019-2033, with a focus on 2025, this report unveils market trends, leading players, and future opportunities within the Asia Pacific region. With detailed segmentation by feedstock, technology, gasifier type, and application, this report is an indispensable resource for strategic decision-making.
Asia Pacific Syngas Industry Market Dynamics & Concentration
The Asia Pacific syngas market exhibits a moderately concentrated landscape, with several major players holding significant market share. Market concentration is influenced by factors such as technological advancements, stringent environmental regulations, and the increasing demand for cleaner energy sources. Innovation drivers, including the development of advanced gasification technologies and the integration of renewable energy sources, are shaping the competitive dynamics. Stringent emission standards and policies promoting sustainable energy are key regulatory factors. Product substitutes, like biofuels and hydrogen produced through electrolysis, pose a competitive challenge. End-user trends, particularly the growing demand for chemicals and power generation, fuel market growth. M&A activities within the industry have been moderate in recent years, with approximately xx deals recorded between 2019 and 2024, resulting in a market share shift of approximately xx%.
- Market Share: Top 5 players hold approximately xx% of the market share in 2025.
- M&A Activity: xx deals were recorded between 2019 and 2024.
- Innovation Drivers: Advanced gasification technologies, integration of renewable energy.
- Regulatory Frameworks: Stringent emission standards, policies promoting sustainable energy.
- Product Substitutes: Biofuels, electrolytically produced hydrogen.
Asia Pacific Syngas Industry Industry Trends & Analysis
The Asia Pacific syngas market is experiencing robust growth, driven by increasing energy demands, industrialization, and supportive government policies. The CAGR for the forecast period (2025-2033) is estimated at xx%, with market penetration expected to reach xx% by 2033. Technological advancements, particularly in gasification and syngas conversion technologies, are significantly impacting the market. Consumer preferences are shifting towards cleaner and more sustainable energy sources, favoring syngas derived from renewable feedstocks. Intense competition among established players and new entrants is driving innovation and price optimization.
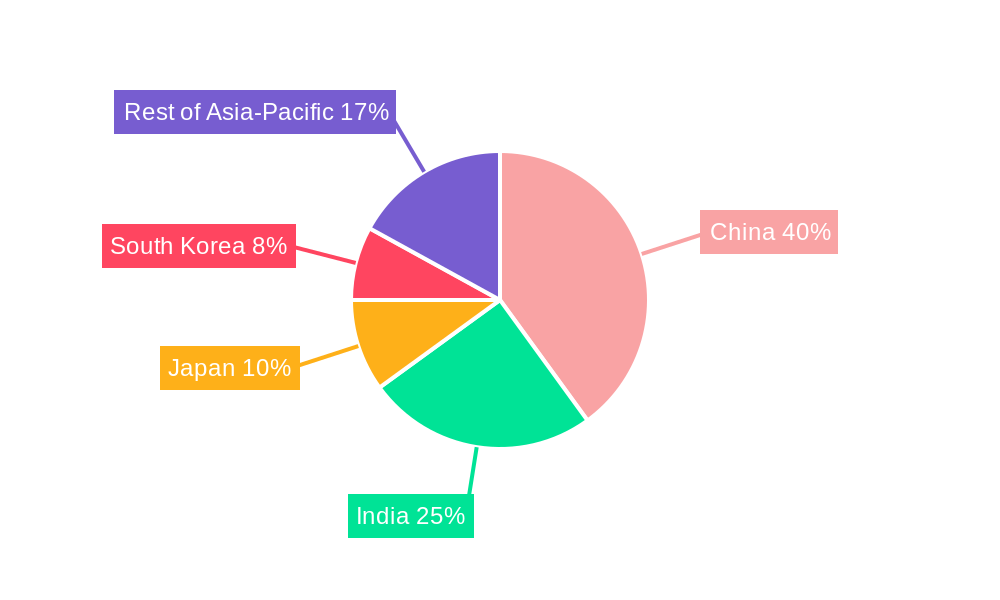
Leading Markets & Segments in Asia Pacific Syngas Industry
China and India are the dominant markets in the Asia Pacific syngas industry, accounting for approximately xx% of the total market in 2025. Natural gas is the leading feedstock, followed by coal, owing to its abundant availability and established infrastructure. Steam reforming is the most prevalent technology due to its maturity and efficiency. Power generation and chemical production remain the key application segments, contributing approximately xx% and xx% of the market, respectively.
- Key Drivers in China: Favorable government policies, robust industrial growth, large coal reserves.
- Key Drivers in India: Rapid industrialization, increasing energy demand, government initiatives promoting cleaner energy.
- Dominant Feedstock: Natural gas (xx%), Coal (xx%), others (xx%).
- Dominant Technology: Steam Reforming (xx%), Partial Oxidation (xx%), others (xx%).
- Dominant Application: Power Generation (xx%), Chemicals (xx%), others (xx%).
Asia Pacific Syngas Industry Product Developments
Recent product innovations focus on improving efficiency, reducing emissions, and expanding applications of syngas. Advanced gasification technologies that utilize diverse feedstocks, including biomass, are gaining traction. The development of integrated syngas-to-chemicals processes is improving overall profitability and reducing environmental impact. These advancements enhance market competitiveness and product differentiation.
Key Drivers of Asia Pacific Syngas Industry Growth
The Asia Pacific syngas market is propelled by several key factors. Firstly, the increasing demand for power and chemicals fuels growth. Secondly, supportive government policies promoting cleaner energy sources are encouraging investment. Thirdly, technological advancements are improving efficiency and reducing costs. Lastly, the abundance of natural gas and coal resources in several Asia Pacific countries provides a substantial feedstock base.
Challenges in the Asia Pacific Syngas Industry Market
The Asia Pacific syngas industry faces challenges such as stringent environmental regulations leading to higher compliance costs, volatile feedstock prices impacting profitability, and intense competition requiring continuous innovation. Supply chain disruptions and infrastructure limitations in some regions also pose significant obstacles. These factors collectively impact the market's overall growth.
Emerging Opportunities in Asia Pacific Syngas Industry
The long-term growth of the Asia Pacific syngas industry is poised to be fueled by several emerging opportunities. Advancements in gasification technologies that can handle a wider range of feedstocks, including waste biomass, offer significant potential for sustainable syngas production. Strategic partnerships between energy companies and chemical producers are paving the way for integrated production facilities. Market expansion into new geographic regions with abundant resources will further propel market growth.
Leading Players in the Asia Pacific Syngas Industry Sector
- Haldor Topsoe A/S
- General Electric
- Air Products and Chemicals Inc
- Royal Dutch Shell plc
- Siemens
- KBR Inc
- BASF SE
- Sasol
- DuPont
- Linde plc
- SynGas Technology LLC
- Air Liquide
- BP p l c
- TechnipFMC plc
- *List Not Exhaustive
Key Milestones in Asia Pacific Syngas Industry Industry
- September 2023: BASF SE initiates construction of a syngas plant in Zhanjiang, China, scheduled for operation in 2025.
- December 2022: Reliance Industries Ltd announces plans to produce blue hydrogen at USD 1.2-1.5/kg, expanding the syngas market in India.
- December 2022: New Era Cleantech invests USD 2.5 Billion in a coal gasification plant in Chandrapur, India, producing syngas, hydrogen, methanol, and ammonia/urea.
Strategic Outlook for Asia Pacific Syngas Industry Market
The Asia Pacific syngas market holds immense potential for growth, driven by increasing energy demands, supportive government policies, and technological advancements. Strategic partnerships, investments in R&D, and the development of sustainable gasification technologies will be crucial for capturing this potential. Expansion into new applications and geographic markets will further enhance growth opportunities in the coming years.
Asia Pacific Syngas Industry Segmentation
-
1. Feedstock
- 1.1. Coal
- 1.2. Natural Gas
- 1.3. Petroleum
- 1.4. Pet Coke
- 1.5. Biomass
-
2. Technology
- 2.1. Steam Reforming
- 2.2. Partial Oxidation
- 2.3. Auto-thermal Reforming
- 2.4. Combined or Two-step Reforming
- 2.5. Biomass Gasification
-
3. Gasifier Type
- 3.1. Fixed Bed
- 3.2. Entrained Flow
- 3.3. Fluidized Bed
-
4. Application
- 4.1. Power Generation
-
4.2. Chemicals
- 4.2.1. Methanol
- 4.2.2. Ammonia
- 4.2.3. Oxo Chemicals
- 4.2.4. n-Butanol
- 4.2.5. Hydrogen
- 4.2.6. Dimethyl Ether
- 4.3. Liquid Fuels
- 4.4. Gaseous Fuels
-
5. Geography
- 5.1. China
- 5.2. India
- 5.3. Japan
- 5.4. South Korea
- 5.5. Australia & New Zealand
- 5.6. Rest of Asia-Pacific
Asia Pacific Syngas Industry Segmentation By Geography
- 1. China
- 2. India
- 3. Japan
- 4. South Korea
- 5. Australia
- 6. Rest of Asia Pacific
Asia Pacific Syngas Industry Regional Market Share
Geographic Coverage of Asia Pacific Syngas Industry
Asia Pacific Syngas Industry REPORT HIGHLIGHTS
| Aspects | Details |
|---|---|
| Study Period | 2020-2034 |
| Base Year | 2025 |
| Estimated Year | 2026 |
| Forecast Period | 2026-2034 |
| Historical Period | 2020-2025 |
| Growth Rate | CAGR of 6.4% from 2020-2034 |
| Segmentation |
|
Table of Contents
- 1. Introduction
- 1.1. Research Scope
- 1.2. Market Segmentation
- 1.3. Research Objective
- 1.4. Definitions and Assumptions
- 2. Executive Summary
- 2.1. Market Snapshot
- 3. Market Dynamics
- 3.1. Market Drivers
- 3.2. Market Restrains
- 3.3. Market Trends
- 3.4. Market Opportunities
- 4. Market Factor Analysis
- 4.1. Porters Five Forces
- 4.1.1. Bargaining Power of Suppliers
- 4.1.2. Bargaining Power of Buyers
- 4.1.3. Threat of New Entrants
- 4.1.4. Threat of Substitutes
- 4.1.5. Competitive Rivalry
- 4.2. PESTEL analysis
- 4.3. BCG Analysis
- 4.3.1. Stars (High Growth, High Market Share)
- 4.3.2. Cash Cows (Low Growth, High Market Share)
- 4.3.3. Question Mark (High Growth, Low Market Share)
- 4.3.4. Dogs (Low Growth, Low Market Share)
- 4.4. Ansoff Matrix Analysis
- 4.5. Supply Chain Analysis
- 4.6. Regulatory Landscape
- 4.7. Current Market Potential and Opportunity Assessment (TAM–SAM–SOM Framework)
- 4.8. MDP Analyst Note
- 4.1. Porters Five Forces
- 5. Market Analysis, Insights and Forecast 2021-2033
- 5.1. Market Analysis, Insights and Forecast - by Feedstock
- 5.1.1. Coal
- 5.1.2. Natural Gas
- 5.1.3. Petroleum
- 5.1.4. Pet Coke
- 5.1.5. Biomass
- 5.2. Market Analysis, Insights and Forecast - by Technology
- 5.2.1. Steam Reforming
- 5.2.2. Partial Oxidation
- 5.2.3. Auto-thermal Reforming
- 5.2.4. Combined or Two-step Reforming
- 5.2.5. Biomass Gasification
- 5.3. Market Analysis, Insights and Forecast - by Gasifier Type
- 5.3.1. Fixed Bed
- 5.3.2. Entrained Flow
- 5.3.3. Fluidized Bed
- 5.4. Market Analysis, Insights and Forecast - by Application
- 5.4.1. Power Generation
- 5.4.2. Chemicals
- 5.4.2.1. Methanol
- 5.4.2.2. Ammonia
- 5.4.2.3. Oxo Chemicals
- 5.4.2.4. n-Butanol
- 5.4.2.5. Hydrogen
- 5.4.2.6. Dimethyl Ether
- 5.4.3. Liquid Fuels
- 5.4.4. Gaseous Fuels
- 5.5. Market Analysis, Insights and Forecast - by Geography
- 5.5.1. China
- 5.5.2. India
- 5.5.3. Japan
- 5.5.4. South Korea
- 5.5.5. Australia & New Zealand
- 5.5.6. Rest of Asia-Pacific
- 5.6. Market Analysis, Insights and Forecast - by Region
- 5.6.1. China
- 5.6.2. India
- 5.6.3. Japan
- 5.6.4. South Korea
- 5.6.5. Australia
- 5.6.6. Rest of Asia Pacific
- 5.1. Market Analysis, Insights and Forecast - by Feedstock
- 6. Asia Pacific Syngas Industry Analysis, Insights and Forecast, 2021-2033
- 6.1. Market Analysis, Insights and Forecast - by Feedstock
- 6.1.1. Coal
- 6.1.2. Natural Gas
- 6.1.3. Petroleum
- 6.1.4. Pet Coke
- 6.1.5. Biomass
- 6.2. Market Analysis, Insights and Forecast - by Technology
- 6.2.1. Steam Reforming
- 6.2.2. Partial Oxidation
- 6.2.3. Auto-thermal Reforming
- 6.2.4. Combined or Two-step Reforming
- 6.2.5. Biomass Gasification
- 6.3. Market Analysis, Insights and Forecast - by Gasifier Type
- 6.3.1. Fixed Bed
- 6.3.2. Entrained Flow
- 6.3.3. Fluidized Bed
- 6.4. Market Analysis, Insights and Forecast - by Application
- 6.4.1. Power Generation
- 6.4.2. Chemicals
- 6.4.2.1. Methanol
- 6.4.2.2. Ammonia
- 6.4.2.3. Oxo Chemicals
- 6.4.2.4. n-Butanol
- 6.4.2.5. Hydrogen
- 6.4.2.6. Dimethyl Ether
- 6.4.3. Liquid Fuels
- 6.4.4. Gaseous Fuels
- 6.5. Market Analysis, Insights and Forecast - by Geography
- 6.5.1. China
- 6.5.2. India
- 6.5.3. Japan
- 6.5.4. South Korea
- 6.5.5. Australia & New Zealand
- 6.5.6. Rest of Asia-Pacific
- 6.1. Market Analysis, Insights and Forecast - by Feedstock
- 7. China Asia Pacific Syngas Industry Analysis, Insights and Forecast, 2020-2032
- 7.1. Market Analysis, Insights and Forecast - by Feedstock
- 7.1.1. Coal
- 7.1.2. Natural Gas
- 7.1.3. Petroleum
- 7.1.4. Pet Coke
- 7.1.5. Biomass
- 7.2. Market Analysis, Insights and Forecast - by Technology
- 7.2.1. Steam Reforming
- 7.2.2. Partial Oxidation
- 7.2.3. Auto-thermal Reforming
- 7.2.4. Combined or Two-step Reforming
- 7.2.5. Biomass Gasification
- 7.3. Market Analysis, Insights and Forecast - by Gasifier Type
- 7.3.1. Fixed Bed
- 7.3.2. Entrained Flow
- 7.3.3. Fluidized Bed
- 7.4. Market Analysis, Insights and Forecast - by Application
- 7.4.1. Power Generation
- 7.4.2. Chemicals
- 7.4.2.1. Methanol
- 7.4.2.2. Ammonia
- 7.4.2.3. Oxo Chemicals
- 7.4.2.4. n-Butanol
- 7.4.2.5. Hydrogen
- 7.4.2.6. Dimethyl Ether
- 7.4.3. Liquid Fuels
- 7.4.4. Gaseous Fuels
- 7.5. Market Analysis, Insights and Forecast - by Geography
- 7.5.1. China
- 7.5.2. India
- 7.5.3. Japan
- 7.5.4. South Korea
- 7.5.5. Australia & New Zealand
- 7.5.6. Rest of Asia-Pacific
- 7.1. Market Analysis, Insights and Forecast - by Feedstock
- 8. India Asia Pacific Syngas Industry Analysis, Insights and Forecast, 2020-2032
- 8.1. Market Analysis, Insights and Forecast - by Feedstock
- 8.1.1. Coal
- 8.1.2. Natural Gas
- 8.1.3. Petroleum
- 8.1.4. Pet Coke
- 8.1.5. Biomass
- 8.2. Market Analysis, Insights and Forecast - by Technology
- 8.2.1. Steam Reforming
- 8.2.2. Partial Oxidation
- 8.2.3. Auto-thermal Reforming
- 8.2.4. Combined or Two-step Reforming
- 8.2.5. Biomass Gasification
- 8.3. Market Analysis, Insights and Forecast - by Gasifier Type
- 8.3.1. Fixed Bed
- 8.3.2. Entrained Flow
- 8.3.3. Fluidized Bed
- 8.4. Market Analysis, Insights and Forecast - by Application
- 8.4.1. Power Generation
- 8.4.2. Chemicals
- 8.4.2.1. Methanol
- 8.4.2.2. Ammonia
- 8.4.2.3. Oxo Chemicals
- 8.4.2.4. n-Butanol
- 8.4.2.5. Hydrogen
- 8.4.2.6. Dimethyl Ether
- 8.4.3. Liquid Fuels
- 8.4.4. Gaseous Fuels
- 8.5. Market Analysis, Insights and Forecast - by Geography
- 8.5.1. China
- 8.5.2. India
- 8.5.3. Japan
- 8.5.4. South Korea
- 8.5.5. Australia & New Zealand
- 8.5.6. Rest of Asia-Pacific
- 8.1. Market Analysis, Insights and Forecast - by Feedstock
- 9. Japan Asia Pacific Syngas Industry Analysis, Insights and Forecast, 2020-2032
- 9.1. Market Analysis, Insights and Forecast - by Feedstock
- 9.1.1. Coal
- 9.1.2. Natural Gas
- 9.1.3. Petroleum
- 9.1.4. Pet Coke
- 9.1.5. Biomass
- 9.2. Market Analysis, Insights and Forecast - by Technology
- 9.2.1. Steam Reforming
- 9.2.2. Partial Oxidation
- 9.2.3. Auto-thermal Reforming
- 9.2.4. Combined or Two-step Reforming
- 9.2.5. Biomass Gasification
- 9.3. Market Analysis, Insights and Forecast - by Gasifier Type
- 9.3.1. Fixed Bed
- 9.3.2. Entrained Flow
- 9.3.3. Fluidized Bed
- 9.4. Market Analysis, Insights and Forecast - by Application
- 9.4.1. Power Generation
- 9.4.2. Chemicals
- 9.4.2.1. Methanol
- 9.4.2.2. Ammonia
- 9.4.2.3. Oxo Chemicals
- 9.4.2.4. n-Butanol
- 9.4.2.5. Hydrogen
- 9.4.2.6. Dimethyl Ether
- 9.4.3. Liquid Fuels
- 9.4.4. Gaseous Fuels
- 9.5. Market Analysis, Insights and Forecast - by Geography
- 9.5.1. China
- 9.5.2. India
- 9.5.3. Japan
- 9.5.4. South Korea
- 9.5.5. Australia & New Zealand
- 9.5.6. Rest of Asia-Pacific
- 9.1. Market Analysis, Insights and Forecast - by Feedstock
- 10. South Korea Asia Pacific Syngas Industry Analysis, Insights and Forecast, 2020-2032
- 10.1. Market Analysis, Insights and Forecast - by Feedstock
- 10.1.1. Coal
- 10.1.2. Natural Gas
- 10.1.3. Petroleum
- 10.1.4. Pet Coke
- 10.1.5. Biomass
- 10.2. Market Analysis, Insights and Forecast - by Technology
- 10.2.1. Steam Reforming
- 10.2.2. Partial Oxidation
- 10.2.3. Auto-thermal Reforming
- 10.2.4. Combined or Two-step Reforming
- 10.2.5. Biomass Gasification
- 10.3. Market Analysis, Insights and Forecast - by Gasifier Type
- 10.3.1. Fixed Bed
- 10.3.2. Entrained Flow
- 10.3.3. Fluidized Bed
- 10.4. Market Analysis, Insights and Forecast - by Application
- 10.4.1. Power Generation
- 10.4.2. Chemicals
- 10.4.2.1. Methanol
- 10.4.2.2. Ammonia
- 10.4.2.3. Oxo Chemicals
- 10.4.2.4. n-Butanol
- 10.4.2.5. Hydrogen
- 10.4.2.6. Dimethyl Ether
- 10.4.3. Liquid Fuels
- 10.4.4. Gaseous Fuels
- 10.5. Market Analysis, Insights and Forecast - by Geography
- 10.5.1. China
- 10.5.2. India
- 10.5.3. Japan
- 10.5.4. South Korea
- 10.5.5. Australia & New Zealand
- 10.5.6. Rest of Asia-Pacific
- 10.1. Market Analysis, Insights and Forecast - by Feedstock
- 11. Australia Asia Pacific Syngas Industry Analysis, Insights and Forecast, 2020-2032
- 11.1. Market Analysis, Insights and Forecast - by Feedstock
- 11.1.1. Coal
- 11.1.2. Natural Gas
- 11.1.3. Petroleum
- 11.1.4. Pet Coke
- 11.1.5. Biomass
- 11.2. Market Analysis, Insights and Forecast - by Technology
- 11.2.1. Steam Reforming
- 11.2.2. Partial Oxidation
- 11.2.3. Auto-thermal Reforming
- 11.2.4. Combined or Two-step Reforming
- 11.2.5. Biomass Gasification
- 11.3. Market Analysis, Insights and Forecast - by Gasifier Type
- 11.3.1. Fixed Bed
- 11.3.2. Entrained Flow
- 11.3.3. Fluidized Bed
- 11.4. Market Analysis, Insights and Forecast - by Application
- 11.4.1. Power Generation
- 11.4.2. Chemicals
- 11.4.2.1. Methanol
- 11.4.2.2. Ammonia
- 11.4.2.3. Oxo Chemicals
- 11.4.2.4. n-Butanol
- 11.4.2.5. Hydrogen
- 11.4.2.6. Dimethyl Ether
- 11.4.3. Liquid Fuels
- 11.4.4. Gaseous Fuels
- 11.5. Market Analysis, Insights and Forecast - by Geography
- 11.5.1. China
- 11.5.2. India
- 11.5.3. Japan
- 11.5.4. South Korea
- 11.5.5. Australia & New Zealand
- 11.5.6. Rest of Asia-Pacific
- 11.1. Market Analysis, Insights and Forecast - by Feedstock
- 12. Rest of Asia Pacific Asia Pacific Syngas Industry Analysis, Insights and Forecast, 2020-2032
- 12.1. Market Analysis, Insights and Forecast - by Feedstock
- 12.1.1. Coal
- 12.1.2. Natural Gas
- 12.1.3. Petroleum
- 12.1.4. Pet Coke
- 12.1.5. Biomass
- 12.2. Market Analysis, Insights and Forecast - by Technology
- 12.2.1. Steam Reforming
- 12.2.2. Partial Oxidation
- 12.2.3. Auto-thermal Reforming
- 12.2.4. Combined or Two-step Reforming
- 12.2.5. Biomass Gasification
- 12.3. Market Analysis, Insights and Forecast - by Gasifier Type
- 12.3.1. Fixed Bed
- 12.3.2. Entrained Flow
- 12.3.3. Fluidized Bed
- 12.4. Market Analysis, Insights and Forecast - by Application
- 12.4.1. Power Generation
- 12.4.2. Chemicals
- 12.4.2.1. Methanol
- 12.4.2.2. Ammonia
- 12.4.2.3. Oxo Chemicals
- 12.4.2.4. n-Butanol
- 12.4.2.5. Hydrogen
- 12.4.2.6. Dimethyl Ether
- 12.4.3. Liquid Fuels
- 12.4.4. Gaseous Fuels
- 12.5. Market Analysis, Insights and Forecast - by Geography
- 12.5.1. China
- 12.5.2. India
- 12.5.3. Japan
- 12.5.4. South Korea
- 12.5.5. Australia & New Zealand
- 12.5.6. Rest of Asia-Pacific
- 12.1. Market Analysis, Insights and Forecast - by Feedstock
- 13. Competitive Analysis
- 13.1. Company Profiles
- 13.1.1 Haldor Topsoe A/S
- 13.1.1.1. Company Overview
- 13.1.1.2. Products
- 13.1.1.3. Company Financials
- 13.1.1.4. SWOT Analysis
- 13.1.2 General Electric
- 13.1.2.1. Company Overview
- 13.1.2.2. Products
- 13.1.2.3. Company Financials
- 13.1.2.4. SWOT Analysis
- 13.1.3 Air Products and Chemicals Inc
- 13.1.3.1. Company Overview
- 13.1.3.2. Products
- 13.1.3.3. Company Financials
- 13.1.3.4. SWOT Analysis
- 13.1.4 Royal Dutch Shell plc
- 13.1.4.1. Company Overview
- 13.1.4.2. Products
- 13.1.4.3. Company Financials
- 13.1.4.4. SWOT Analysis
- 13.1.5 Siemens
- 13.1.5.1. Company Overview
- 13.1.5.2. Products
- 13.1.5.3. Company Financials
- 13.1.5.4. SWOT Analysis
- 13.1.6 KBR Inc
- 13.1.6.1. Company Overview
- 13.1.6.2. Products
- 13.1.6.3. Company Financials
- 13.1.6.4. SWOT Analysis
- 13.1.7 BASF SE
- 13.1.7.1. Company Overview
- 13.1.7.2. Products
- 13.1.7.3. Company Financials
- 13.1.7.4. SWOT Analysis
- 13.1.8 Sasol
- 13.1.8.1. Company Overview
- 13.1.8.2. Products
- 13.1.8.3. Company Financials
- 13.1.8.4. SWOT Analysis
- 13.1.9 DuPont
- 13.1.9.1. Company Overview
- 13.1.9.2. Products
- 13.1.9.3. Company Financials
- 13.1.9.4. SWOT Analysis
- 13.1.10 Linde plc
- 13.1.10.1. Company Overview
- 13.1.10.2. Products
- 13.1.10.3. Company Financials
- 13.1.10.4. SWOT Analysis
- 13.1.11 SynGas Technology LLC
- 13.1.11.1. Company Overview
- 13.1.11.2. Products
- 13.1.11.3. Company Financials
- 13.1.11.4. SWOT Analysis
- 13.1.12 Air Liquide
- 13.1.12.1. Company Overview
- 13.1.12.2. Products
- 13.1.12.3. Company Financials
- 13.1.12.4. SWOT Analysis
- 13.1.13 BP p l c
- 13.1.13.1. Company Overview
- 13.1.13.2. Products
- 13.1.13.3. Company Financials
- 13.1.13.4. SWOT Analysis
- 13.1.14 TechnipFMC plc*List Not Exhaustive
- 13.1.14.1. Company Overview
- 13.1.14.2. Products
- 13.1.14.3. Company Financials
- 13.1.14.4. SWOT Analysis
- 13.1.1 Haldor Topsoe A/S
- 13.2. Market Entropy
- 13.2.1 Company's Key Areas Served
- 13.2.2 Recent Developments
- 13.3. Company Market Share Analysis 2025
- 13.3.1 Top 5 Companies Market Share Analysis
- 13.3.2 Top 3 Companies Market Share Analysis
- 13.4. List of Potential Customers
- 14. Research Methodology
List of Figures
- Figure 1: Asia Pacific Syngas Industry Revenue Breakdown (billion, %) by Product 2025 & 2033
- Figure 2: Asia Pacific Syngas Industry Share (%) by Company 2025
List of Tables
- Table 1: Asia Pacific Syngas Industry Revenue billion Forecast, by Feedstock 2020 & 2033
- Table 2: Asia Pacific Syngas Industry Volume Million Forecast, by Feedstock 2020 & 2033
- Table 3: Asia Pacific Syngas Industry Revenue billion Forecast, by Technology 2020 & 2033
- Table 4: Asia Pacific Syngas Industry Volume Million Forecast, by Technology 2020 & 2033
- Table 5: Asia Pacific Syngas Industry Revenue billion Forecast, by Gasifier Type 2020 & 2033
- Table 6: Asia Pacific Syngas Industry Volume Million Forecast, by Gasifier Type 2020 & 2033
- Table 7: Asia Pacific Syngas Industry Revenue billion Forecast, by Application 2020 & 2033
- Table 8: Asia Pacific Syngas Industry Volume Million Forecast, by Application 2020 & 2033
- Table 9: Asia Pacific Syngas Industry Revenue billion Forecast, by Geography 2020 & 2033
- Table 10: Asia Pacific Syngas Industry Volume Million Forecast, by Geography 2020 & 2033
- Table 11: Asia Pacific Syngas Industry Revenue billion Forecast, by Region 2020 & 2033
- Table 12: Asia Pacific Syngas Industry Volume Million Forecast, by Region 2020 & 2033
- Table 13: Asia Pacific Syngas Industry Revenue billion Forecast, by Feedstock 2020 & 2033
- Table 14: Asia Pacific Syngas Industry Volume Million Forecast, by Feedstock 2020 & 2033
- Table 15: Asia Pacific Syngas Industry Revenue billion Forecast, by Technology 2020 & 2033
- Table 16: Asia Pacific Syngas Industry Volume Million Forecast, by Technology 2020 & 2033
- Table 17: Asia Pacific Syngas Industry Revenue billion Forecast, by Gasifier Type 2020 & 2033
- Table 18: Asia Pacific Syngas Industry Volume Million Forecast, by Gasifier Type 2020 & 2033
- Table 19: Asia Pacific Syngas Industry Revenue billion Forecast, by Application 2020 & 2033
- Table 20: Asia Pacific Syngas Industry Volume Million Forecast, by Application 2020 & 2033
- Table 21: Asia Pacific Syngas Industry Revenue billion Forecast, by Geography 2020 & 2033
- Table 22: Asia Pacific Syngas Industry Volume Million Forecast, by Geography 2020 & 2033
- Table 23: Asia Pacific Syngas Industry Revenue billion Forecast, by Country 2020 & 2033
- Table 24: Asia Pacific Syngas Industry Volume Million Forecast, by Country 2020 & 2033
- Table 25: Asia Pacific Syngas Industry Revenue billion Forecast, by Feedstock 2020 & 2033
- Table 26: Asia Pacific Syngas Industry Volume Million Forecast, by Feedstock 2020 & 2033
- Table 27: Asia Pacific Syngas Industry Revenue billion Forecast, by Technology 2020 & 2033
- Table 28: Asia Pacific Syngas Industry Volume Million Forecast, by Technology 2020 & 2033
- Table 29: Asia Pacific Syngas Industry Revenue billion Forecast, by Gasifier Type 2020 & 2033
- Table 30: Asia Pacific Syngas Industry Volume Million Forecast, by Gasifier Type 2020 & 2033
- Table 31: Asia Pacific Syngas Industry Revenue billion Forecast, by Application 2020 & 2033
- Table 32: Asia Pacific Syngas Industry Volume Million Forecast, by Application 2020 & 2033
- Table 33: Asia Pacific Syngas Industry Revenue billion Forecast, by Geography 2020 & 2033
- Table 34: Asia Pacific Syngas Industry Volume Million Forecast, by Geography 2020 & 2033
- Table 35: Asia Pacific Syngas Industry Revenue billion Forecast, by Country 2020 & 2033
- Table 36: Asia Pacific Syngas Industry Volume Million Forecast, by Country 2020 & 2033
- Table 37: Asia Pacific Syngas Industry Revenue billion Forecast, by Feedstock 2020 & 2033
- Table 38: Asia Pacific Syngas Industry Volume Million Forecast, by Feedstock 2020 & 2033
- Table 39: Asia Pacific Syngas Industry Revenue billion Forecast, by Technology 2020 & 2033
- Table 40: Asia Pacific Syngas Industry Volume Million Forecast, by Technology 2020 & 2033
- Table 41: Asia Pacific Syngas Industry Revenue billion Forecast, by Gasifier Type 2020 & 2033
- Table 42: Asia Pacific Syngas Industry Volume Million Forecast, by Gasifier Type 2020 & 2033
- Table 43: Asia Pacific Syngas Industry Revenue billion Forecast, by Application 2020 & 2033
- Table 44: Asia Pacific Syngas Industry Volume Million Forecast, by Application 2020 & 2033
- Table 45: Asia Pacific Syngas Industry Revenue billion Forecast, by Geography 2020 & 2033
- Table 46: Asia Pacific Syngas Industry Volume Million Forecast, by Geography 2020 & 2033
- Table 47: Asia Pacific Syngas Industry Revenue billion Forecast, by Country 2020 & 2033
- Table 48: Asia Pacific Syngas Industry Volume Million Forecast, by Country 2020 & 2033
- Table 49: Asia Pacific Syngas Industry Revenue billion Forecast, by Feedstock 2020 & 2033
- Table 50: Asia Pacific Syngas Industry Volume Million Forecast, by Feedstock 2020 & 2033
- Table 51: Asia Pacific Syngas Industry Revenue billion Forecast, by Technology 2020 & 2033
- Table 52: Asia Pacific Syngas Industry Volume Million Forecast, by Technology 2020 & 2033
- Table 53: Asia Pacific Syngas Industry Revenue billion Forecast, by Gasifier Type 2020 & 2033
- Table 54: Asia Pacific Syngas Industry Volume Million Forecast, by Gasifier Type 2020 & 2033
- Table 55: Asia Pacific Syngas Industry Revenue billion Forecast, by Application 2020 & 2033
- Table 56: Asia Pacific Syngas Industry Volume Million Forecast, by Application 2020 & 2033
- Table 57: Asia Pacific Syngas Industry Revenue billion Forecast, by Geography 2020 & 2033
- Table 58: Asia Pacific Syngas Industry Volume Million Forecast, by Geography 2020 & 2033
- Table 59: Asia Pacific Syngas Industry Revenue billion Forecast, by Country 2020 & 2033
- Table 60: Asia Pacific Syngas Industry Volume Million Forecast, by Country 2020 & 2033
- Table 61: Asia Pacific Syngas Industry Revenue billion Forecast, by Feedstock 2020 & 2033
- Table 62: Asia Pacific Syngas Industry Volume Million Forecast, by Feedstock 2020 & 2033
- Table 63: Asia Pacific Syngas Industry Revenue billion Forecast, by Technology 2020 & 2033
- Table 64: Asia Pacific Syngas Industry Volume Million Forecast, by Technology 2020 & 2033
- Table 65: Asia Pacific Syngas Industry Revenue billion Forecast, by Gasifier Type 2020 & 2033
- Table 66: Asia Pacific Syngas Industry Volume Million Forecast, by Gasifier Type 2020 & 2033
- Table 67: Asia Pacific Syngas Industry Revenue billion Forecast, by Application 2020 & 2033
- Table 68: Asia Pacific Syngas Industry Volume Million Forecast, by Application 2020 & 2033
- Table 69: Asia Pacific Syngas Industry Revenue billion Forecast, by Geography 2020 & 2033
- Table 70: Asia Pacific Syngas Industry Volume Million Forecast, by Geography 2020 & 2033
- Table 71: Asia Pacific Syngas Industry Revenue billion Forecast, by Country 2020 & 2033
- Table 72: Asia Pacific Syngas Industry Volume Million Forecast, by Country 2020 & 2033
- Table 73: Asia Pacific Syngas Industry Revenue billion Forecast, by Feedstock 2020 & 2033
- Table 74: Asia Pacific Syngas Industry Volume Million Forecast, by Feedstock 2020 & 2033
- Table 75: Asia Pacific Syngas Industry Revenue billion Forecast, by Technology 2020 & 2033
- Table 76: Asia Pacific Syngas Industry Volume Million Forecast, by Technology 2020 & 2033
- Table 77: Asia Pacific Syngas Industry Revenue billion Forecast, by Gasifier Type 2020 & 2033
- Table 78: Asia Pacific Syngas Industry Volume Million Forecast, by Gasifier Type 2020 & 2033
- Table 79: Asia Pacific Syngas Industry Revenue billion Forecast, by Application 2020 & 2033
- Table 80: Asia Pacific Syngas Industry Volume Million Forecast, by Application 2020 & 2033
- Table 81: Asia Pacific Syngas Industry Revenue billion Forecast, by Geography 2020 & 2033
- Table 82: Asia Pacific Syngas Industry Volume Million Forecast, by Geography 2020 & 2033
- Table 83: Asia Pacific Syngas Industry Revenue billion Forecast, by Country 2020 & 2033
- Table 84: Asia Pacific Syngas Industry Volume Million Forecast, by Country 2020 & 2033
Frequently Asked Questions
1. What is the projected Compound Annual Growth Rate (CAGR) of the Asia Pacific Syngas Industry?
The projected CAGR is approximately 6.4%.
2. Which companies are prominent players in the Asia Pacific Syngas Industry?
Key companies in the market include Haldor Topsoe A/S, General Electric, Air Products and Chemicals Inc, Royal Dutch Shell plc, Siemens, KBR Inc, BASF SE, Sasol, DuPont, Linde plc, SynGas Technology LLC, Air Liquide, BP p l c, TechnipFMC plc*List Not Exhaustive.
3. What are the main segments of the Asia Pacific Syngas Industry?
The market segments include Feedstock, Technology, Gasifier Type, Application, Geography.
4. Can you provide details about the market size?
The market size is estimated to be USD 44.39 billion as of 2022.
5. What are some drivers contributing to market growth?
Feedstock Flexibility for Syngas Production; Growing Demand in the Electricity and Chemical Industries; Increasing Hydrogen Demand for Fertilizers.
6. What are the notable trends driving market growth?
Ammonia Application Segment to Dominate the Market.
7. Are there any restraints impacting market growth?
High Capital Investment and Funding; Other Restraints.
8. Can you provide examples of recent developments in the market?
September 2023: BASF SE initiated the construction of its syngas plant at the Verbund site in Zhanjiang, China. Anticipated to become operational in 2025, this facility marks a strategic move by BASF SE to bolster its syngas production capacity in China.
9. What pricing options are available for accessing the report?
Pricing options include single-user, multi-user, and enterprise licenses priced at USD 4750, USD 5250, and USD 8750 respectively.
10. Is the market size provided in terms of value or volume?
The market size is provided in terms of value, measured in billion and volume, measured in Million.
11. Are there any specific market keywords associated with the report?
Yes, the market keyword associated with the report is "Asia Pacific Syngas Industry," which aids in identifying and referencing the specific market segment covered.
12. How do I determine which pricing option suits my needs best?
The pricing options vary based on user requirements and access needs. Individual users may opt for single-user licenses, while businesses requiring broader access may choose multi-user or enterprise licenses for cost-effective access to the report.
13. Are there any additional resources or data provided in the Asia Pacific Syngas Industry report?
While the report offers comprehensive insights, it's advisable to review the specific contents or supplementary materials provided to ascertain if additional resources or data are available.
14. How can I stay updated on further developments or reports in the Asia Pacific Syngas Industry?
To stay informed about further developments, trends, and reports in the Asia Pacific Syngas Industry, consider subscribing to industry newsletters, following relevant companies and organizations, or regularly checking reputable industry news sources and publications.
Methodology
Step 1 - Identification of Relevant Samples Size from Population Database


Step 2 - Approaches for Defining Global Market Size (Value, Volume* & Price*)

Note*: In applicable scenarios
Step 3 - Data Sources
Primary Research
- Web Analytics
- Survey Reports
- Research Institute
- Latest Research Reports
- Opinion Leaders
Secondary Research
- Annual Reports
- White Paper
- Latest Press Release
- Industry Association
- Paid Database
- Investor Presentations

Step 4 - Data Triangulation
Involves using different sources of information in order to increase the validity of a study
These sources are likely to be stakeholders in a program - participants, other researchers, program staff, other community members, and so on.
Then we put all data in single framework & apply various statistical tools to find out the dynamic on the market.
During the analysis stage, feedback from the stakeholder groups would be compared to determine areas of agreement as well as areas of divergence