

Key Insights
The Asia-Pacific carbon black market is projected for significant expansion, primarily fueled by the robust automotive and tire sectors across the region. An expanding middle class and rising vehicle ownership, particularly in key markets like India and China, are major growth drivers. Demand for advanced, high-performance tires, offering improved fuel efficiency and durability, is also stimulating the need for premium carbon black. The construction industry's growth further contributes, with carbon black applications in plastics and coatings. While volatile crude oil prices and environmental regulations pose challenges, ongoing technological advancements in performance and sustainability are effectively addressing these restraints. The market is segmented by product type (furnace black, channel black), application (tires, inks, plastics), and geography. Leading companies like Birla Carbon, Bridgestone Corporation, and Cabot Corporation are actively investing in R&D to refine product portfolios and meet evolving regional demands. The anticipated Compound Annual Growth Rate (CAGR) of 3.4% signals sustained market growth, offering considerable opportunities for both established and emerging players. The market size is estimated at 9.73 million for the base year 2025.
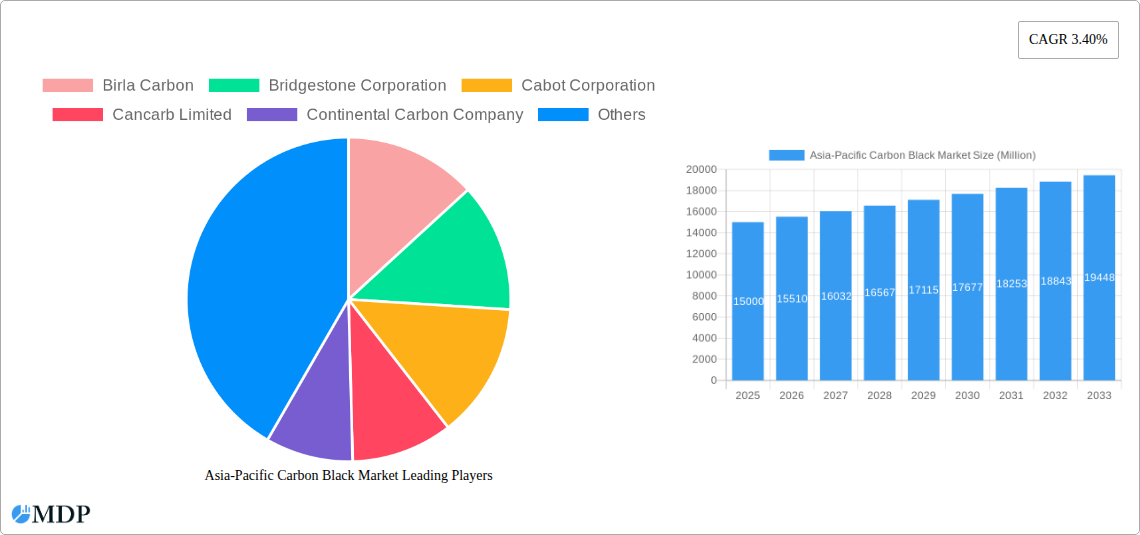
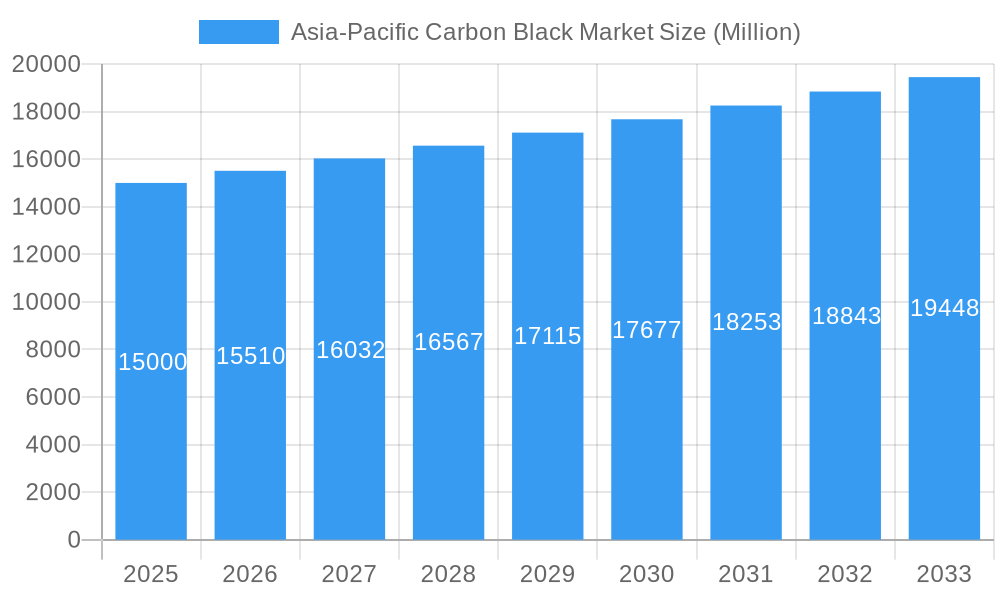
Asia-Pacific Carbon Black Market Market Size (In Million)
The competitive environment features a mix of large multinational corporations and agile regional enterprises, fostering price competitiveness and innovation. Sustainable manufacturing practices are gaining prominence, driven by increasing consumer environmental awareness and stricter governmental regulations. This pivot towards eco-friendly production methods is expected to shape future market expansion and technological advancements, encouraging the adoption of cleaner technologies and optimized processes. The Asia-Pacific region's varied economic conditions and industrial development levels present a complex landscape of opportunities and challenges, necessitating nuanced strategies for effective market targeting and sustainable growth.
Asia-Pacific Carbon Black Market Company Market Share
Asia-Pacific Carbon Black Market: A Comprehensive Report (2019-2033)
This in-depth report provides a comprehensive analysis of the Asia-Pacific carbon black market, offering valuable insights for industry stakeholders, investors, and strategic decision-makers. The study period covers 2019-2033, with a focus on 2025 as the base and estimated year. The report leverages extensive data analysis and expert insights to paint a clear picture of market dynamics, trends, and future prospects. Expect detailed breakdowns of market segments, leading players like Birla Carbon and Cabot Corporation, and crucial industry developments. Maximize your understanding of this dynamic market and gain a competitive edge.
Asia-Pacific Carbon Black Market Market Dynamics & Concentration
This section analyzes the competitive landscape of the Asia-Pacific carbon black market, examining market concentration, innovation drivers, regulatory frameworks, substitute products, end-user trends, and mergers & acquisitions (M&A) activities.
The Asia-Pacific carbon black market exhibits a moderately concentrated structure, with several key players holding significant market share. While precise figures fluctuate, the top five players likely control approximately xx% of the market in 2025. This concentration is influenced by economies of scale in production and the extensive capital investment required for new capacity.
- Market Concentration: The Herfindahl-Hirschman Index (HHI) is estimated at xx in 2025, indicating a moderately concentrated market.
- Innovation Drivers: Continuous innovation in carbon black production processes, focusing on improved quality, enhanced sustainability, and cost efficiency, drives market growth. New grades with specialized properties cater to evolving industry requirements.
- Regulatory Frameworks: Stringent environmental regulations regarding emissions and waste management influence production processes and investment decisions. Compliance costs significantly impact market dynamics.
- Product Substitutes: Limited direct substitutes exist, although alternative materials are emerging for specific applications, exerting some competitive pressure.
- End-User Trends: Increasing demand from the tire industry (passenger car and truck tires) continues to be the primary driver, complemented by growing demand from the plastics, rubber, and printing ink sectors.
- M&A Activities: The past five years have witnessed xx M&A deals in the Asia-Pacific carbon black market, primarily driven by strategic acquisitions to expand market share and production capacity.
Asia-Pacific Carbon Black Market Industry Trends & Analysis
This section delves into the key trends shaping the Asia-Pacific carbon black market, including market growth drivers, technological disruptions, consumer preferences, and competitive dynamics. The market demonstrates robust growth, with a Compound Annual Growth Rate (CAGR) projected at xx% during the forecast period (2025-2033). This growth is propelled by rising demand in key end-use sectors. Market penetration continues to increase, especially in rapidly developing economies within the region, reaching an estimated xx% in 2025.
Technological advancements in carbon black production, such as the implementation of advanced process control systems and the development of more efficient manufacturing processes, are significantly impacting the market. These innovations reduce production costs and improve product quality, ultimately driving market expansion.
Leading Markets & Segments in Asia-Pacific Carbon Black Market
This section identifies the dominant regions, countries, and segments within the Asia-Pacific carbon black market.
China and India are projected to remain the leading markets for carbon black in the Asia-Pacific region throughout the forecast period.
- China: Strong economic growth, rapid industrialization, and a large automotive sector underpin high demand for carbon black in China.
- India: Similar growth drivers to China are observable, particularly with a burgeoning middle class and rising vehicle ownership.
- Other Key Markets: Other significant markets include Japan, South Korea, and Southeast Asian nations. These markets show considerable growth potential driven by industrialization and infrastructure development.
Key Drivers for Dominance:
- Rapid Economic Growth: High GDP growth in key nations fuels industrial expansion and increased demand for carbon black across various applications.
- Infrastructure Development: Investment in infrastructure projects (roads, bridges, and buildings) drives demand for tires and other carbon black-containing products.
- Automotive Industry Expansion: The increasing number of vehicles on the road fuels strong demand for carbon black in tire manufacturing.
Asia-Pacific Carbon Black Market Product Developments
Recent years have witnessed noteworthy innovations in carbon black technology. Manufacturers are developing new grades with enhanced properties, such as improved dispersion, higher conductivity, and enhanced UV resistance, to meet the evolving needs of specific applications. This continuous improvement in product quality is crucial for maintaining competitiveness and expanding market share in the Asia-Pacific region. The focus on sustainable production processes and eco-friendly carbon black grades is also gaining traction, reflecting an increasing industry-wide emphasis on environmental responsibility.
Key Drivers of Asia-Pacific Carbon Black Market Growth
Several factors fuel the growth of the Asia-Pacific carbon black market. These include:
- Technological Advancements: Continuous innovation in production technologies leads to cost reductions and improved product quality.
- Expanding Automotive Sector: Rapid growth in vehicle ownership, especially in emerging economies, boosts demand for tires and other carbon black applications.
- Government Initiatives: Policies promoting industrial growth and infrastructure development indirectly support the carbon black market.
Challenges in the Asia-Pacific Carbon Black Market Market
The Asia-Pacific carbon black market faces several challenges:
- Environmental Regulations: Stricter emission standards and environmental regulations increase production costs and necessitate investment in cleaner technologies.
- Raw Material Prices: Fluctuations in the prices of raw materials, such as petroleum feedstock, impact production costs and profitability.
- Intense Competition: The market is characterized by intense competition among numerous players, both domestic and international.
Emerging Opportunities in Asia-Pacific Carbon Black Market
Long-term growth opportunities exist in several areas:
- Technological Breakthroughs: The development of next-generation carbon black materials with improved properties will open up new application areas.
- Strategic Partnerships: Collaborations between carbon black producers and end-users will enhance value creation and market penetration.
- Market Expansion: The expansion into new and rapidly growing markets within the Asia-Pacific region promises considerable growth potential.
Leading Players in the Asia-Pacific Carbon Black Market Sector
- Birla Carbon
- Bridgestone Corporation
- Cabot Corporation
- Cancarb Limited
- Continental Carbon Company
- Epsilon Carbon Private Limited
- Himadri Specialty Chemical Ltd
- Imerys
- Longxing Chemical Stock Co Ltd
- Mitsubishi Chemical Group Corporation
- OCI COMPANY Ltd
- Orion Engineered Carbons
- PCBL (Phillips Carbon Black Limited)
- Shandong Huadong Rubber Materials Co Ltd
- Tokai Carbon Co Ltd *List Not Exhaustive
Key Milestones in Asia-Pacific Carbon Black Market Industry
- April 2023: Phillips Carbon Black, part of the RP-Sanjiv Goenka Group, launched a new production facility in Tamil Nadu, India, with an expected annual production capacity of 147 kilotons. This expansion significantly increases domestic supply and reinforces India's position in the market.
- September 2022: Epsilon Carbon announced a INR 550 Crore (~USD 66.6 Million) investment to expand its carbon black production capacity in Vijayanagar, Karnataka, India, from 115 to 215 kilotons. This expansion highlights the increasing demand and growth prospects within the Indian carbon black market.
Strategic Outlook for Asia-Pacific Carbon Black Market Market
The Asia-Pacific carbon black market is poised for continued expansion driven by strong economic growth, infrastructure development, and increasing demand from various end-use sectors. Strategic opportunities for market players include capitalizing on technological advancements, developing sustainable products, and establishing strong partnerships with key stakeholders to maintain a competitive edge. The long-term outlook remains optimistic, reflecting significant market potential across various segments and geographical regions within the Asia-Pacific landscape.
Asia-Pacific Carbon Black Market Segmentation
-
1. Process Type
- 1.1. Furnace Black
- 1.2. Gas Black
- 1.3. Lamp Black
- 1.4. Thermal Black
-
2. Application
- 2.1. Tires and Industrial Rubber Products
- 2.2. Plastics
- 2.3. Toners and Printing Inks
- 2.4. Coatings
- 2.5. Textile Fibers
- 2.6. Other Ap
-
3. Geography
- 3.1. China
- 3.2. India
- 3.3. Japan
- 3.4. South Korea
- 3.5. ASEAN Countries
- 3.6. Rest of Asia-Pacific
Asia-Pacific Carbon Black Market Segmentation By Geography
- 1. China
- 2. India
- 3. Japan
- 4. South Korea
- 5. ASEAN Countries
- 6. Rest of Asia Pacific
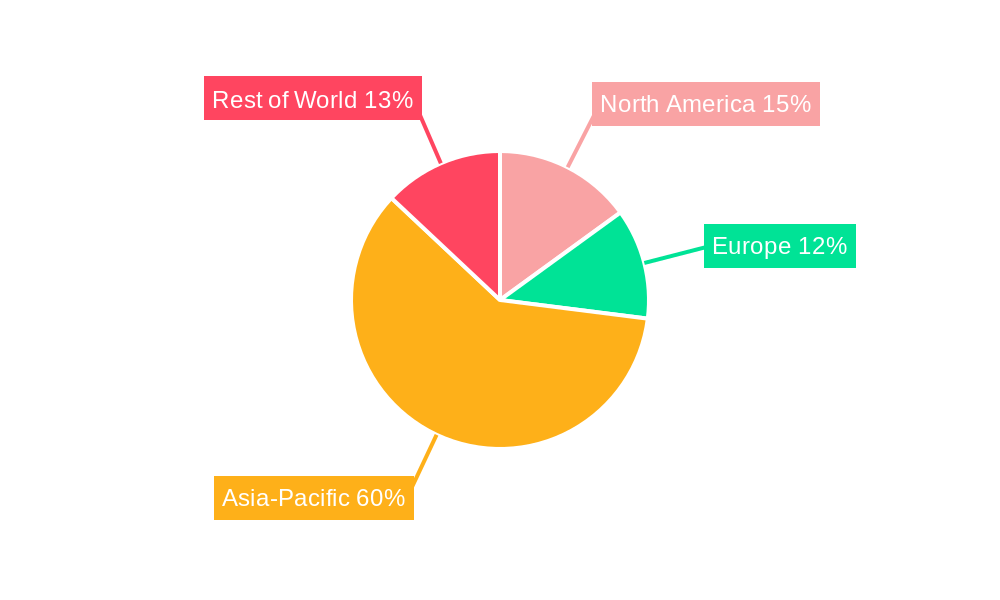
Asia-Pacific Carbon Black Market Regional Market Share
Geographic Coverage of Asia-Pacific Carbon Black Market
Asia-Pacific Carbon Black Market REPORT HIGHLIGHTS
| Aspects | Details |
|---|---|
| Study Period | 2020-2034 |
| Base Year | 2025 |
| Estimated Year | 2026 |
| Forecast Period | 2026-2034 |
| Historical Period | 2020-2025 |
| Growth Rate | CAGR of 3.4% from 2020-2034 |
| Segmentation |
|
Table of Contents
- 1. Introduction
- 1.1. Research Scope
- 1.2. Market Segmentation
- 1.3. Research Objective
- 1.4. Definitions and Assumptions
- 2. Executive Summary
- 2.1. Market Snapshot
- 3. Market Dynamics
- 3.1. Market Drivers
- 3.2. Market Restrains
- 3.3. Market Trends
- 3.4. Market Opportunities
- 4. Market Factor Analysis
- 4.1. Porters Five Forces
- 4.1.1. Bargaining Power of Suppliers
- 4.1.2. Bargaining Power of Buyers
- 4.1.3. Threat of New Entrants
- 4.1.4. Threat of Substitutes
- 4.1.5. Competitive Rivalry
- 4.2. PESTEL analysis
- 4.3. BCG Analysis
- 4.3.1. Stars (High Growth, High Market Share)
- 4.3.2. Cash Cows (Low Growth, High Market Share)
- 4.3.3. Question Mark (High Growth, Low Market Share)
- 4.3.4. Dogs (Low Growth, Low Market Share)
- 4.4. Ansoff Matrix Analysis
- 4.5. Supply Chain Analysis
- 4.6. Regulatory Landscape
- 4.7. Current Market Potential and Opportunity Assessment (TAM–SAM–SOM Framework)
- 4.8. MDP Analyst Note
- 4.1. Porters Five Forces
- 5. Market Analysis, Insights and Forecast 2021-2033
- 5.1. Market Analysis, Insights and Forecast - by Process Type
- 5.1.1. Furnace Black
- 5.1.2. Gas Black
- 5.1.3. Lamp Black
- 5.1.4. Thermal Black
- 5.2. Market Analysis, Insights and Forecast - by Application
- 5.2.1. Tires and Industrial Rubber Products
- 5.2.2. Plastics
- 5.2.3. Toners and Printing Inks
- 5.2.4. Coatings
- 5.2.5. Textile Fibers
- 5.2.6. Other Ap
- 5.3. Market Analysis, Insights and Forecast - by Geography
- 5.3.1. China
- 5.3.2. India
- 5.3.3. Japan
- 5.3.4. South Korea
- 5.3.5. ASEAN Countries
- 5.3.6. Rest of Asia-Pacific
- 5.4. Market Analysis, Insights and Forecast - by Region
- 5.4.1. China
- 5.4.2. India
- 5.4.3. Japan
- 5.4.4. South Korea
- 5.4.5. ASEAN Countries
- 5.4.6. Rest of Asia Pacific
- 5.1. Market Analysis, Insights and Forecast - by Process Type
- 6. Global Asia-Pacific Carbon Black Market Analysis, Insights and Forecast, 2021-2033
- 6.1. Market Analysis, Insights and Forecast - by Process Type
- 6.1.1. Furnace Black
- 6.1.2. Gas Black
- 6.1.3. Lamp Black
- 6.1.4. Thermal Black
- 6.2. Market Analysis, Insights and Forecast - by Application
- 6.2.1. Tires and Industrial Rubber Products
- 6.2.2. Plastics
- 6.2.3. Toners and Printing Inks
- 6.2.4. Coatings
- 6.2.5. Textile Fibers
- 6.2.6. Other Ap
- 6.3. Market Analysis, Insights and Forecast - by Geography
- 6.3.1. China
- 6.3.2. India
- 6.3.3. Japan
- 6.3.4. South Korea
- 6.3.5. ASEAN Countries
- 6.3.6. Rest of Asia-Pacific
- 6.1. Market Analysis, Insights and Forecast - by Process Type
- 7. China Asia-Pacific Carbon Black Market Analysis, Insights and Forecast, 2020-2032
- 7.1. Market Analysis, Insights and Forecast - by Process Type
- 7.1.1. Furnace Black
- 7.1.2. Gas Black
- 7.1.3. Lamp Black
- 7.1.4. Thermal Black
- 7.2. Market Analysis, Insights and Forecast - by Application
- 7.2.1. Tires and Industrial Rubber Products
- 7.2.2. Plastics
- 7.2.3. Toners and Printing Inks
- 7.2.4. Coatings
- 7.2.5. Textile Fibers
- 7.2.6. Other Ap
- 7.3. Market Analysis, Insights and Forecast - by Geography
- 7.3.1. China
- 7.3.2. India
- 7.3.3. Japan
- 7.3.4. South Korea
- 7.3.5. ASEAN Countries
- 7.3.6. Rest of Asia-Pacific
- 7.1. Market Analysis, Insights and Forecast - by Process Type
- 8. India Asia-Pacific Carbon Black Market Analysis, Insights and Forecast, 2020-2032
- 8.1. Market Analysis, Insights and Forecast - by Process Type
- 8.1.1. Furnace Black
- 8.1.2. Gas Black
- 8.1.3. Lamp Black
- 8.1.4. Thermal Black
- 8.2. Market Analysis, Insights and Forecast - by Application
- 8.2.1. Tires and Industrial Rubber Products
- 8.2.2. Plastics
- 8.2.3. Toners and Printing Inks
- 8.2.4. Coatings
- 8.2.5. Textile Fibers
- 8.2.6. Other Ap
- 8.3. Market Analysis, Insights and Forecast - by Geography
- 8.3.1. China
- 8.3.2. India
- 8.3.3. Japan
- 8.3.4. South Korea
- 8.3.5. ASEAN Countries
- 8.3.6. Rest of Asia-Pacific
- 8.1. Market Analysis, Insights and Forecast - by Process Type
- 9. Japan Asia-Pacific Carbon Black Market Analysis, Insights and Forecast, 2020-2032
- 9.1. Market Analysis, Insights and Forecast - by Process Type
- 9.1.1. Furnace Black
- 9.1.2. Gas Black
- 9.1.3. Lamp Black
- 9.1.4. Thermal Black
- 9.2. Market Analysis, Insights and Forecast - by Application
- 9.2.1. Tires and Industrial Rubber Products
- 9.2.2. Plastics
- 9.2.3. Toners and Printing Inks
- 9.2.4. Coatings
- 9.2.5. Textile Fibers
- 9.2.6. Other Ap
- 9.3. Market Analysis, Insights and Forecast - by Geography
- 9.3.1. China
- 9.3.2. India
- 9.3.3. Japan
- 9.3.4. South Korea
- 9.3.5. ASEAN Countries
- 9.3.6. Rest of Asia-Pacific
- 9.1. Market Analysis, Insights and Forecast - by Process Type
- 10. South Korea Asia-Pacific Carbon Black Market Analysis, Insights and Forecast, 2020-2032
- 10.1. Market Analysis, Insights and Forecast - by Process Type
- 10.1.1. Furnace Black
- 10.1.2. Gas Black
- 10.1.3. Lamp Black
- 10.1.4. Thermal Black
- 10.2. Market Analysis, Insights and Forecast - by Application
- 10.2.1. Tires and Industrial Rubber Products
- 10.2.2. Plastics
- 10.2.3. Toners and Printing Inks
- 10.2.4. Coatings
- 10.2.5. Textile Fibers
- 10.2.6. Other Ap
- 10.3. Market Analysis, Insights and Forecast - by Geography
- 10.3.1. China
- 10.3.2. India
- 10.3.3. Japan
- 10.3.4. South Korea
- 10.3.5. ASEAN Countries
- 10.3.6. Rest of Asia-Pacific
- 10.1. Market Analysis, Insights and Forecast - by Process Type
- 11. ASEAN Countries Asia-Pacific Carbon Black Market Analysis, Insights and Forecast, 2020-2032
- 11.1. Market Analysis, Insights and Forecast - by Process Type
- 11.1.1. Furnace Black
- 11.1.2. Gas Black
- 11.1.3. Lamp Black
- 11.1.4. Thermal Black
- 11.2. Market Analysis, Insights and Forecast - by Application
- 11.2.1. Tires and Industrial Rubber Products
- 11.2.2. Plastics
- 11.2.3. Toners and Printing Inks
- 11.2.4. Coatings
- 11.2.5. Textile Fibers
- 11.2.6. Other Ap
- 11.3. Market Analysis, Insights and Forecast - by Geography
- 11.3.1. China
- 11.3.2. India
- 11.3.3. Japan
- 11.3.4. South Korea
- 11.3.5. ASEAN Countries
- 11.3.6. Rest of Asia-Pacific
- 11.1. Market Analysis, Insights and Forecast - by Process Type
- 12. Rest of Asia Pacific Asia-Pacific Carbon Black Market Analysis, Insights and Forecast, 2020-2032
- 12.1. Market Analysis, Insights and Forecast - by Process Type
- 12.1.1. Furnace Black
- 12.1.2. Gas Black
- 12.1.3. Lamp Black
- 12.1.4. Thermal Black
- 12.2. Market Analysis, Insights and Forecast - by Application
- 12.2.1. Tires and Industrial Rubber Products
- 12.2.2. Plastics
- 12.2.3. Toners and Printing Inks
- 12.2.4. Coatings
- 12.2.5. Textile Fibers
- 12.2.6. Other Ap
- 12.3. Market Analysis, Insights and Forecast - by Geography
- 12.3.1. China
- 12.3.2. India
- 12.3.3. Japan
- 12.3.4. South Korea
- 12.3.5. ASEAN Countries
- 12.3.6. Rest of Asia-Pacific
- 12.1. Market Analysis, Insights and Forecast - by Process Type
- 13. Competitive Analysis
- 13.1. Company Profiles
- 13.1.1 Birla Carbon
- 13.1.1.1. Company Overview
- 13.1.1.2. Products
- 13.1.1.3. Company Financials
- 13.1.1.4. SWOT Analysis
- 13.1.2 Bridgestone Corporation
- 13.1.2.1. Company Overview
- 13.1.2.2. Products
- 13.1.2.3. Company Financials
- 13.1.2.4. SWOT Analysis
- 13.1.3 Cabot Corporation
- 13.1.3.1. Company Overview
- 13.1.3.2. Products
- 13.1.3.3. Company Financials
- 13.1.3.4. SWOT Analysis
- 13.1.4 Cancarb Limited
- 13.1.4.1. Company Overview
- 13.1.4.2. Products
- 13.1.4.3. Company Financials
- 13.1.4.4. SWOT Analysis
- 13.1.5 Continental Carbon Company
- 13.1.5.1. Company Overview
- 13.1.5.2. Products
- 13.1.5.3. Company Financials
- 13.1.5.4. SWOT Analysis
- 13.1.6 Epsilon Carbon Private Limited
- 13.1.6.1. Company Overview
- 13.1.6.2. Products
- 13.1.6.3. Company Financials
- 13.1.6.4. SWOT Analysis
- 13.1.7 Himadri Specialty Chemical Ltd
- 13.1.7.1. Company Overview
- 13.1.7.2. Products
- 13.1.7.3. Company Financials
- 13.1.7.4. SWOT Analysis
- 13.1.8 Imerys
- 13.1.8.1. Company Overview
- 13.1.8.2. Products
- 13.1.8.3. Company Financials
- 13.1.8.4. SWOT Analysis
- 13.1.9 Longxing Chemical Stock Co Ltd
- 13.1.9.1. Company Overview
- 13.1.9.2. Products
- 13.1.9.3. Company Financials
- 13.1.9.4. SWOT Analysis
- 13.1.10 Mitsubishi Chemical Group Corporation
- 13.1.10.1. Company Overview
- 13.1.10.2. Products
- 13.1.10.3. Company Financials
- 13.1.10.4. SWOT Analysis
- 13.1.11 OCI COMPANY Ltd
- 13.1.11.1. Company Overview
- 13.1.11.2. Products
- 13.1.11.3. Company Financials
- 13.1.11.4. SWOT Analysis
- 13.1.12 Orion Engineered Carbons
- 13.1.12.1. Company Overview
- 13.1.12.2. Products
- 13.1.12.3. Company Financials
- 13.1.12.4. SWOT Analysis
- 13.1.13 PCBL (Phillips Carbon Black Limited)
- 13.1.13.1. Company Overview
- 13.1.13.2. Products
- 13.1.13.3. Company Financials
- 13.1.13.4. SWOT Analysis
- 13.1.14 Shandong Huadong Rubber Materials Co Ltd
- 13.1.14.1. Company Overview
- 13.1.14.2. Products
- 13.1.14.3. Company Financials
- 13.1.14.4. SWOT Analysis
- 13.1.15 Tokai Carbon Co Ltd*List Not Exhaustive
- 13.1.15.1. Company Overview
- 13.1.15.2. Products
- 13.1.15.3. Company Financials
- 13.1.15.4. SWOT Analysis
- 13.1.1 Birla Carbon
- 13.2. Market Entropy
- 13.2.1 Company's Key Areas Served
- 13.2.2 Recent Developments
- 13.3. Company Market Share Analysis 2025
- 13.3.1 Top 5 Companies Market Share Analysis
- 13.3.2 Top 3 Companies Market Share Analysis
- 13.4. List of Potential Customers
- 14. Research Methodology
List of Figures
- Figure 1: Global Asia-Pacific Carbon Black Market Revenue Breakdown (million, %) by Region 2025 & 2033
- Figure 2: China Asia-Pacific Carbon Black Market Revenue (million), by Process Type 2025 & 2033
- Figure 3: China Asia-Pacific Carbon Black Market Revenue Share (%), by Process Type 2025 & 2033
- Figure 4: China Asia-Pacific Carbon Black Market Revenue (million), by Application 2025 & 2033
- Figure 5: China Asia-Pacific Carbon Black Market Revenue Share (%), by Application 2025 & 2033
- Figure 6: China Asia-Pacific Carbon Black Market Revenue (million), by Geography 2025 & 2033
- Figure 7: China Asia-Pacific Carbon Black Market Revenue Share (%), by Geography 2025 & 2033
- Figure 8: China Asia-Pacific Carbon Black Market Revenue (million), by Country 2025 & 2033
- Figure 9: China Asia-Pacific Carbon Black Market Revenue Share (%), by Country 2025 & 2033
- Figure 10: India Asia-Pacific Carbon Black Market Revenue (million), by Process Type 2025 & 2033
- Figure 11: India Asia-Pacific Carbon Black Market Revenue Share (%), by Process Type 2025 & 2033
- Figure 12: India Asia-Pacific Carbon Black Market Revenue (million), by Application 2025 & 2033
- Figure 13: India Asia-Pacific Carbon Black Market Revenue Share (%), by Application 2025 & 2033
- Figure 14: India Asia-Pacific Carbon Black Market Revenue (million), by Geography 2025 & 2033
- Figure 15: India Asia-Pacific Carbon Black Market Revenue Share (%), by Geography 2025 & 2033
- Figure 16: India Asia-Pacific Carbon Black Market Revenue (million), by Country 2025 & 2033
- Figure 17: India Asia-Pacific Carbon Black Market Revenue Share (%), by Country 2025 & 2033
- Figure 18: Japan Asia-Pacific Carbon Black Market Revenue (million), by Process Type 2025 & 2033
- Figure 19: Japan Asia-Pacific Carbon Black Market Revenue Share (%), by Process Type 2025 & 2033
- Figure 20: Japan Asia-Pacific Carbon Black Market Revenue (million), by Application 2025 & 2033
- Figure 21: Japan Asia-Pacific Carbon Black Market Revenue Share (%), by Application 2025 & 2033
- Figure 22: Japan Asia-Pacific Carbon Black Market Revenue (million), by Geography 2025 & 2033
- Figure 23: Japan Asia-Pacific Carbon Black Market Revenue Share (%), by Geography 2025 & 2033
- Figure 24: Japan Asia-Pacific Carbon Black Market Revenue (million), by Country 2025 & 2033
- Figure 25: Japan Asia-Pacific Carbon Black Market Revenue Share (%), by Country 2025 & 2033
- Figure 26: South Korea Asia-Pacific Carbon Black Market Revenue (million), by Process Type 2025 & 2033
- Figure 27: South Korea Asia-Pacific Carbon Black Market Revenue Share (%), by Process Type 2025 & 2033
- Figure 28: South Korea Asia-Pacific Carbon Black Market Revenue (million), by Application 2025 & 2033
- Figure 29: South Korea Asia-Pacific Carbon Black Market Revenue Share (%), by Application 2025 & 2033
- Figure 30: South Korea Asia-Pacific Carbon Black Market Revenue (million), by Geography 2025 & 2033
- Figure 31: South Korea Asia-Pacific Carbon Black Market Revenue Share (%), by Geography 2025 & 2033
- Figure 32: South Korea Asia-Pacific Carbon Black Market Revenue (million), by Country 2025 & 2033
- Figure 33: South Korea Asia-Pacific Carbon Black Market Revenue Share (%), by Country 2025 & 2033
- Figure 34: ASEAN Countries Asia-Pacific Carbon Black Market Revenue (million), by Process Type 2025 & 2033
- Figure 35: ASEAN Countries Asia-Pacific Carbon Black Market Revenue Share (%), by Process Type 2025 & 2033
- Figure 36: ASEAN Countries Asia-Pacific Carbon Black Market Revenue (million), by Application 2025 & 2033
- Figure 37: ASEAN Countries Asia-Pacific Carbon Black Market Revenue Share (%), by Application 2025 & 2033
- Figure 38: ASEAN Countries Asia-Pacific Carbon Black Market Revenue (million), by Geography 2025 & 2033
- Figure 39: ASEAN Countries Asia-Pacific Carbon Black Market Revenue Share (%), by Geography 2025 & 2033
- Figure 40: ASEAN Countries Asia-Pacific Carbon Black Market Revenue (million), by Country 2025 & 2033
- Figure 41: ASEAN Countries Asia-Pacific Carbon Black Market Revenue Share (%), by Country 2025 & 2033
- Figure 42: Rest of Asia Pacific Asia-Pacific Carbon Black Market Revenue (million), by Process Type 2025 & 2033
- Figure 43: Rest of Asia Pacific Asia-Pacific Carbon Black Market Revenue Share (%), by Process Type 2025 & 2033
- Figure 44: Rest of Asia Pacific Asia-Pacific Carbon Black Market Revenue (million), by Application 2025 & 2033
- Figure 45: Rest of Asia Pacific Asia-Pacific Carbon Black Market Revenue Share (%), by Application 2025 & 2033
- Figure 46: Rest of Asia Pacific Asia-Pacific Carbon Black Market Revenue (million), by Geography 2025 & 2033
- Figure 47: Rest of Asia Pacific Asia-Pacific Carbon Black Market Revenue Share (%), by Geography 2025 & 2033
- Figure 48: Rest of Asia Pacific Asia-Pacific Carbon Black Market Revenue (million), by Country 2025 & 2033
- Figure 49: Rest of Asia Pacific Asia-Pacific Carbon Black Market Revenue Share (%), by Country 2025 & 2033
List of Tables
- Table 1: Global Asia-Pacific Carbon Black Market Revenue million Forecast, by Process Type 2020 & 2033
- Table 2: Global Asia-Pacific Carbon Black Market Revenue million Forecast, by Application 2020 & 2033
- Table 3: Global Asia-Pacific Carbon Black Market Revenue million Forecast, by Geography 2020 & 2033
- Table 4: Global Asia-Pacific Carbon Black Market Revenue million Forecast, by Region 2020 & 2033
- Table 5: Global Asia-Pacific Carbon Black Market Revenue million Forecast, by Process Type 2020 & 2033
- Table 6: Global Asia-Pacific Carbon Black Market Revenue million Forecast, by Application 2020 & 2033
- Table 7: Global Asia-Pacific Carbon Black Market Revenue million Forecast, by Geography 2020 & 2033
- Table 8: Global Asia-Pacific Carbon Black Market Revenue million Forecast, by Country 2020 & 2033
- Table 9: Global Asia-Pacific Carbon Black Market Revenue million Forecast, by Process Type 2020 & 2033
- Table 10: Global Asia-Pacific Carbon Black Market Revenue million Forecast, by Application 2020 & 2033
- Table 11: Global Asia-Pacific Carbon Black Market Revenue million Forecast, by Geography 2020 & 2033
- Table 12: Global Asia-Pacific Carbon Black Market Revenue million Forecast, by Country 2020 & 2033
- Table 13: Global Asia-Pacific Carbon Black Market Revenue million Forecast, by Process Type 2020 & 2033
- Table 14: Global Asia-Pacific Carbon Black Market Revenue million Forecast, by Application 2020 & 2033
- Table 15: Global Asia-Pacific Carbon Black Market Revenue million Forecast, by Geography 2020 & 2033
- Table 16: Global Asia-Pacific Carbon Black Market Revenue million Forecast, by Country 2020 & 2033
- Table 17: Global Asia-Pacific Carbon Black Market Revenue million Forecast, by Process Type 2020 & 2033
- Table 18: Global Asia-Pacific Carbon Black Market Revenue million Forecast, by Application 2020 & 2033
- Table 19: Global Asia-Pacific Carbon Black Market Revenue million Forecast, by Geography 2020 & 2033
- Table 20: Global Asia-Pacific Carbon Black Market Revenue million Forecast, by Country 2020 & 2033
- Table 21: Global Asia-Pacific Carbon Black Market Revenue million Forecast, by Process Type 2020 & 2033
- Table 22: Global Asia-Pacific Carbon Black Market Revenue million Forecast, by Application 2020 & 2033
- Table 23: Global Asia-Pacific Carbon Black Market Revenue million Forecast, by Geography 2020 & 2033
- Table 24: Global Asia-Pacific Carbon Black Market Revenue million Forecast, by Country 2020 & 2033
- Table 25: Global Asia-Pacific Carbon Black Market Revenue million Forecast, by Process Type 2020 & 2033
- Table 26: Global Asia-Pacific Carbon Black Market Revenue million Forecast, by Application 2020 & 2033
- Table 27: Global Asia-Pacific Carbon Black Market Revenue million Forecast, by Geography 2020 & 2033
- Table 28: Global Asia-Pacific Carbon Black Market Revenue million Forecast, by Country 2020 & 2033
Frequently Asked Questions
1. What is the projected Compound Annual Growth Rate (CAGR) of the Asia-Pacific Carbon Black Market?
The projected CAGR is approximately 3.4%.
2. Which companies are prominent players in the Asia-Pacific Carbon Black Market?
Key companies in the market include Birla Carbon, Bridgestone Corporation, Cabot Corporation, Cancarb Limited, Continental Carbon Company, Epsilon Carbon Private Limited, Himadri Specialty Chemical Ltd, Imerys, Longxing Chemical Stock Co Ltd, Mitsubishi Chemical Group Corporation, OCI COMPANY Ltd, Orion Engineered Carbons, PCBL (Phillips Carbon Black Limited), Shandong Huadong Rubber Materials Co Ltd, Tokai Carbon Co Ltd*List Not Exhaustive.
3. What are the main segments of the Asia-Pacific Carbon Black Market?
The market segments include Process Type, Application, Geography.
4. Can you provide details about the market size?
The market size is estimated to be USD 9.73 million as of 2022.
5. What are some drivers contributing to market growth?
Growing Application in Fiber and Textile Industries; Increasing Market Penetration of Specialty Black; Surge in Demand from Tire Industry.
6. What are the notable trends driving market growth?
Increasing Demand for Tires and Industrial Rubber Products.
7. Are there any restraints impacting market growth?
Growing Application in Fiber and Textile Industries; Increasing Market Penetration of Specialty Black; Surge in Demand from Tire Industry.
8. Can you provide examples of recent developments in the market?
April 2023: Phillips Carbon Black - a part of RP-Sanjiv Goenka Group, opened a new production facility in Tamil Nadu, India, to start the commercial production of carbon black. The company is expected to reach a production level of 147 kilotons annually in 2023.
9. What pricing options are available for accessing the report?
Pricing options include single-user, multi-user, and enterprise licenses priced at USD 4750, USD 5250, and USD 8750 respectively.
10. Is the market size provided in terms of value or volume?
The market size is provided in terms of value, measured in million.
11. Are there any specific market keywords associated with the report?
Yes, the market keyword associated with the report is "Asia-Pacific Carbon Black Market," which aids in identifying and referencing the specific market segment covered.
12. How do I determine which pricing option suits my needs best?
The pricing options vary based on user requirements and access needs. Individual users may opt for single-user licenses, while businesses requiring broader access may choose multi-user or enterprise licenses for cost-effective access to the report.
13. Are there any additional resources or data provided in the Asia-Pacific Carbon Black Market report?
While the report offers comprehensive insights, it's advisable to review the specific contents or supplementary materials provided to ascertain if additional resources or data are available.
14. How can I stay updated on further developments or reports in the Asia-Pacific Carbon Black Market?
To stay informed about further developments, trends, and reports in the Asia-Pacific Carbon Black Market, consider subscribing to industry newsletters, following relevant companies and organizations, or regularly checking reputable industry news sources and publications.
Methodology
Step 1 - Identification of Relevant Samples Size from Population Database


Step 2 - Approaches for Defining Global Market Size (Value, Volume* & Price*)

Note*: In applicable scenarios
Step 3 - Data Sources
Primary Research
- Web Analytics
- Survey Reports
- Research Institute
- Latest Research Reports
- Opinion Leaders
Secondary Research
- Annual Reports
- White Paper
- Latest Press Release
- Industry Association
- Paid Database
- Investor Presentations

Step 4 - Data Triangulation
Involves using different sources of information in order to increase the validity of a study
These sources are likely to be stakeholders in a program - participants, other researchers, program staff, other community members, and so on.
Then we put all data in single framework & apply various statistical tools to find out the dynamic on the market.
During the analysis stage, feedback from the stakeholder groups would be compared to determine areas of agreement as well as areas of divergence