

Key Insights
The Asia-Pacific (APAC) fuel additive market is poised for substantial expansion, propelled by increasing vehicle proliferation, stringent environmental mandates, and a growing imperative for enhanced fuel economy. The market is projected to achieve a Compound Annual Growth Rate (CAGR) of 4.5%, reaching an estimated market size of 768 million by the base year of 2025. Key product categories, such as deposit control, cetane enhancers, and lubricity additives, are witnessing accelerated demand due to the integration of advanced fuel technologies and the necessity to counteract biofuel-related impacts. The dynamic automotive sector across major economies like China, India, and South Korea is a primary driver of this growth. Concurrently, the implementation of rigorous emission standards throughout the region is compelling fuel additive manufacturers to prioritize innovation and the development of superior, eco-conscious solutions. Despite potential headwinds from volatile crude oil prices and economic uncertainties, the APAC fuel additive market exhibits a promising long-term outlook.
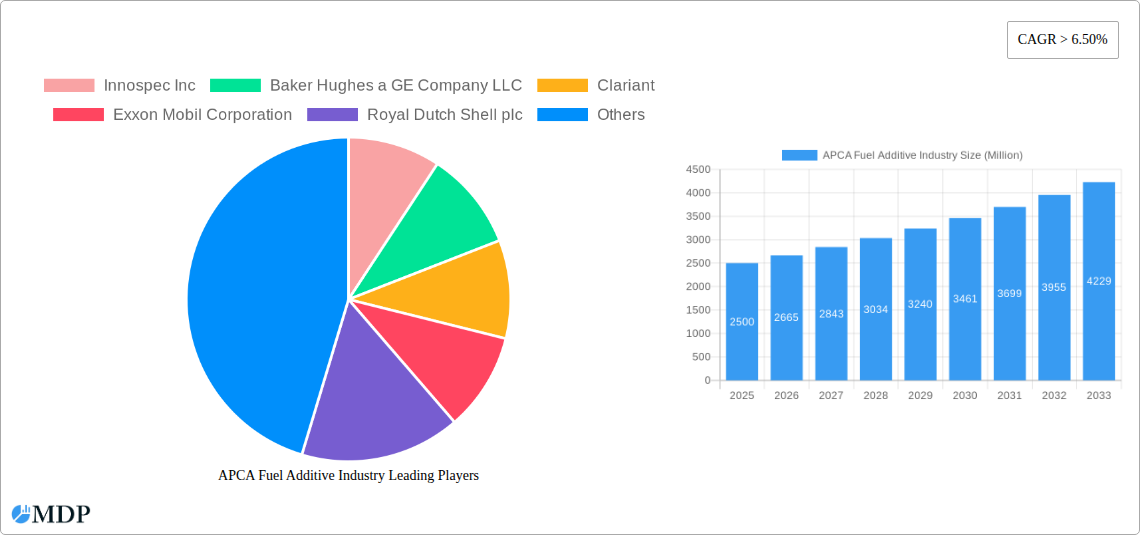
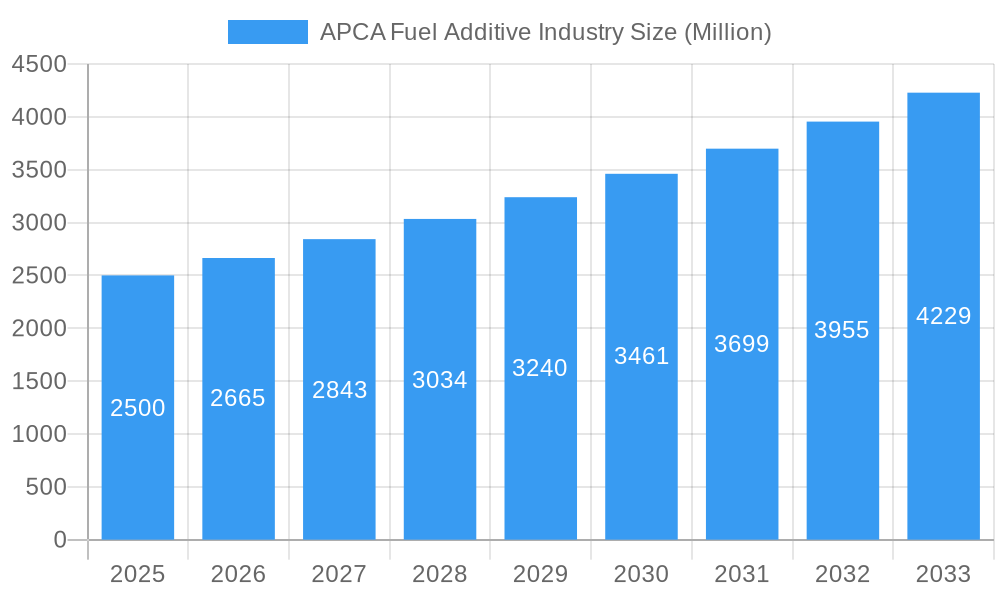
APCA Fuel Additive Industry Market Size (In Million)
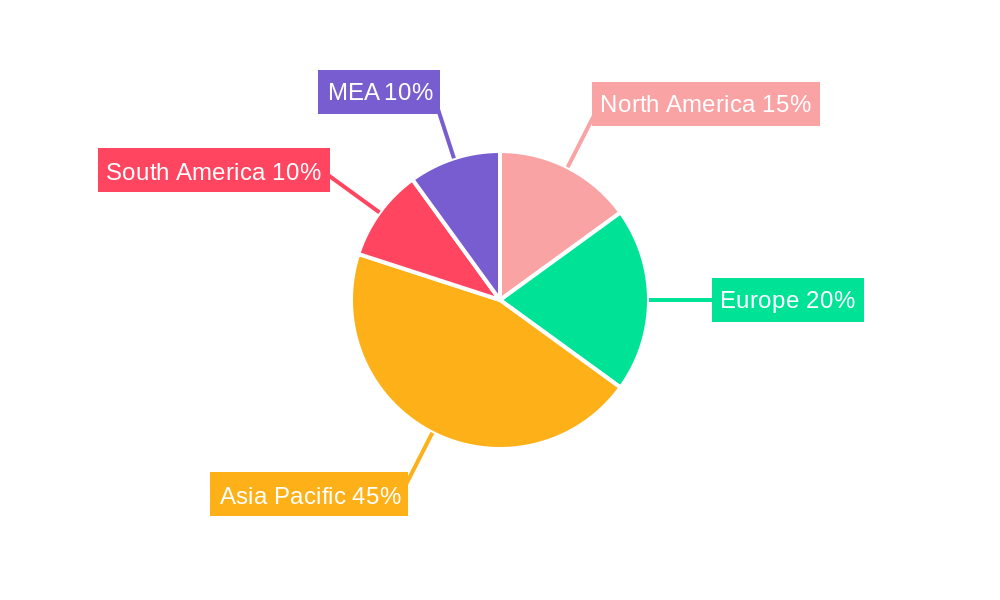
Significant regional disparities characterize the APAC landscape. China and India, owing to their vast automotive industries and accelerated industrialization, are anticipated to hold dominant market shares. Meanwhile, other Southeast Asian economies are demonstrating considerable growth, fueled by expanding middle-class populations and rising disposable incomes, which in turn stimulate higher vehicle acquisition rates. The market is intensely competitive, with global leaders such as ExxonMobil and BASF, alongside prominent regional entities, actively competing for market dominance. This competitive environment stimulates continuous innovation and the creation of specialized fuel additives meticulously designed for diverse fuel types and engine specifications. This dynamic market structure, combined with ongoing technological advancements, indicates sustained robust growth and presents significant opportunities for both established and emerging participants within the APAC region.
APCA Fuel Additive Industry Company Market Share
APCA Fuel Additive Industry: A Comprehensive Market Report (2019-2033)
This comprehensive report provides an in-depth analysis of the APCA Fuel Additive industry, offering invaluable insights for stakeholders, investors, and industry professionals. With a study period spanning 2019-2033, a base year of 2025, and a forecast period of 2025-2033, this report delivers a robust understanding of current market dynamics and future growth projections. The report leverages extensive data analysis to illuminate key trends, challenges, and opportunities within this dynamic sector. The total market size is estimated at XX Million in 2025 and is projected to reach XX Million by 2033. This report covers major players like Innospec Inc, Baker Hughes, Clariant, ExxonMobil, Shell, Evonik, LANXESS, Croda, BASF, Chevron, Lubrizol, Dorfketal, Eni, Total, and Afton Chemical, providing a holistic view of the competitive landscape.
APCA Fuel Additive Industry Market Dynamics & Concentration
The APCA fuel additive market is characterized by a moderately concentrated landscape, with several multinational corporations holding significant market share. In 2025, the top five players are estimated to control approximately xx% of the global market. Market concentration is influenced by factors such as economies of scale in production, R&D capabilities, and established distribution networks. Innovation is a key driver, with companies continuously developing advanced additives to meet evolving emission standards and fuel efficiency demands. Stringent regulatory frameworks, particularly concerning environmental regulations, play a crucial role in shaping product development and market growth. The industry witnesses continuous M&A activity, with xx major deals recorded between 2019 and 2024, driven by the need for enhanced technological capabilities and market expansion. Product substitution is a moderate factor; however, the shift towards cleaner fuels necessitates continuous innovation to maintain market competitiveness. End-user trends, such as the increasing adoption of advanced engine technologies and the preference for higher-quality fuels, impact demand for specialized APCA fuel additives.
- Market Share (2025 Estimate): Top 5 players: xx%
- M&A Deal Count (2019-2024): xx
- Key Innovation Drivers: Stringent emission regulations, fuel efficiency demands, and technological advancements in engine technology.
- Major Regulatory Frameworks: [Specify relevant regulations, e.g., EPA regulations in the US, EU regulations in Europe]
APCA Fuel Additive Industry Industry Trends & Analysis
The APCA fuel additive market is projected to witness a CAGR of xx% during the forecast period (2025-2033). This growth is primarily fueled by the rising global demand for transportation fuels, particularly in developing economies. Technological disruptions, such as the shift towards advanced biofuels and the increasing adoption of electric vehicles, present both challenges and opportunities. Consumer preferences are trending towards higher-quality, cleaner fuels, stimulating demand for additives that enhance fuel performance and reduce emissions. The competitive landscape is intensely dynamic, with companies focusing on strategic partnerships, technological innovation, and cost optimization strategies. Market penetration of advanced additives, such as those designed for specific engine types or fuel blends, is steadily increasing, driving market segmentation and specialized product development. The increasing adoption of stringent emission standards in various regions is another significant factor driving growth in the market for advanced fuel additives.
Leading Markets & Segments in APCA Fuel Additive Industry
The Diesel segment dominates the APCA fuel additive application market, driven by the widespread use of diesel engines in commercial vehicles and heavy machinery. Within product types, Deposit Control additives hold the largest market share due to their critical role in maintaining engine cleanliness and performance.
Dominant Region: [Specify region, e.g., North America/Asia Pacific]
Key Drivers for Diesel Segment: High penetration of diesel vehicles globally, particularly in commercial transportation.
Key Drivers for Deposit Control Additives: Stringent emission norms and demand for enhanced engine life.
Other Significant Segments: Gasoline (driven by rising car ownership), Jet Fuel (due to aviation industry growth), specific geographic regions (based on economic growth and fuel consumption patterns).
Bullet points on Key Drivers for dominant region/segment:
- Rapid industrialization and urbanization in developing economies.
- Stringent environmental regulations driving adoption of cleaner fuels and additives.
- Expansion of transportation networks and infrastructure.
APCA Fuel Additive Industry Product Developments
Recent product innovations focus on developing additives with enhanced performance characteristics, such as improved fuel efficiency, reduced emissions, and enhanced engine protection. The market is witnessing increased focus on bio-based additives and sustainable solutions. Companies are leveraging advanced materials science and nanotechnology to develop more efficient and eco-friendly additives. The competitive landscape is driving the introduction of differentiated products with improved performance and cost-effectiveness. The emphasis is on tailor-made solutions for specific fuel types and engine technologies to address unique performance requirements and environmental regulations.
Key Drivers of APCA Fuel Additive Industry Growth
The growth of the APCA fuel additive industry is driven by several factors including the rising global demand for transportation fuels, stricter emission regulations globally, the need to improve fuel efficiency, and advancements in engine technology. Technological advancements such as the development of new and improved additives with enhanced performance characteristics are fueling growth in this market. Favorable economic conditions, particularly in emerging economies, contribute significantly to the increased consumption of fuels and hence the demand for additives.
Challenges in the APCA Fuel Additive Industry Market
The APCA fuel additive industry faces challenges such as stringent environmental regulations, fluctuations in raw material prices, and intense competition among established players. The increasing adoption of electric vehicles and biofuels poses a long-term threat to the market. Supply chain disruptions can significantly impact the availability and cost of raw materials, affecting profitability. The industry is characterized by high R&D costs, requiring continuous investments to maintain competitiveness.
Emerging Opportunities in APCA Fuel Additive Industry
Emerging opportunities include the growing demand for sustainable and bio-based additives, the development of additives for advanced engine technologies, and market expansion into developing countries. Strategic partnerships and collaborations between additive manufacturers and fuel producers will play a key role in driving innovation and market growth. The focus on advanced fuel blends and the development of fuel additives compatible with these blends will generate additional growth opportunities.
Leading Players in the APCA Fuel Additive Industry Sector
- Innospec Inc
- Baker Hughes a GE Company LLC
- Clariant
- Exxon Mobil Corporation
- Royal Dutch Shell plc
- Evonik Industries AG
- LANXESS
- Croda International Plc
- BASF SE
- Chevron Corporation
- The Lubrizol Corporation
- Dorfketal Chemicals (I) Pvt Ltd
- Eni SpA
- Total
- Afton Chemical
Key Milestones in APCA Fuel Additive Industry Industry
- [Year/Month]: [Milestone description, e.g., Launch of a new, high-performance deposit control additive by Innospec Inc.]
- [Year/Month]: [Milestone description, e.g., Merger between two key players in the cetane improver segment]
- [Year/Month]: [Milestone description, e.g., Introduction of new environmental regulations impacting additive formulations]
- [Year/Month]: [Milestone description, e.g., Significant investment in R&D by a major player, resulting in a new generation of fuel additives]
Strategic Outlook for APCA Fuel Additive Market
The future of the APCA fuel additive market is promising, with significant growth potential driven by factors such as increasing fuel consumption, stricter emission regulations, and the development of advanced engine technologies. Companies must focus on innovation, sustainability, and strategic partnerships to capitalize on this growth. The development of bio-based additives and the implementation of circular economy principles will be crucial for long-term success. The emphasis on customized solutions for different fuel types and market segments will also drive growth in the coming years.
APCA Fuel Additive Industry Segmentation
-
1. Product Type
- 1.1. Deposit Control
- 1.2. Cetane Improvers
- 1.3. Lubricity Additives
- 1.4. Antioxidants
- 1.5. Anticorrosion
- 1.6. Cold Flow Improvers
- 1.7. Antiknock Agents
- 1.8. Other Product Types
-
2. Application
- 2.1. Diesel
- 2.2. Gasoline
- 2.3. Jet Fuel
- 2.4. Other Applications
-
3. Geography
- 3.1. China
- 3.2. India
- 3.3. Japan
- 3.4. South Korea
- 3.5. Rest of Asia-Pacific
APCA Fuel Additive Industry Segmentation By Geography
- 1. China
- 2. India
- 3. Japan
- 4. South Korea
- 5. Rest of Asia Pacific
APCA Fuel Additive Industry Regional Market Share
Geographic Coverage of APCA Fuel Additive Industry
APCA Fuel Additive Industry REPORT HIGHLIGHTS
| Aspects | Details |
|---|---|
| Study Period | 2020-2034 |
| Base Year | 2025 |
| Estimated Year | 2026 |
| Forecast Period | 2026-2034 |
| Historical Period | 2020-2025 |
| Growth Rate | CAGR of 4.5% from 2020-2034 |
| Segmentation |
|
Table of Contents
- 1. Introduction
- 1.1. Research Scope
- 1.2. Market Segmentation
- 1.3. Research Objective
- 1.4. Definitions and Assumptions
- 2. Executive Summary
- 2.1. Market Snapshot
- 3. Market Dynamics
- 3.1. Market Drivers
- 3.2. Market Restrains
- 3.3. Market Trends
- 3.4. Market Opportunities
- 4. Market Factor Analysis
- 4.1. Porters Five Forces
- 4.1.1. Bargaining Power of Suppliers
- 4.1.2. Bargaining Power of Buyers
- 4.1.3. Threat of New Entrants
- 4.1.4. Threat of Substitutes
- 4.1.5. Competitive Rivalry
- 4.2. PESTEL analysis
- 4.3. BCG Analysis
- 4.3.1. Stars (High Growth, High Market Share)
- 4.3.2. Cash Cows (Low Growth, High Market Share)
- 4.3.3. Question Mark (High Growth, Low Market Share)
- 4.3.4. Dogs (Low Growth, Low Market Share)
- 4.4. Ansoff Matrix Analysis
- 4.5. Supply Chain Analysis
- 4.6. Regulatory Landscape
- 4.7. Current Market Potential and Opportunity Assessment (TAM–SAM–SOM Framework)
- 4.8. MDP Analyst Note
- 4.1. Porters Five Forces
- 5. Market Analysis, Insights and Forecast 2021-2033
- 5.1. Market Analysis, Insights and Forecast - by Product Type
- 5.1.1. Deposit Control
- 5.1.2. Cetane Improvers
- 5.1.3. Lubricity Additives
- 5.1.4. Antioxidants
- 5.1.5. Anticorrosion
- 5.1.6. Cold Flow Improvers
- 5.1.7. Antiknock Agents
- 5.1.8. Other Product Types
- 5.2. Market Analysis, Insights and Forecast - by Application
- 5.2.1. Diesel
- 5.2.2. Gasoline
- 5.2.3. Jet Fuel
- 5.2.4. Other Applications
- 5.3. Market Analysis, Insights and Forecast - by Geography
- 5.3.1. China
- 5.3.2. India
- 5.3.3. Japan
- 5.3.4. South Korea
- 5.3.5. Rest of Asia-Pacific
- 5.4. Market Analysis, Insights and Forecast - by Region
- 5.4.1. China
- 5.4.2. India
- 5.4.3. Japan
- 5.4.4. South Korea
- 5.4.5. Rest of Asia Pacific
- 5.1. Market Analysis, Insights and Forecast - by Product Type
- 6. Global APCA Fuel Additive Industry Analysis, Insights and Forecast, 2021-2033
- 6.1. Market Analysis, Insights and Forecast - by Product Type
- 6.1.1. Deposit Control
- 6.1.2. Cetane Improvers
- 6.1.3. Lubricity Additives
- 6.1.4. Antioxidants
- 6.1.5. Anticorrosion
- 6.1.6. Cold Flow Improvers
- 6.1.7. Antiknock Agents
- 6.1.8. Other Product Types
- 6.2. Market Analysis, Insights and Forecast - by Application
- 6.2.1. Diesel
- 6.2.2. Gasoline
- 6.2.3. Jet Fuel
- 6.2.4. Other Applications
- 6.3. Market Analysis, Insights and Forecast - by Geography
- 6.3.1. China
- 6.3.2. India
- 6.3.3. Japan
- 6.3.4. South Korea
- 6.3.5. Rest of Asia-Pacific
- 6.1. Market Analysis, Insights and Forecast - by Product Type
- 7. China APCA Fuel Additive Industry Analysis, Insights and Forecast, 2020-2032
- 7.1. Market Analysis, Insights and Forecast - by Product Type
- 7.1.1. Deposit Control
- 7.1.2. Cetane Improvers
- 7.1.3. Lubricity Additives
- 7.1.4. Antioxidants
- 7.1.5. Anticorrosion
- 7.1.6. Cold Flow Improvers
- 7.1.7. Antiknock Agents
- 7.1.8. Other Product Types
- 7.2. Market Analysis, Insights and Forecast - by Application
- 7.2.1. Diesel
- 7.2.2. Gasoline
- 7.2.3. Jet Fuel
- 7.2.4. Other Applications
- 7.3. Market Analysis, Insights and Forecast - by Geography
- 7.3.1. China
- 7.3.2. India
- 7.3.3. Japan
- 7.3.4. South Korea
- 7.3.5. Rest of Asia-Pacific
- 7.1. Market Analysis, Insights and Forecast - by Product Type
- 8. India APCA Fuel Additive Industry Analysis, Insights and Forecast, 2020-2032
- 8.1. Market Analysis, Insights and Forecast - by Product Type
- 8.1.1. Deposit Control
- 8.1.2. Cetane Improvers
- 8.1.3. Lubricity Additives
- 8.1.4. Antioxidants
- 8.1.5. Anticorrosion
- 8.1.6. Cold Flow Improvers
- 8.1.7. Antiknock Agents
- 8.1.8. Other Product Types
- 8.2. Market Analysis, Insights and Forecast - by Application
- 8.2.1. Diesel
- 8.2.2. Gasoline
- 8.2.3. Jet Fuel
- 8.2.4. Other Applications
- 8.3. Market Analysis, Insights and Forecast - by Geography
- 8.3.1. China
- 8.3.2. India
- 8.3.3. Japan
- 8.3.4. South Korea
- 8.3.5. Rest of Asia-Pacific
- 8.1. Market Analysis, Insights and Forecast - by Product Type
- 9. Japan APCA Fuel Additive Industry Analysis, Insights and Forecast, 2020-2032
- 9.1. Market Analysis, Insights and Forecast - by Product Type
- 9.1.1. Deposit Control
- 9.1.2. Cetane Improvers
- 9.1.3. Lubricity Additives
- 9.1.4. Antioxidants
- 9.1.5. Anticorrosion
- 9.1.6. Cold Flow Improvers
- 9.1.7. Antiknock Agents
- 9.1.8. Other Product Types
- 9.2. Market Analysis, Insights and Forecast - by Application
- 9.2.1. Diesel
- 9.2.2. Gasoline
- 9.2.3. Jet Fuel
- 9.2.4. Other Applications
- 9.3. Market Analysis, Insights and Forecast - by Geography
- 9.3.1. China
- 9.3.2. India
- 9.3.3. Japan
- 9.3.4. South Korea
- 9.3.5. Rest of Asia-Pacific
- 9.1. Market Analysis, Insights and Forecast - by Product Type
- 10. South Korea APCA Fuel Additive Industry Analysis, Insights and Forecast, 2020-2032
- 10.1. Market Analysis, Insights and Forecast - by Product Type
- 10.1.1. Deposit Control
- 10.1.2. Cetane Improvers
- 10.1.3. Lubricity Additives
- 10.1.4. Antioxidants
- 10.1.5. Anticorrosion
- 10.1.6. Cold Flow Improvers
- 10.1.7. Antiknock Agents
- 10.1.8. Other Product Types
- 10.2. Market Analysis, Insights and Forecast - by Application
- 10.2.1. Diesel
- 10.2.2. Gasoline
- 10.2.3. Jet Fuel
- 10.2.4. Other Applications
- 10.3. Market Analysis, Insights and Forecast - by Geography
- 10.3.1. China
- 10.3.2. India
- 10.3.3. Japan
- 10.3.4. South Korea
- 10.3.5. Rest of Asia-Pacific
- 10.1. Market Analysis, Insights and Forecast - by Product Type
- 11. Rest of Asia Pacific APCA Fuel Additive Industry Analysis, Insights and Forecast, 2020-2032
- 11.1. Market Analysis, Insights and Forecast - by Product Type
- 11.1.1. Deposit Control
- 11.1.2. Cetane Improvers
- 11.1.3. Lubricity Additives
- 11.1.4. Antioxidants
- 11.1.5. Anticorrosion
- 11.1.6. Cold Flow Improvers
- 11.1.7. Antiknock Agents
- 11.1.8. Other Product Types
- 11.2. Market Analysis, Insights and Forecast - by Application
- 11.2.1. Diesel
- 11.2.2. Gasoline
- 11.2.3. Jet Fuel
- 11.2.4. Other Applications
- 11.3. Market Analysis, Insights and Forecast - by Geography
- 11.3.1. China
- 11.3.2. India
- 11.3.3. Japan
- 11.3.4. South Korea
- 11.3.5. Rest of Asia-Pacific
- 11.1. Market Analysis, Insights and Forecast - by Product Type
- 12. Competitive Analysis
- 12.1. Company Profiles
- 12.1.1 Innospec Inc
- 12.1.1.1. Company Overview
- 12.1.1.2. Products
- 12.1.1.3. Company Financials
- 12.1.1.4. SWOT Analysis
- 12.1.2 Baker Hughes a GE Company LLC
- 12.1.2.1. Company Overview
- 12.1.2.2. Products
- 12.1.2.3. Company Financials
- 12.1.2.4. SWOT Analysis
- 12.1.3 Clariant
- 12.1.3.1. Company Overview
- 12.1.3.2. Products
- 12.1.3.3. Company Financials
- 12.1.3.4. SWOT Analysis
- 12.1.4 Exxon Mobil Corporation
- 12.1.4.1. Company Overview
- 12.1.4.2. Products
- 12.1.4.3. Company Financials
- 12.1.4.4. SWOT Analysis
- 12.1.5 Royal Dutch Shell plc
- 12.1.5.1. Company Overview
- 12.1.5.2. Products
- 12.1.5.3. Company Financials
- 12.1.5.4. SWOT Analysis
- 12.1.6 Evonik Industries AG
- 12.1.6.1. Company Overview
- 12.1.6.2. Products
- 12.1.6.3. Company Financials
- 12.1.6.4. SWOT Analysis
- 12.1.7 LANXESS
- 12.1.7.1. Company Overview
- 12.1.7.2. Products
- 12.1.7.3. Company Financials
- 12.1.7.4. SWOT Analysis
- 12.1.8 Croda International Plc
- 12.1.8.1. Company Overview
- 12.1.8.2. Products
- 12.1.8.3. Company Financials
- 12.1.8.4. SWOT Analysis
- 12.1.9 BASF SE
- 12.1.9.1. Company Overview
- 12.1.9.2. Products
- 12.1.9.3. Company Financials
- 12.1.9.4. SWOT Analysis
- 12.1.10 Chevron Corporation
- 12.1.10.1. Company Overview
- 12.1.10.2. Products
- 12.1.10.3. Company Financials
- 12.1.10.4. SWOT Analysis
- 12.1.11 The Lubrizol Corporation
- 12.1.11.1. Company Overview
- 12.1.11.2. Products
- 12.1.11.3. Company Financials
- 12.1.11.4. SWOT Analysis
- 12.1.12 Dorfketal Chemicals (I) Pvt Ltd
- 12.1.12.1. Company Overview
- 12.1.12.2. Products
- 12.1.12.3. Company Financials
- 12.1.12.4. SWOT Analysis
- 12.1.13 Eni SpA
- 12.1.13.1. Company Overview
- 12.1.13.2. Products
- 12.1.13.3. Company Financials
- 12.1.13.4. SWOT Analysis
- 12.1.14 Total*List Not Exhaustive
- 12.1.14.1. Company Overview
- 12.1.14.2. Products
- 12.1.14.3. Company Financials
- 12.1.14.4. SWOT Analysis
- 12.1.15 Afton Chemical
- 12.1.15.1. Company Overview
- 12.1.15.2. Products
- 12.1.15.3. Company Financials
- 12.1.15.4. SWOT Analysis
- 12.1.1 Innospec Inc
- 12.2. Market Entropy
- 12.2.1 Company's Key Areas Served
- 12.2.2 Recent Developments
- 12.3. Company Market Share Analysis 2025
- 12.3.1 Top 5 Companies Market Share Analysis
- 12.3.2 Top 3 Companies Market Share Analysis
- 12.4. List of Potential Customers
- 13. Research Methodology
List of Figures
- Figure 1: Global APCA Fuel Additive Industry Revenue Breakdown (million, %) by Region 2025 & 2033
- Figure 2: China APCA Fuel Additive Industry Revenue (million), by Product Type 2025 & 2033
- Figure 3: China APCA Fuel Additive Industry Revenue Share (%), by Product Type 2025 & 2033
- Figure 4: China APCA Fuel Additive Industry Revenue (million), by Application 2025 & 2033
- Figure 5: China APCA Fuel Additive Industry Revenue Share (%), by Application 2025 & 2033
- Figure 6: China APCA Fuel Additive Industry Revenue (million), by Geography 2025 & 2033
- Figure 7: China APCA Fuel Additive Industry Revenue Share (%), by Geography 2025 & 2033
- Figure 8: China APCA Fuel Additive Industry Revenue (million), by Country 2025 & 2033
- Figure 9: China APCA Fuel Additive Industry Revenue Share (%), by Country 2025 & 2033
- Figure 10: India APCA Fuel Additive Industry Revenue (million), by Product Type 2025 & 2033
- Figure 11: India APCA Fuel Additive Industry Revenue Share (%), by Product Type 2025 & 2033
- Figure 12: India APCA Fuel Additive Industry Revenue (million), by Application 2025 & 2033
- Figure 13: India APCA Fuel Additive Industry Revenue Share (%), by Application 2025 & 2033
- Figure 14: India APCA Fuel Additive Industry Revenue (million), by Geography 2025 & 2033
- Figure 15: India APCA Fuel Additive Industry Revenue Share (%), by Geography 2025 & 2033
- Figure 16: India APCA Fuel Additive Industry Revenue (million), by Country 2025 & 2033
- Figure 17: India APCA Fuel Additive Industry Revenue Share (%), by Country 2025 & 2033
- Figure 18: Japan APCA Fuel Additive Industry Revenue (million), by Product Type 2025 & 2033
- Figure 19: Japan APCA Fuel Additive Industry Revenue Share (%), by Product Type 2025 & 2033
- Figure 20: Japan APCA Fuel Additive Industry Revenue (million), by Application 2025 & 2033
- Figure 21: Japan APCA Fuel Additive Industry Revenue Share (%), by Application 2025 & 2033
- Figure 22: Japan APCA Fuel Additive Industry Revenue (million), by Geography 2025 & 2033
- Figure 23: Japan APCA Fuel Additive Industry Revenue Share (%), by Geography 2025 & 2033
- Figure 24: Japan APCA Fuel Additive Industry Revenue (million), by Country 2025 & 2033
- Figure 25: Japan APCA Fuel Additive Industry Revenue Share (%), by Country 2025 & 2033
- Figure 26: South Korea APCA Fuel Additive Industry Revenue (million), by Product Type 2025 & 2033
- Figure 27: South Korea APCA Fuel Additive Industry Revenue Share (%), by Product Type 2025 & 2033
- Figure 28: South Korea APCA Fuel Additive Industry Revenue (million), by Application 2025 & 2033
- Figure 29: South Korea APCA Fuel Additive Industry Revenue Share (%), by Application 2025 & 2033
- Figure 30: South Korea APCA Fuel Additive Industry Revenue (million), by Geography 2025 & 2033
- Figure 31: South Korea APCA Fuel Additive Industry Revenue Share (%), by Geography 2025 & 2033
- Figure 32: South Korea APCA Fuel Additive Industry Revenue (million), by Country 2025 & 2033
- Figure 33: South Korea APCA Fuel Additive Industry Revenue Share (%), by Country 2025 & 2033
- Figure 34: Rest of Asia Pacific APCA Fuel Additive Industry Revenue (million), by Product Type 2025 & 2033
- Figure 35: Rest of Asia Pacific APCA Fuel Additive Industry Revenue Share (%), by Product Type 2025 & 2033
- Figure 36: Rest of Asia Pacific APCA Fuel Additive Industry Revenue (million), by Application 2025 & 2033
- Figure 37: Rest of Asia Pacific APCA Fuel Additive Industry Revenue Share (%), by Application 2025 & 2033
- Figure 38: Rest of Asia Pacific APCA Fuel Additive Industry Revenue (million), by Geography 2025 & 2033
- Figure 39: Rest of Asia Pacific APCA Fuel Additive Industry Revenue Share (%), by Geography 2025 & 2033
- Figure 40: Rest of Asia Pacific APCA Fuel Additive Industry Revenue (million), by Country 2025 & 2033
- Figure 41: Rest of Asia Pacific APCA Fuel Additive Industry Revenue Share (%), by Country 2025 & 2033
List of Tables
- Table 1: Global APCA Fuel Additive Industry Revenue million Forecast, by Product Type 2020 & 2033
- Table 2: Global APCA Fuel Additive Industry Revenue million Forecast, by Application 2020 & 2033
- Table 3: Global APCA Fuel Additive Industry Revenue million Forecast, by Geography 2020 & 2033
- Table 4: Global APCA Fuel Additive Industry Revenue million Forecast, by Region 2020 & 2033
- Table 5: Global APCA Fuel Additive Industry Revenue million Forecast, by Product Type 2020 & 2033
- Table 6: Global APCA Fuel Additive Industry Revenue million Forecast, by Application 2020 & 2033
- Table 7: Global APCA Fuel Additive Industry Revenue million Forecast, by Geography 2020 & 2033
- Table 8: Global APCA Fuel Additive Industry Revenue million Forecast, by Country 2020 & 2033
- Table 9: Global APCA Fuel Additive Industry Revenue million Forecast, by Product Type 2020 & 2033
- Table 10: Global APCA Fuel Additive Industry Revenue million Forecast, by Application 2020 & 2033
- Table 11: Global APCA Fuel Additive Industry Revenue million Forecast, by Geography 2020 & 2033
- Table 12: Global APCA Fuel Additive Industry Revenue million Forecast, by Country 2020 & 2033
- Table 13: Global APCA Fuel Additive Industry Revenue million Forecast, by Product Type 2020 & 2033
- Table 14: Global APCA Fuel Additive Industry Revenue million Forecast, by Application 2020 & 2033
- Table 15: Global APCA Fuel Additive Industry Revenue million Forecast, by Geography 2020 & 2033
- Table 16: Global APCA Fuel Additive Industry Revenue million Forecast, by Country 2020 & 2033
- Table 17: Global APCA Fuel Additive Industry Revenue million Forecast, by Product Type 2020 & 2033
- Table 18: Global APCA Fuel Additive Industry Revenue million Forecast, by Application 2020 & 2033
- Table 19: Global APCA Fuel Additive Industry Revenue million Forecast, by Geography 2020 & 2033
- Table 20: Global APCA Fuel Additive Industry Revenue million Forecast, by Country 2020 & 2033
- Table 21: Global APCA Fuel Additive Industry Revenue million Forecast, by Product Type 2020 & 2033
- Table 22: Global APCA Fuel Additive Industry Revenue million Forecast, by Application 2020 & 2033
- Table 23: Global APCA Fuel Additive Industry Revenue million Forecast, by Geography 2020 & 2033
- Table 24: Global APCA Fuel Additive Industry Revenue million Forecast, by Country 2020 & 2033
Frequently Asked Questions
1. What is the projected Compound Annual Growth Rate (CAGR) of the APCA Fuel Additive Industry?
The projected CAGR is approximately 4.5%.
2. Which companies are prominent players in the APCA Fuel Additive Industry?
Key companies in the market include Innospec Inc, Baker Hughes a GE Company LLC, Clariant, Exxon Mobil Corporation, Royal Dutch Shell plc, Evonik Industries AG, LANXESS, Croda International Plc, BASF SE, Chevron Corporation, The Lubrizol Corporation, Dorfketal Chemicals (I) Pvt Ltd, Eni SpA, Total*List Not Exhaustive, Afton Chemical.
3. What are the main segments of the APCA Fuel Additive Industry?
The market segments include Product Type, Application, Geography.
4. Can you provide details about the market size?
The market size is estimated to be USD 768 million as of 2022.
5. What are some drivers contributing to market growth?
; Enactment of Stringent Environmental Regulations; Rising Passenger Traffic Contributing to the Growth of the Aviation Market.
6. What are the notable trends driving market growth?
Gasoline to Dominate the Market.
7. Are there any restraints impacting market growth?
; Increasing Demand and Penetration of Battery Electric Vehicles (BEVs); High Costs of R&D Activities.
8. Can you provide examples of recent developments in the market?
N/A
9. What pricing options are available for accessing the report?
Pricing options include single-user, multi-user, and enterprise licenses priced at USD 4750, USD 5250, and USD 8750 respectively.
10. Is the market size provided in terms of value or volume?
The market size is provided in terms of value, measured in million.
11. Are there any specific market keywords associated with the report?
Yes, the market keyword associated with the report is "APCA Fuel Additive Industry," which aids in identifying and referencing the specific market segment covered.
12. How do I determine which pricing option suits my needs best?
The pricing options vary based on user requirements and access needs. Individual users may opt for single-user licenses, while businesses requiring broader access may choose multi-user or enterprise licenses for cost-effective access to the report.
13. Are there any additional resources or data provided in the APCA Fuel Additive Industry report?
While the report offers comprehensive insights, it's advisable to review the specific contents or supplementary materials provided to ascertain if additional resources or data are available.
14. How can I stay updated on further developments or reports in the APCA Fuel Additive Industry?
To stay informed about further developments, trends, and reports in the APCA Fuel Additive Industry, consider subscribing to industry newsletters, following relevant companies and organizations, or regularly checking reputable industry news sources and publications.
Methodology
Step 1 - Identification of Relevant Samples Size from Population Database


Step 2 - Approaches for Defining Global Market Size (Value, Volume* & Price*)

Note*: In applicable scenarios
Step 3 - Data Sources
Primary Research
- Web Analytics
- Survey Reports
- Research Institute
- Latest Research Reports
- Opinion Leaders
Secondary Research
- Annual Reports
- White Paper
- Latest Press Release
- Industry Association
- Paid Database
- Investor Presentations

Step 4 - Data Triangulation
Involves using different sources of information in order to increase the validity of a study
These sources are likely to be stakeholders in a program - participants, other researchers, program staff, other community members, and so on.
Then we put all data in single framework & apply various statistical tools to find out the dynamic on the market.
During the analysis stage, feedback from the stakeholder groups would be compared to determine areas of agreement as well as areas of divergence