

Key Insights
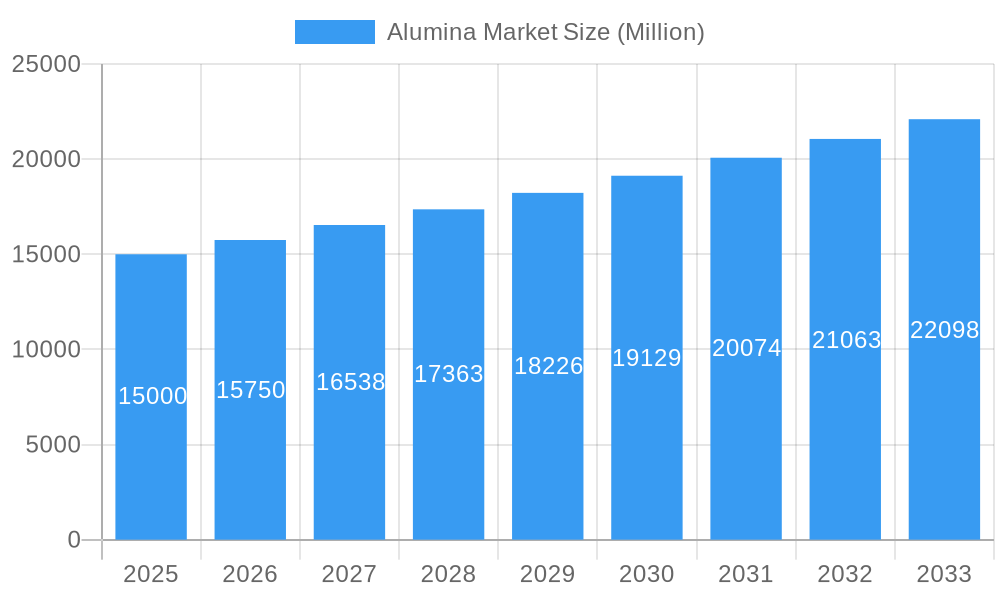
The global alumina market is poised for significant expansion, fueled by escalating demand across a spectrum of industrial applications. With a projected market size of $46.83 billion by 2025 and a Compound Annual Growth Rate (CAGR) of 4.7%, this sector is set for robust growth through 2033. Key growth catalysts include the expanding oil and gas industry's reliance on alumina-based catalysts and adsorbents, the burgeoning water treatment sector utilizing alumina for purification, and the sustained demand from the chemical industry for essential alumina components. Technological advancements in alumina production, enhancing purity and efficiency, are further accelerating market penetration. The market is segmented by key applications such as adsorbents, desiccants, and catalysts, with strong adoption anticipated across all. Geographically, the Asia-Pacific region, led by China and India, is expected to be the dominant force, driven by rapid industrialization and infrastructure development. North America and Europe also represent substantial market shares, supported by mature chemical and water treatment sectors. However, market expansion may be tempered by fluctuations in raw material costs and stringent environmental regulations, necessitating a focus on sustainable production and optimized supply chains.
Alumina Market Market Size (In Billion)
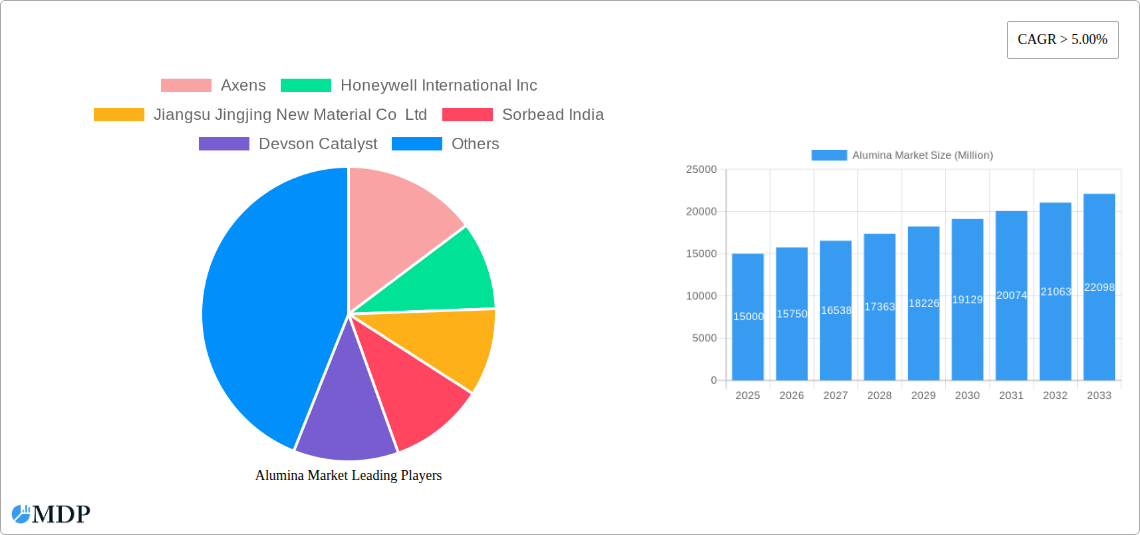
The competitive environment features a dynamic interplay between global leaders and regional contenders. Prominent players such as Axens, Honeywell International Inc., and BASF SE are setting the pace with comprehensive product offerings and extensive global networks. Regional competitors are also strengthening their positions by capitalizing on cost efficiencies and localized market expertise. Future success will hinge on innovation in advanced alumina products tailored to specific applications and adaptability to evolving industry demands. Strategic imperatives include prioritizing sustainability, optimizing production processes, and actively pursuing expansion into emerging markets. The period from 2025 to 2033 presents substantial opportunities for growth, underscoring the importance of strategic investments in research and development and geographical market penetration.
Alumina Market Company Market Share
Alumina Market Report: 2019-2033 Forecast
This comprehensive report provides a detailed analysis of the Alumina Market, offering invaluable insights for industry stakeholders seeking to navigate this dynamic sector. Covering the period from 2019 to 2033, with a focus on 2025, this report unveils key trends, challenges, and opportunities shaping the future of the alumina market. Expect in-depth analysis across diverse segments, including adsorbent, desiccant, and catalyst applications, spanning various end-user industries like oil & gas, water treatment, and chemicals. The report is packed with actionable data and expert analysis, perfect for strategic planning and investment decisions.
Alumina Market Market Dynamics & Concentration
The global alumina market exhibits a moderately concentrated landscape, with a few major players holding significant market share. Market concentration is influenced by factors including economies of scale in production, technological advancements, and stringent regulatory frameworks governing environmental impact. The market is witnessing an increase in M&A activities, with a total of xx M&A deals recorded between 2019 and 2024. This consolidation reflects the strategic efforts of key players to expand their market presence and diversify product portfolios. Innovation in alumina production methods, focusing on sustainability and efficiency, is a key driver of growth. The emergence of substitute materials presents a challenge, necessitating continuous innovation to maintain competitiveness. End-user trends, especially in rapidly growing sectors like renewable energy and electric vehicles, are significantly impacting demand.
- Market Share: Top 5 players account for approximately xx% of the global market in 2024.
- M&A Activity: xx deals recorded between 2019 and 2024, showing a growing trend of market consolidation.
- Innovation Drivers: Sustainability concerns, increasing demand from emerging industries, and efficiency improvements in production techniques.
- Regulatory Frameworks: Stringent environmental regulations influence production methods and waste management practices.
- Product Substitutes: Competition from alternative materials requires ongoing innovation and differentiation.
Alumina Market Industry Trends & Analysis
The alumina market is projected to witness a Compound Annual Growth Rate (CAGR) of xx% during the forecast period (2025-2033). This robust growth is propelled by several key factors. The rising demand for alumina in various applications, particularly in the burgeoning renewable energy and electric vehicle sectors, is a significant driver. Technological advancements leading to more efficient and sustainable production processes are enhancing market competitiveness. Changing consumer preferences toward eco-friendly products are further fueling the demand for sustainably sourced and produced alumina. The competitive landscape is dynamic, with existing players continually innovating and new entrants emerging. Market penetration in untapped regions presents significant opportunities for expansion.
Leading Markets & Segments in Alumina Market
The Asia-Pacific region is expected to dominate the alumina market throughout the forecast period, driven by rapid industrialization and substantial infrastructure development. Within applications, the adsorbent segment holds the largest market share, owing to its wide-ranging uses in various industries. The oil and gas sector remains a dominant end-user, while the water treatment segment is showing promising growth potential.
Key Drivers in Asia-Pacific:
- Rapid industrialization and urbanization
- Strong economic growth
- Increasing investments in infrastructure projects
- Growing demand from emerging industries.
Dominant Application: Adsorbent segment, due to its wide use in water purification, industrial processes, and environmental remediation.
Dominant End-User: Oil and gas industry, followed by water treatment with high growth potential.
Regional Analysis: Asia-Pacific holds the leading position, followed by North America and Europe.
Alumina Market Product Developments
Recent advancements in alumina production technologies focus on enhancing product purity, increasing surface area, and improving performance characteristics. These innovations cater to the growing demand for high-performance alumina in specialized applications such as lithium-ion batteries and high-efficiency catalysts. Companies are focusing on developing customized alumina solutions to meet specific end-user requirements. This trend is driving market differentiation and fostering innovation.
Key Drivers of Alumina Market Growth
Several factors contribute to the robust growth of the alumina market. Technological advancements in production processes lead to higher efficiency and lower costs. The growing demand from key end-user industries, particularly in the renewable energy sector, is another crucial driver. Favorable government policies and regulations supporting sustainable industrial practices further stimulate market expansion. The increasing adoption of alumina in emerging applications, such as advanced materials and electronics, adds to the growth momentum.
Challenges in the Alumina Market Market
Fluctuations in raw material prices pose a significant challenge to the industry's profitability. Supply chain disruptions can impact production and delivery timelines. Intense competition among established and emerging players creates pressure on pricing and margins. Stringent environmental regulations necessitate investments in cleaner production technologies and waste management, increasing operational costs. These factors collectively impact the overall market dynamics.
Emerging Opportunities in Alumina Market
The expanding use of alumina in emerging applications, like advanced ceramics and high-performance composites, presents lucrative opportunities. Strategic partnerships and collaborations among industry players can foster innovation and accelerate market expansion. The focus on sustainable production practices offers a competitive advantage and enhances the market appeal of eco-friendly alumina. Exploring new geographic markets with growing industrial activity will unlock further growth potential.
Leading Players in the Alumina Market Sector
- Axens
- Honeywell International Inc
- Jiangsu Jingjing New Material Co Ltd
- Sorbead India
- Devson Catalyst
- Evonik Industries AG
- Petrosadid
- BASF SE
- Dynamic Adsorbents Inc
- Sumitomo Chemical Co Ltd
- Huber Engineered Materials
- KIN Filter Engineering Co Limited
Key Milestones in Alumina Market Industry
- October 2022: Axens acquired Rio Tinto Alcan's activated alumina business, expanding its global market reach.
- February 2023: Evonik announced a significant investment to expand its fumed alumina production capacity in Japan, focusing on lithium-ion battery applications. This expansion is expected to be operational by 2025.
Strategic Outlook for Alumina Market Market
The alumina market is poised for sustained growth, driven by increasing demand from diverse sectors and technological advancements. Strategic initiatives focusing on sustainable production, product diversification, and market expansion into high-growth regions will be crucial for success. Companies focusing on innovation and collaboration will be best positioned to capitalize on the significant opportunities within this dynamic market.
Alumina Market Segmentation
-
1. Application
- 1.1. Adsorbent
- 1.2. Desiccant
- 1.3. Catalyst
- 1.4. Other Applications
-
2. End-user Industry
- 2.1. Oil and Gas
- 2.2. Water Treatment
- 2.3. Chemical
- 2.4. Healthcare
- 2.5. Other End-user Industries
Alumina Market Segmentation By Geography
-
1. Asia Pacific
- 1.1. China
- 1.2. India
- 1.3. Japan
- 1.4. South Korea
- 1.5. Rest of Asia Pacific
-
2. North America
- 2.1. United States
- 2.2. Canada
- 2.3. Mexico
-
3. Europe
- 3.1. Germany
- 3.2. United Kingdom
- 3.3. France
- 3.4. Italy
- 3.5. Rest of Europe
-
4. South America
- 4.1. Brazil
- 4.2. Argentina
- 4.3. Rest of South America
-
5. Middle East and Africa
- 5.1. Saudi Arabia
- 5.2. South Africa
- 5.3. Rest of Middle East and Africa
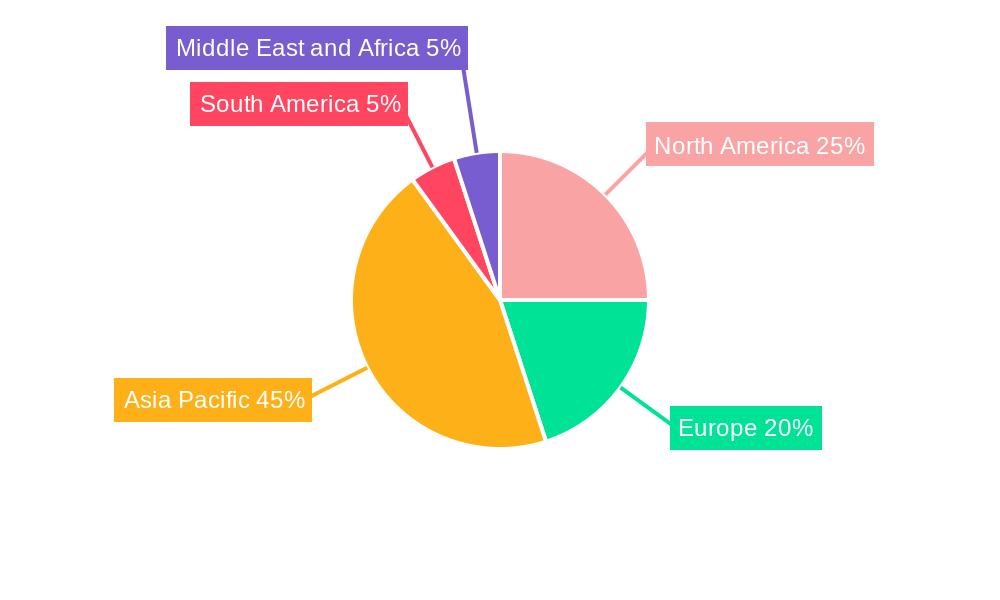
Alumina Market Regional Market Share
Geographic Coverage of Alumina Market
Alumina Market REPORT HIGHLIGHTS
| Aspects | Details |
|---|---|
| Study Period | 2020-2034 |
| Base Year | 2025 |
| Estimated Year | 2026 |
| Forecast Period | 2026-2034 |
| Historical Period | 2020-2025 |
| Growth Rate | CAGR of 4.7% from 2020-2034 |
| Segmentation |
|
Table of Contents
- 1. Introduction
- 1.1. Research Scope
- 1.2. Market Segmentation
- 1.3. Research Objective
- 1.4. Definitions and Assumptions
- 2. Executive Summary
- 2.1. Market Snapshot
- 3. Market Dynamics
- 3.1. Market Drivers
- 3.2. Market Restrains
- 3.3. Market Trends
- 3.4. Market Opportunities
- 4. Market Factor Analysis
- 4.1. Porters Five Forces
- 4.1.1. Bargaining Power of Suppliers
- 4.1.2. Bargaining Power of Buyers
- 4.1.3. Threat of New Entrants
- 4.1.4. Threat of Substitutes
- 4.1.5. Competitive Rivalry
- 4.2. PESTEL analysis
- 4.3. BCG Analysis
- 4.3.1. Stars (High Growth, High Market Share)
- 4.3.2. Cash Cows (Low Growth, High Market Share)
- 4.3.3. Question Mark (High Growth, Low Market Share)
- 4.3.4. Dogs (Low Growth, Low Market Share)
- 4.4. Ansoff Matrix Analysis
- 4.5. Supply Chain Analysis
- 4.6. Regulatory Landscape
- 4.7. Current Market Potential and Opportunity Assessment (TAM–SAM–SOM Framework)
- 4.8. MDP Analyst Note
- 4.1. Porters Five Forces
- 5. Market Analysis, Insights and Forecast 2021-2033
- 5.1. Market Analysis, Insights and Forecast - by Application
- 5.1.1. Adsorbent
- 5.1.2. Desiccant
- 5.1.3. Catalyst
- 5.1.4. Other Applications
- 5.2. Market Analysis, Insights and Forecast - by End-user Industry
- 5.2.1. Oil and Gas
- 5.2.2. Water Treatment
- 5.2.3. Chemical
- 5.2.4. Healthcare
- 5.2.5. Other End-user Industries
- 5.3. Market Analysis, Insights and Forecast - by Region
- 5.3.1. Asia Pacific
- 5.3.2. North America
- 5.3.3. Europe
- 5.3.4. South America
- 5.3.5. Middle East and Africa
- 5.1. Market Analysis, Insights and Forecast - by Application
- 6. Global Alumina Market Analysis, Insights and Forecast, 2021-2033
- 6.1. Market Analysis, Insights and Forecast - by Application
- 6.1.1. Adsorbent
- 6.1.2. Desiccant
- 6.1.3. Catalyst
- 6.1.4. Other Applications
- 6.2. Market Analysis, Insights and Forecast - by End-user Industry
- 6.2.1. Oil and Gas
- 6.2.2. Water Treatment
- 6.2.3. Chemical
- 6.2.4. Healthcare
- 6.2.5. Other End-user Industries
- 6.1. Market Analysis, Insights and Forecast - by Application
- 7. Asia Pacific Alumina Market Analysis, Insights and Forecast, 2020-2032
- 7.1. Market Analysis, Insights and Forecast - by Application
- 7.1.1. Adsorbent
- 7.1.2. Desiccant
- 7.1.3. Catalyst
- 7.1.4. Other Applications
- 7.2. Market Analysis, Insights and Forecast - by End-user Industry
- 7.2.1. Oil and Gas
- 7.2.2. Water Treatment
- 7.2.3. Chemical
- 7.2.4. Healthcare
- 7.2.5. Other End-user Industries
- 7.1. Market Analysis, Insights and Forecast - by Application
- 8. North America Alumina Market Analysis, Insights and Forecast, 2020-2032
- 8.1. Market Analysis, Insights and Forecast - by Application
- 8.1.1. Adsorbent
- 8.1.2. Desiccant
- 8.1.3. Catalyst
- 8.1.4. Other Applications
- 8.2. Market Analysis, Insights and Forecast - by End-user Industry
- 8.2.1. Oil and Gas
- 8.2.2. Water Treatment
- 8.2.3. Chemical
- 8.2.4. Healthcare
- 8.2.5. Other End-user Industries
- 8.1. Market Analysis, Insights and Forecast - by Application
- 9. Europe Alumina Market Analysis, Insights and Forecast, 2020-2032
- 9.1. Market Analysis, Insights and Forecast - by Application
- 9.1.1. Adsorbent
- 9.1.2. Desiccant
- 9.1.3. Catalyst
- 9.1.4. Other Applications
- 9.2. Market Analysis, Insights and Forecast - by End-user Industry
- 9.2.1. Oil and Gas
- 9.2.2. Water Treatment
- 9.2.3. Chemical
- 9.2.4. Healthcare
- 9.2.5. Other End-user Industries
- 9.1. Market Analysis, Insights and Forecast - by Application
- 10. South America Alumina Market Analysis, Insights and Forecast, 2020-2032
- 10.1. Market Analysis, Insights and Forecast - by Application
- 10.1.1. Adsorbent
- 10.1.2. Desiccant
- 10.1.3. Catalyst
- 10.1.4. Other Applications
- 10.2. Market Analysis, Insights and Forecast - by End-user Industry
- 10.2.1. Oil and Gas
- 10.2.2. Water Treatment
- 10.2.3. Chemical
- 10.2.4. Healthcare
- 10.2.5. Other End-user Industries
- 10.1. Market Analysis, Insights and Forecast - by Application
- 11. Middle East and Africa Alumina Market Analysis, Insights and Forecast, 2020-2032
- 11.1. Market Analysis, Insights and Forecast - by Application
- 11.1.1. Adsorbent
- 11.1.2. Desiccant
- 11.1.3. Catalyst
- 11.1.4. Other Applications
- 11.2. Market Analysis, Insights and Forecast - by End-user Industry
- 11.2.1. Oil and Gas
- 11.2.2. Water Treatment
- 11.2.3. Chemical
- 11.2.4. Healthcare
- 11.2.5. Other End-user Industries
- 11.1. Market Analysis, Insights and Forecast - by Application
- 12. Competitive Analysis
- 12.1. Company Profiles
- 12.1.1 Axens
- 12.1.1.1. Company Overview
- 12.1.1.2. Products
- 12.1.1.3. Company Financials
- 12.1.1.4. SWOT Analysis
- 12.1.2 Honeywell International Inc
- 12.1.2.1. Company Overview
- 12.1.2.2. Products
- 12.1.2.3. Company Financials
- 12.1.2.4. SWOT Analysis
- 12.1.3 Jiangsu Jingjing New Material Co Ltd
- 12.1.3.1. Company Overview
- 12.1.3.2. Products
- 12.1.3.3. Company Financials
- 12.1.3.4. SWOT Analysis
- 12.1.4 Sorbead India
- 12.1.4.1. Company Overview
- 12.1.4.2. Products
- 12.1.4.3. Company Financials
- 12.1.4.4. SWOT Analysis
- 12.1.5 Devson Catalyst
- 12.1.5.1. Company Overview
- 12.1.5.2. Products
- 12.1.5.3. Company Financials
- 12.1.5.4. SWOT Analysis
- 12.1.6 Evonik Industries AG
- 12.1.6.1. Company Overview
- 12.1.6.2. Products
- 12.1.6.3. Company Financials
- 12.1.6.4. SWOT Analysis
- 12.1.7 Petrosadid
- 12.1.7.1. Company Overview
- 12.1.7.2. Products
- 12.1.7.3. Company Financials
- 12.1.7.4. SWOT Analysis
- 12.1.8 BASF SE
- 12.1.8.1. Company Overview
- 12.1.8.2. Products
- 12.1.8.3. Company Financials
- 12.1.8.4. SWOT Analysis
- 12.1.9 Dynamic Adsorbents Inc
- 12.1.9.1. Company Overview
- 12.1.9.2. Products
- 12.1.9.3. Company Financials
- 12.1.9.4. SWOT Analysis
- 12.1.10 Sumitomo Chemical Co Ltd
- 12.1.10.1. Company Overview
- 12.1.10.2. Products
- 12.1.10.3. Company Financials
- 12.1.10.4. SWOT Analysis
- 12.1.11 Huber Engineered Materials
- 12.1.11.1. Company Overview
- 12.1.11.2. Products
- 12.1.11.3. Company Financials
- 12.1.11.4. SWOT Analysis
- 12.1.12 KIN Filter Engineering Co Limited
- 12.1.12.1. Company Overview
- 12.1.12.2. Products
- 12.1.12.3. Company Financials
- 12.1.12.4. SWOT Analysis
- 12.1.1 Axens
- 12.2. Market Entropy
- 12.2.1 Company's Key Areas Served
- 12.2.2 Recent Developments
- 12.3. Company Market Share Analysis 2025
- 12.3.1 Top 5 Companies Market Share Analysis
- 12.3.2 Top 3 Companies Market Share Analysis
- 12.4. List of Potential Customers
- 13. Research Methodology
List of Figures
- Figure 1: Global Alumina Market Revenue Breakdown (billion, %) by Region 2025 & 2033
- Figure 2: Asia Pacific Alumina Market Revenue (billion), by Application 2025 & 2033
- Figure 3: Asia Pacific Alumina Market Revenue Share (%), by Application 2025 & 2033
- Figure 4: Asia Pacific Alumina Market Revenue (billion), by End-user Industry 2025 & 2033
- Figure 5: Asia Pacific Alumina Market Revenue Share (%), by End-user Industry 2025 & 2033
- Figure 6: Asia Pacific Alumina Market Revenue (billion), by Country 2025 & 2033
- Figure 7: Asia Pacific Alumina Market Revenue Share (%), by Country 2025 & 2033
- Figure 8: North America Alumina Market Revenue (billion), by Application 2025 & 2033
- Figure 9: North America Alumina Market Revenue Share (%), by Application 2025 & 2033
- Figure 10: North America Alumina Market Revenue (billion), by End-user Industry 2025 & 2033
- Figure 11: North America Alumina Market Revenue Share (%), by End-user Industry 2025 & 2033
- Figure 12: North America Alumina Market Revenue (billion), by Country 2025 & 2033
- Figure 13: North America Alumina Market Revenue Share (%), by Country 2025 & 2033
- Figure 14: Europe Alumina Market Revenue (billion), by Application 2025 & 2033
- Figure 15: Europe Alumina Market Revenue Share (%), by Application 2025 & 2033
- Figure 16: Europe Alumina Market Revenue (billion), by End-user Industry 2025 & 2033
- Figure 17: Europe Alumina Market Revenue Share (%), by End-user Industry 2025 & 2033
- Figure 18: Europe Alumina Market Revenue (billion), by Country 2025 & 2033
- Figure 19: Europe Alumina Market Revenue Share (%), by Country 2025 & 2033
- Figure 20: South America Alumina Market Revenue (billion), by Application 2025 & 2033
- Figure 21: South America Alumina Market Revenue Share (%), by Application 2025 & 2033
- Figure 22: South America Alumina Market Revenue (billion), by End-user Industry 2025 & 2033
- Figure 23: South America Alumina Market Revenue Share (%), by End-user Industry 2025 & 2033
- Figure 24: South America Alumina Market Revenue (billion), by Country 2025 & 2033
- Figure 25: South America Alumina Market Revenue Share (%), by Country 2025 & 2033
- Figure 26: Middle East and Africa Alumina Market Revenue (billion), by Application 2025 & 2033
- Figure 27: Middle East and Africa Alumina Market Revenue Share (%), by Application 2025 & 2033
- Figure 28: Middle East and Africa Alumina Market Revenue (billion), by End-user Industry 2025 & 2033
- Figure 29: Middle East and Africa Alumina Market Revenue Share (%), by End-user Industry 2025 & 2033
- Figure 30: Middle East and Africa Alumina Market Revenue (billion), by Country 2025 & 2033
- Figure 31: Middle East and Africa Alumina Market Revenue Share (%), by Country 2025 & 2033
List of Tables
- Table 1: Global Alumina Market Revenue billion Forecast, by Application 2020 & 2033
- Table 2: Global Alumina Market Revenue billion Forecast, by End-user Industry 2020 & 2033
- Table 3: Global Alumina Market Revenue billion Forecast, by Region 2020 & 2033
- Table 4: Global Alumina Market Revenue billion Forecast, by Application 2020 & 2033
- Table 5: Global Alumina Market Revenue billion Forecast, by End-user Industry 2020 & 2033
- Table 6: Global Alumina Market Revenue billion Forecast, by Country 2020 & 2033
- Table 7: China Alumina Market Revenue (billion) Forecast, by Application 2020 & 2033
- Table 8: India Alumina Market Revenue (billion) Forecast, by Application 2020 & 2033
- Table 9: Japan Alumina Market Revenue (billion) Forecast, by Application 2020 & 2033
- Table 10: South Korea Alumina Market Revenue (billion) Forecast, by Application 2020 & 2033
- Table 11: Rest of Asia Pacific Alumina Market Revenue (billion) Forecast, by Application 2020 & 2033
- Table 12: Global Alumina Market Revenue billion Forecast, by Application 2020 & 2033
- Table 13: Global Alumina Market Revenue billion Forecast, by End-user Industry 2020 & 2033
- Table 14: Global Alumina Market Revenue billion Forecast, by Country 2020 & 2033
- Table 15: United States Alumina Market Revenue (billion) Forecast, by Application 2020 & 2033
- Table 16: Canada Alumina Market Revenue (billion) Forecast, by Application 2020 & 2033
- Table 17: Mexico Alumina Market Revenue (billion) Forecast, by Application 2020 & 2033
- Table 18: Global Alumina Market Revenue billion Forecast, by Application 2020 & 2033
- Table 19: Global Alumina Market Revenue billion Forecast, by End-user Industry 2020 & 2033
- Table 20: Global Alumina Market Revenue billion Forecast, by Country 2020 & 2033
- Table 21: Germany Alumina Market Revenue (billion) Forecast, by Application 2020 & 2033
- Table 22: United Kingdom Alumina Market Revenue (billion) Forecast, by Application 2020 & 2033
- Table 23: France Alumina Market Revenue (billion) Forecast, by Application 2020 & 2033
- Table 24: Italy Alumina Market Revenue (billion) Forecast, by Application 2020 & 2033
- Table 25: Rest of Europe Alumina Market Revenue (billion) Forecast, by Application 2020 & 2033
- Table 26: Global Alumina Market Revenue billion Forecast, by Application 2020 & 2033
- Table 27: Global Alumina Market Revenue billion Forecast, by End-user Industry 2020 & 2033
- Table 28: Global Alumina Market Revenue billion Forecast, by Country 2020 & 2033
- Table 29: Brazil Alumina Market Revenue (billion) Forecast, by Application 2020 & 2033
- Table 30: Argentina Alumina Market Revenue (billion) Forecast, by Application 2020 & 2033
- Table 31: Rest of South America Alumina Market Revenue (billion) Forecast, by Application 2020 & 2033
- Table 32: Global Alumina Market Revenue billion Forecast, by Application 2020 & 2033
- Table 33: Global Alumina Market Revenue billion Forecast, by End-user Industry 2020 & 2033
- Table 34: Global Alumina Market Revenue billion Forecast, by Country 2020 & 2033
- Table 35: Saudi Arabia Alumina Market Revenue (billion) Forecast, by Application 2020 & 2033
- Table 36: South Africa Alumina Market Revenue (billion) Forecast, by Application 2020 & 2033
- Table 37: Rest of Middle East and Africa Alumina Market Revenue (billion) Forecast, by Application 2020 & 2033
Frequently Asked Questions
1. What is the projected Compound Annual Growth Rate (CAGR) of the Alumina Market?
The projected CAGR is approximately 4.7%.
2. Which companies are prominent players in the Alumina Market?
Key companies in the market include Axens, Honeywell International Inc, Jiangsu Jingjing New Material Co Ltd, Sorbead India, Devson Catalyst, Evonik Industries AG, Petrosadid, BASF SE, Dynamic Adsorbents Inc, Sumitomo Chemical Co Ltd , Huber Engineered Materials, KIN Filter Engineering Co Limited.
3. What are the main segments of the Alumina Market?
The market segments include Application, End-user Industry.
4. Can you provide details about the market size?
The market size is estimated to be USD 46.83 billion as of 2022.
5. What are some drivers contributing to market growth?
Increasing Concerns Related to Water Pollution by Fluorine; Gaining Significance in Pharmaceutical Industry.
6. What are the notable trends driving market growth?
Increased Demand from Oil and Gas Industry.
7. Are there any restraints impacting market growth?
Presence of Substitutes.
8. Can you provide examples of recent developments in the market?
February 2023: Evonik announced the investment in the expansion of its fumed aluminum oxide production plant in Yokkaichi, Japan. The facility will be the company's first alumina plant in Asia. It will focus on making solutions for lithium-ion battery technology, which is used in electric car batteries.The plant is expected to be operational by 2025.
9. What pricing options are available for accessing the report?
Pricing options include single-user, multi-user, and enterprise licenses priced at USD 4750, USD 5250, and USD 8750 respectively.
10. Is the market size provided in terms of value or volume?
The market size is provided in terms of value, measured in billion.
11. Are there any specific market keywords associated with the report?
Yes, the market keyword associated with the report is "Alumina Market," which aids in identifying and referencing the specific market segment covered.
12. How do I determine which pricing option suits my needs best?
The pricing options vary based on user requirements and access needs. Individual users may opt for single-user licenses, while businesses requiring broader access may choose multi-user or enterprise licenses for cost-effective access to the report.
13. Are there any additional resources or data provided in the Alumina Market report?
While the report offers comprehensive insights, it's advisable to review the specific contents or supplementary materials provided to ascertain if additional resources or data are available.
14. How can I stay updated on further developments or reports in the Alumina Market?
To stay informed about further developments, trends, and reports in the Alumina Market, consider subscribing to industry newsletters, following relevant companies and organizations, or regularly checking reputable industry news sources and publications.
Methodology
Step 1 - Identification of Relevant Samples Size from Population Database


Step 2 - Approaches for Defining Global Market Size (Value, Volume* & Price*)

Note*: In applicable scenarios
Step 3 - Data Sources
Primary Research
- Web Analytics
- Survey Reports
- Research Institute
- Latest Research Reports
- Opinion Leaders
Secondary Research
- Annual Reports
- White Paper
- Latest Press Release
- Industry Association
- Paid Database
- Investor Presentations

Step 4 - Data Triangulation
Involves using different sources of information in order to increase the validity of a study
These sources are likely to be stakeholders in a program - participants, other researchers, program staff, other community members, and so on.
Then we put all data in single framework & apply various statistical tools to find out the dynamic on the market.
During the analysis stage, feedback from the stakeholder groups would be compared to determine areas of agreement as well as areas of divergence