

Key Insights
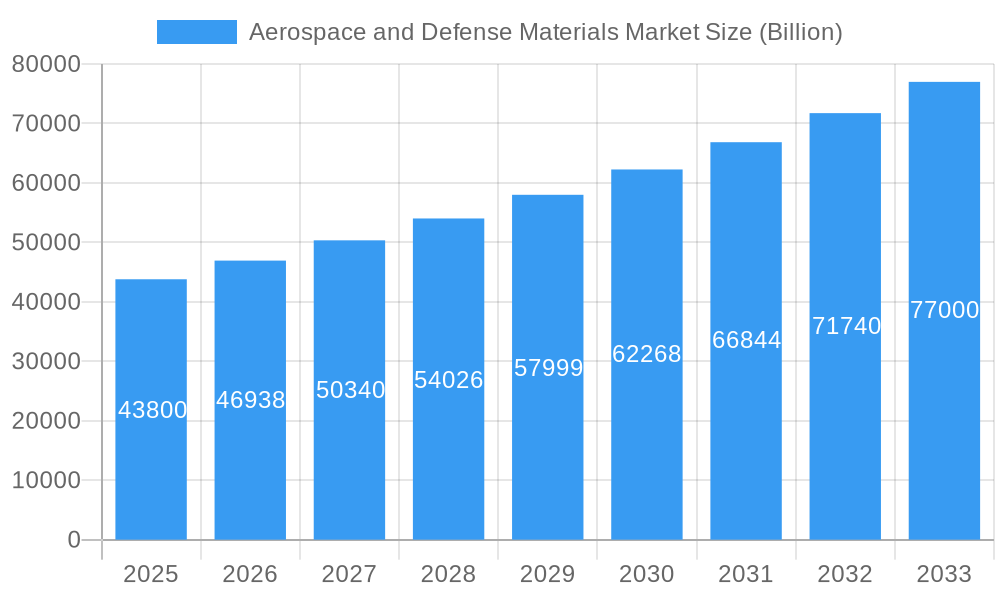
The Aerospace and Defense Materials market, valued at $43.8 billion in 2025, is projected to experience robust growth, driven by a Compound Annual Growth Rate (CAGR) of 7.08% from 2025 to 2033. This expansion is fueled by several key factors. Firstly, the increasing demand for advanced aircraft, particularly in the commercial aviation sector, necessitates lightweight, high-strength materials like aluminum and titanium alloys, and increasingly, composite materials. The ongoing modernization and technological advancements within military aircraft programs globally are another significant driver, leading to higher demand for specialized materials capable of withstanding extreme conditions. Furthermore, the growing focus on fuel efficiency and reduced carbon emissions in the aerospace industry is promoting the adoption of lighter-weight composite materials, further boosting market growth. While supply chain disruptions and fluctuating raw material prices pose some challenges, the long-term outlook remains positive, with continued investment in research and development leading to the innovation of even stronger, lighter, and more durable materials.
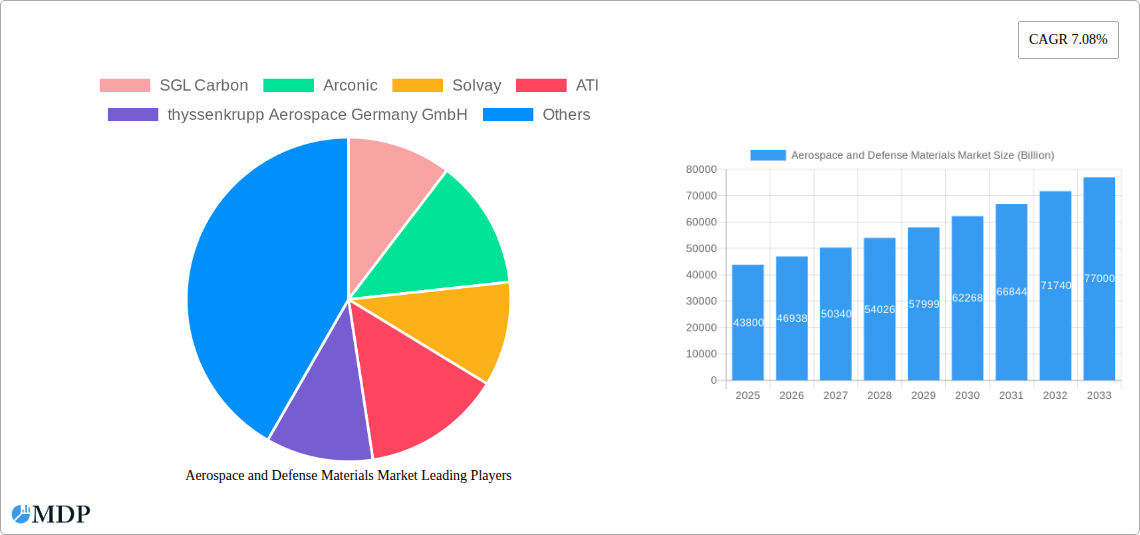
Aerospace and Defense Materials Market Market Size (In Billion)
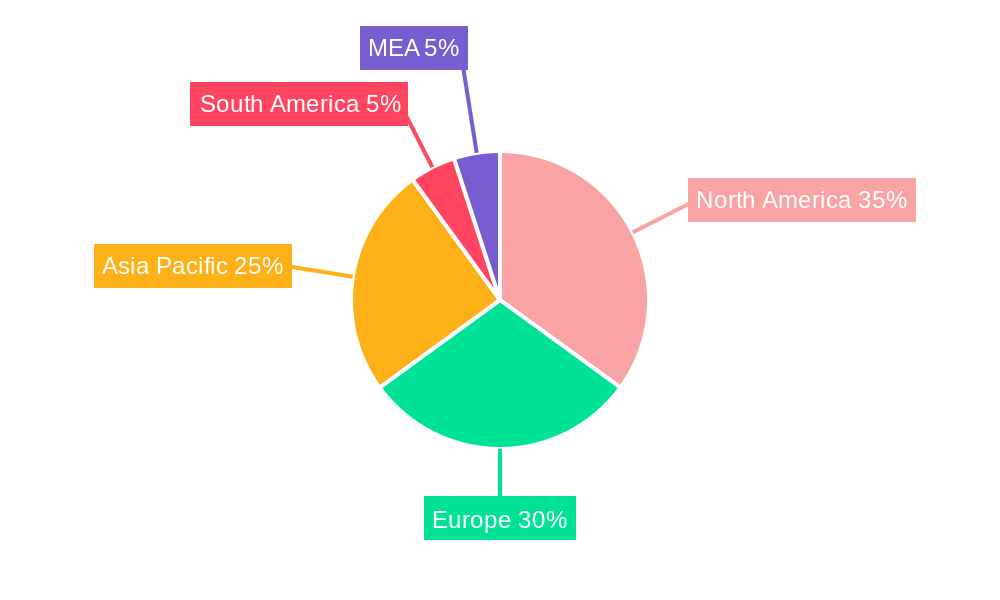
Market segmentation reveals significant opportunities across various material types and aircraft categories. Aluminum alloys currently dominate the market, followed by steel alloys and composites. However, the adoption of titanium alloys and super alloys is expected to increase due to their superior performance characteristics in demanding applications. Similarly, the commercial aircraft segment represents a substantial portion of the market, but growth in the military and business aviation sectors is anticipated to be particularly strong, driven by increased defense budgets and the rising demand for private jets. Geographically, North America and Europe are currently the largest markets, but the Asia-Pacific region is projected to witness significant growth in the forecast period, fueled by strong economic growth and substantial investment in aerospace infrastructure in countries like China and India. Competition within the market is intense, with major players including Arconic, Solvay, ATI, and others continuously innovating to enhance material performance and secure market share. The ongoing focus on sustainability and the development of eco-friendly materials are also shaping the competitive landscape.
Aerospace and Defense Materials Market Company Market Share
Soar to New Heights: A Comprehensive Analysis of the Aerospace and Defense Materials Market (2019-2033)
This in-depth report provides a comprehensive analysis of the Aerospace and Defense Materials Market, offering invaluable insights for stakeholders across the industry. Valued at xx Billion in 2025, the market is poised for significant growth, reaching xx Billion by 2033, exhibiting a CAGR of xx% during the forecast period (2025-2033). This report covers the historical period (2019-2024), with 2025 serving as the base year. Our analysis delves into market dynamics, industry trends, leading segments, and key players, equipping you with the strategic knowledge needed to navigate this dynamic landscape.
Aerospace and Defense Materials Market Market Dynamics & Concentration
The Aerospace and Defense Materials market is characterized by a moderate level of concentration, with a few major players holding significant market share. However, the market is also witnessing increased competition from smaller, specialized companies offering innovative materials and solutions. Market share fluctuations are driven by factors such as technological advancements, mergers and acquisitions (M&A), and fluctuating demand from the aerospace and defense sectors. The regulatory landscape, particularly concerning environmental regulations and safety standards, plays a crucial role in shaping market dynamics. Substitution with lighter, stronger, and more cost-effective materials is an ongoing trend. The market is further influenced by end-user trends towards fuel efficiency, improved performance, and reduced maintenance costs.
- Market Concentration: The top 5 players hold approximately xx% of the market share in 2025.
- Innovation Drivers: Lightweighting, enhanced durability, improved thermal resistance, and sustainable materials are key innovation drivers.
- M&A Activity: The market has witnessed xx M&A deals in the past five years, primarily driven by companies seeking to expand their product portfolios and geographic reach. For example, the acquisition of Aleris Corporation by Novelis Inc. in 2020 significantly reshaped the aluminum market.
- Regulatory Frameworks: Stringent safety and environmental regulations influence material selection and manufacturing processes.
- Product Substitutes: The emergence of advanced composite materials poses a competitive threat to traditional metal alloys.
- End-User Trends: The increasing demand for fuel-efficient aircraft and unmanned aerial vehicles (UAVs) is a significant market driver.
Aerospace and Defense Materials Market Industry Trends & Analysis
The Aerospace and Defense Materials market is experiencing robust growth, propelled by several key factors. The increasing demand for commercial and military aircraft, coupled with technological advancements in materials science, is driving market expansion. The shift towards lightweighting to enhance fuel efficiency and reduce operational costs is a significant trend. Furthermore, the growing adoption of composite materials in aircraft manufacturing is contributing to market growth. However, the market also faces challenges such as supply chain disruptions and fluctuating raw material prices. Competitive dynamics are intense, with established players and new entrants vying for market share through innovation, strategic partnerships, and M&A activities.
Leading Markets & Segments in Aerospace and Defense Materials Market
The North American region dominates the Aerospace and Defense Materials market, driven by strong defense spending and a large commercial aircraft manufacturing base. Within material types, Aluminum Alloys hold the largest market share, followed by Composite Materials. The Commercial Aircraft segment is the largest consumer of these materials, reflecting the burgeoning global air travel industry.
- Dominant Region: North America
- Dominant Material Type: Aluminum Alloys
- Dominant Aircraft Type: Commercial Aircraft
Key Drivers for North American Dominance:
- Strong defense spending and government support for aerospace research and development.
- Presence of major aircraft manufacturers like Boeing and Airbus.
- Well-established supply chain and infrastructure.
Key Drivers for Aluminum Alloy Dominance:
- Cost-effectiveness compared to other materials
- Established manufacturing processes
- Suitability for various aircraft components.
Key Drivers for Commercial Aircraft Segment Dominance:
- Steady growth in passenger air travel
- Increasing demand for fuel-efficient aircraft
Aerospace and Defense Materials Market Product Developments
Recent years have witnessed significant advancements in aerospace and defense materials. The focus is on developing lighter, stronger, and more durable materials with enhanced thermal resistance and improved corrosion resistance. This includes advancements in composite materials, high-strength alloys, and innovative manufacturing processes such as additive manufacturing. These developments are aimed at improving aircraft performance, reducing fuel consumption, and enhancing safety. The successful integration of these advanced materials is critical for gaining a competitive edge in the market.
Key Drivers of Aerospace and Defense Materials Market Growth
Several key factors are driving the growth of the Aerospace and Defense Materials market. Technological advancements, such as the development of advanced composites and lightweight alloys, are enabling the creation of more fuel-efficient and high-performance aircraft. Increased defense spending by governments globally is also boosting market demand. Furthermore, supportive government policies and regulations are creating a favorable environment for market expansion. Finally, the increasing demand for commercial aircraft to accommodate growing air travel is a significant growth driver.
Challenges in the Aerospace and Defense Materials Market Market
The Aerospace and Defense Materials market faces several challenges. Supply chain disruptions, particularly concerning raw materials, can impact production and increase costs. Stringent safety and regulatory requirements can increase the cost and complexity of product development and approval. Intense competition from established players and new entrants creates pressure on pricing and profitability. These factors can constrain market growth if not adequately addressed. The estimated impact of these challenges on market growth is a reduction of approximately xx% by 2033.
Emerging Opportunities in Aerospace and Defense Materials Market
The Aerospace and Defense Materials market offers several promising opportunities. Advancements in additive manufacturing and the development of bio-based materials present potential for cost reduction and enhanced performance. Strategic partnerships between materials suppliers and aircraft manufacturers can foster innovation and accelerate product development. Expansion into emerging markets with growing aerospace industries offers significant growth potential.
Leading Players in the Aerospace and Defense Materials Market Sector
Key Milestones in Aerospace and Defense Materials Industry
- August 2019: Teijin Limited acquired Renegade Materials Corporation, expanding its presence in high-temperature prepreg materials. This acquisition strengthened Teijin's position in the aerospace composites market.
- April 2020: Novelis Inc. completed its acquisition of Aleris Corporation, consolidating its position as a leading aluminum supplier to the aerospace industry. This merger significantly impacted the aluminum alloys segment.
Strategic Outlook for Aerospace and Defense Materials Market Market
The Aerospace and Defense Materials market is poised for continued growth, driven by technological advancements, increasing demand from both commercial and military sectors, and supportive government policies. Companies that invest in research and development, focus on sustainability, and forge strategic partnerships will be well-positioned to capitalize on future opportunities. The market's long-term outlook is positive, with significant potential for expansion in both developed and emerging economies.
Aerospace and Defense Materials Market Segmentation
-
1. Material Type
- 1.1. Aluminum Alloys
- 1.2. Steel Alloys
- 1.3. Titanium Alloys
- 1.4. Super Alloys
- 1.5. Composite Materials
- 1.6. Other Material Types
-
2. Aircraft Type
- 2.1. Commercial
- 2.2. Military
- 2.3. Business and General Aviation
- 2.4. Other Aircraft Types
Aerospace and Defense Materials Market Segmentation By Geography
-
1. Asia Pacific
- 1.1. China
- 1.2. India
- 1.3. Japan
- 1.4. South Korea
- 1.5. Rest of Asia Pacific
-
2. North America
- 2.1. United States
- 2.2. Canada
- 2.3. Mexico
-
3. Europe
- 3.1. Germany
- 3.2. United Kingdom
- 3.3. Italy
- 3.4. France
- 3.5. Rest of Europe
-
4. South America
- 4.1. Brazil
- 4.2. Argentina
- 4.3. Rest of South America
-
5. Middle East and Africa
- 5.1. Saudi Arabia
- 5.2. South Africa
- 5.3. Rest of Middle East and Africa
Aerospace and Defense Materials Market Regional Market Share
Geographic Coverage of Aerospace and Defense Materials Market
Aerospace and Defense Materials Market REPORT HIGHLIGHTS
| Aspects | Details |
|---|---|
| Study Period | 2020-2034 |
| Base Year | 2025 |
| Estimated Year | 2026 |
| Forecast Period | 2026-2034 |
| Historical Period | 2020-2025 |
| Growth Rate | CAGR of 7.08% from 2020-2034 |
| Segmentation |
|
Table of Contents
- 1. Introduction
- 1.1. Research Scope
- 1.2. Market Segmentation
- 1.3. Research Objective
- 1.4. Definitions and Assumptions
- 2. Executive Summary
- 2.1. Market Snapshot
- 3. Market Dynamics
- 3.1. Market Drivers
- 3.2. Market Restrains
- 3.3. Market Trends
- 3.4. Market Opportunities
- 4. Market Factor Analysis
- 4.1. Porters Five Forces
- 4.1.1. Bargaining Power of Suppliers
- 4.1.2. Bargaining Power of Buyers
- 4.1.3. Threat of New Entrants
- 4.1.4. Threat of Substitutes
- 4.1.5. Competitive Rivalry
- 4.2. PESTEL analysis
- 4.3. BCG Analysis
- 4.3.1. Stars (High Growth, High Market Share)
- 4.3.2. Cash Cows (Low Growth, High Market Share)
- 4.3.3. Question Mark (High Growth, Low Market Share)
- 4.3.4. Dogs (Low Growth, Low Market Share)
- 4.4. Ansoff Matrix Analysis
- 4.5. Supply Chain Analysis
- 4.6. Regulatory Landscape
- 4.7. Current Market Potential and Opportunity Assessment (TAM–SAM–SOM Framework)
- 4.8. MDP Analyst Note
- 4.1. Porters Five Forces
- 5. Market Analysis, Insights and Forecast 2021-2033
- 5.1. Market Analysis, Insights and Forecast - by Material Type
- 5.1.1. Aluminum Alloys
- 5.1.2. Steel Alloys
- 5.1.3. Titanium Alloys
- 5.1.4. Super Alloys
- 5.1.5. Composite Materials
- 5.1.6. Other Material Types
- 5.2. Market Analysis, Insights and Forecast - by Aircraft Type
- 5.2.1. Commercial
- 5.2.2. Military
- 5.2.3. Business and General Aviation
- 5.2.4. Other Aircraft Types
- 5.3. Market Analysis, Insights and Forecast - by Region
- 5.3.1. Asia Pacific
- 5.3.2. North America
- 5.3.3. Europe
- 5.3.4. South America
- 5.3.5. Middle East and Africa
- 5.1. Market Analysis, Insights and Forecast - by Material Type
- 6. Global Aerospace and Defense Materials Market Analysis, Insights and Forecast, 2021-2033
- 6.1. Market Analysis, Insights and Forecast - by Material Type
- 6.1.1. Aluminum Alloys
- 6.1.2. Steel Alloys
- 6.1.3. Titanium Alloys
- 6.1.4. Super Alloys
- 6.1.5. Composite Materials
- 6.1.6. Other Material Types
- 6.2. Market Analysis, Insights and Forecast - by Aircraft Type
- 6.2.1. Commercial
- 6.2.2. Military
- 6.2.3. Business and General Aviation
- 6.2.4. Other Aircraft Types
- 6.1. Market Analysis, Insights and Forecast - by Material Type
- 7. Asia Pacific Aerospace and Defense Materials Market Analysis, Insights and Forecast, 2020-2032
- 7.1. Market Analysis, Insights and Forecast - by Material Type
- 7.1.1. Aluminum Alloys
- 7.1.2. Steel Alloys
- 7.1.3. Titanium Alloys
- 7.1.4. Super Alloys
- 7.1.5. Composite Materials
- 7.1.6. Other Material Types
- 7.2. Market Analysis, Insights and Forecast - by Aircraft Type
- 7.2.1. Commercial
- 7.2.2. Military
- 7.2.3. Business and General Aviation
- 7.2.4. Other Aircraft Types
- 7.1. Market Analysis, Insights and Forecast - by Material Type
- 8. North America Aerospace and Defense Materials Market Analysis, Insights and Forecast, 2020-2032
- 8.1. Market Analysis, Insights and Forecast - by Material Type
- 8.1.1. Aluminum Alloys
- 8.1.2. Steel Alloys
- 8.1.3. Titanium Alloys
- 8.1.4. Super Alloys
- 8.1.5. Composite Materials
- 8.1.6. Other Material Types
- 8.2. Market Analysis, Insights and Forecast - by Aircraft Type
- 8.2.1. Commercial
- 8.2.2. Military
- 8.2.3. Business and General Aviation
- 8.2.4. Other Aircraft Types
- 8.1. Market Analysis, Insights and Forecast - by Material Type
- 9. Europe Aerospace and Defense Materials Market Analysis, Insights and Forecast, 2020-2032
- 9.1. Market Analysis, Insights and Forecast - by Material Type
- 9.1.1. Aluminum Alloys
- 9.1.2. Steel Alloys
- 9.1.3. Titanium Alloys
- 9.1.4. Super Alloys
- 9.1.5. Composite Materials
- 9.1.6. Other Material Types
- 9.2. Market Analysis, Insights and Forecast - by Aircraft Type
- 9.2.1. Commercial
- 9.2.2. Military
- 9.2.3. Business and General Aviation
- 9.2.4. Other Aircraft Types
- 9.1. Market Analysis, Insights and Forecast - by Material Type
- 10. South America Aerospace and Defense Materials Market Analysis, Insights and Forecast, 2020-2032
- 10.1. Market Analysis, Insights and Forecast - by Material Type
- 10.1.1. Aluminum Alloys
- 10.1.2. Steel Alloys
- 10.1.3. Titanium Alloys
- 10.1.4. Super Alloys
- 10.1.5. Composite Materials
- 10.1.6. Other Material Types
- 10.2. Market Analysis, Insights and Forecast - by Aircraft Type
- 10.2.1. Commercial
- 10.2.2. Military
- 10.2.3. Business and General Aviation
- 10.2.4. Other Aircraft Types
- 10.1. Market Analysis, Insights and Forecast - by Material Type
- 11. Middle East and Africa Aerospace and Defense Materials Market Analysis, Insights and Forecast, 2020-2032
- 11.1. Market Analysis, Insights and Forecast - by Material Type
- 11.1.1. Aluminum Alloys
- 11.1.2. Steel Alloys
- 11.1.3. Titanium Alloys
- 11.1.4. Super Alloys
- 11.1.5. Composite Materials
- 11.1.6. Other Material Types
- 11.2. Market Analysis, Insights and Forecast - by Aircraft Type
- 11.2.1. Commercial
- 11.2.2. Military
- 11.2.3. Business and General Aviation
- 11.2.4. Other Aircraft Types
- 11.1. Market Analysis, Insights and Forecast - by Material Type
- 12. Competitive Analysis
- 12.1. Company Profiles
- 12.1.1 SGL Carbon
- 12.1.1.1. Company Overview
- 12.1.1.2. Products
- 12.1.1.3. Company Financials
- 12.1.1.4. SWOT Analysis
- 12.1.2 Arconic
- 12.1.2.1. Company Overview
- 12.1.2.2. Products
- 12.1.2.3. Company Financials
- 12.1.2.4. SWOT Analysis
- 12.1.3 Solvay
- 12.1.3.1. Company Overview
- 12.1.3.2. Products
- 12.1.3.3. Company Financials
- 12.1.3.4. SWOT Analysis
- 12.1.4 ATI
- 12.1.4.1. Company Overview
- 12.1.4.2. Products
- 12.1.4.3. Company Financials
- 12.1.4.4. SWOT Analysis
- 12.1.5 thyssenkrupp Aerospace Germany GmbH
- 12.1.5.1. Company Overview
- 12.1.5.2. Products
- 12.1.5.3. Company Financials
- 12.1.5.4. SWOT Analysis
- 12.1.6 Teijin Carbon Europe GmbH
- 12.1.6.1. Company Overview
- 12.1.6.2. Products
- 12.1.6.3. Company Financials
- 12.1.6.4. SWOT Analysis
- 12.1.7 TORAY INDUSTRIES INC
- 12.1.7.1. Company Overview
- 12.1.7.2. Products
- 12.1.7.3. Company Financials
- 12.1.7.4. SWOT Analysis
- 12.1.8 Novelis Inc
- 12.1.8.1. Company Overview
- 12.1.8.2. Products
- 12.1.8.3. Company Financials
- 12.1.8.4. SWOT Analysis
- 12.1.9 Hexcel Corporation
- 12.1.9.1. Company Overview
- 12.1.9.2. Products
- 12.1.9.3. Company Financials
- 12.1.9.4. SWOT Analysis
- 12.1.10 Constellium
- 12.1.10.1. Company Overview
- 12.1.10.2. Products
- 12.1.10.3. Company Financials
- 12.1.10.4. SWOT Analysis
- 12.1.11 Alcoa Corporation
- 12.1.11.1. Company Overview
- 12.1.11.2. Products
- 12.1.11.3. Company Financials
- 12.1.11.4. SWOT Analysis
- 12.1.1 SGL Carbon
- 12.2. Market Entropy
- 12.2.1 Company's Key Areas Served
- 12.2.2 Recent Developments
- 12.3. Company Market Share Analysis 2025
- 12.3.1 Top 5 Companies Market Share Analysis
- 12.3.2 Top 3 Companies Market Share Analysis
- 12.4. List of Potential Customers
- 13. Research Methodology
List of Figures
- Figure 1: Global Aerospace and Defense Materials Market Revenue Breakdown (Billion, %) by Region 2025 & 2033
- Figure 2: Global Aerospace and Defense Materials Market Volume Breakdown (K Tons, %) by Region 2025 & 2033
- Figure 3: Asia Pacific Aerospace and Defense Materials Market Revenue (Billion), by Material Type 2025 & 2033
- Figure 4: Asia Pacific Aerospace and Defense Materials Market Volume (K Tons), by Material Type 2025 & 2033
- Figure 5: Asia Pacific Aerospace and Defense Materials Market Revenue Share (%), by Material Type 2025 & 2033
- Figure 6: Asia Pacific Aerospace and Defense Materials Market Volume Share (%), by Material Type 2025 & 2033
- Figure 7: Asia Pacific Aerospace and Defense Materials Market Revenue (Billion), by Aircraft Type 2025 & 2033
- Figure 8: Asia Pacific Aerospace and Defense Materials Market Volume (K Tons), by Aircraft Type 2025 & 2033
- Figure 9: Asia Pacific Aerospace and Defense Materials Market Revenue Share (%), by Aircraft Type 2025 & 2033
- Figure 10: Asia Pacific Aerospace and Defense Materials Market Volume Share (%), by Aircraft Type 2025 & 2033
- Figure 11: Asia Pacific Aerospace and Defense Materials Market Revenue (Billion), by Country 2025 & 2033
- Figure 12: Asia Pacific Aerospace and Defense Materials Market Volume (K Tons), by Country 2025 & 2033
- Figure 13: Asia Pacific Aerospace and Defense Materials Market Revenue Share (%), by Country 2025 & 2033
- Figure 14: Asia Pacific Aerospace and Defense Materials Market Volume Share (%), by Country 2025 & 2033
- Figure 15: North America Aerospace and Defense Materials Market Revenue (Billion), by Material Type 2025 & 2033
- Figure 16: North America Aerospace and Defense Materials Market Volume (K Tons), by Material Type 2025 & 2033
- Figure 17: North America Aerospace and Defense Materials Market Revenue Share (%), by Material Type 2025 & 2033
- Figure 18: North America Aerospace and Defense Materials Market Volume Share (%), by Material Type 2025 & 2033
- Figure 19: North America Aerospace and Defense Materials Market Revenue (Billion), by Aircraft Type 2025 & 2033
- Figure 20: North America Aerospace and Defense Materials Market Volume (K Tons), by Aircraft Type 2025 & 2033
- Figure 21: North America Aerospace and Defense Materials Market Revenue Share (%), by Aircraft Type 2025 & 2033
- Figure 22: North America Aerospace and Defense Materials Market Volume Share (%), by Aircraft Type 2025 & 2033
- Figure 23: North America Aerospace and Defense Materials Market Revenue (Billion), by Country 2025 & 2033
- Figure 24: North America Aerospace and Defense Materials Market Volume (K Tons), by Country 2025 & 2033
- Figure 25: North America Aerospace and Defense Materials Market Revenue Share (%), by Country 2025 & 2033
- Figure 26: North America Aerospace and Defense Materials Market Volume Share (%), by Country 2025 & 2033
- Figure 27: Europe Aerospace and Defense Materials Market Revenue (Billion), by Material Type 2025 & 2033
- Figure 28: Europe Aerospace and Defense Materials Market Volume (K Tons), by Material Type 2025 & 2033
- Figure 29: Europe Aerospace and Defense Materials Market Revenue Share (%), by Material Type 2025 & 2033
- Figure 30: Europe Aerospace and Defense Materials Market Volume Share (%), by Material Type 2025 & 2033
- Figure 31: Europe Aerospace and Defense Materials Market Revenue (Billion), by Aircraft Type 2025 & 2033
- Figure 32: Europe Aerospace and Defense Materials Market Volume (K Tons), by Aircraft Type 2025 & 2033
- Figure 33: Europe Aerospace and Defense Materials Market Revenue Share (%), by Aircraft Type 2025 & 2033
- Figure 34: Europe Aerospace and Defense Materials Market Volume Share (%), by Aircraft Type 2025 & 2033
- Figure 35: Europe Aerospace and Defense Materials Market Revenue (Billion), by Country 2025 & 2033
- Figure 36: Europe Aerospace and Defense Materials Market Volume (K Tons), by Country 2025 & 2033
- Figure 37: Europe Aerospace and Defense Materials Market Revenue Share (%), by Country 2025 & 2033
- Figure 38: Europe Aerospace and Defense Materials Market Volume Share (%), by Country 2025 & 2033
- Figure 39: South America Aerospace and Defense Materials Market Revenue (Billion), by Material Type 2025 & 2033
- Figure 40: South America Aerospace and Defense Materials Market Volume (K Tons), by Material Type 2025 & 2033
- Figure 41: South America Aerospace and Defense Materials Market Revenue Share (%), by Material Type 2025 & 2033
- Figure 42: South America Aerospace and Defense Materials Market Volume Share (%), by Material Type 2025 & 2033
- Figure 43: South America Aerospace and Defense Materials Market Revenue (Billion), by Aircraft Type 2025 & 2033
- Figure 44: South America Aerospace and Defense Materials Market Volume (K Tons), by Aircraft Type 2025 & 2033
- Figure 45: South America Aerospace and Defense Materials Market Revenue Share (%), by Aircraft Type 2025 & 2033
- Figure 46: South America Aerospace and Defense Materials Market Volume Share (%), by Aircraft Type 2025 & 2033
- Figure 47: South America Aerospace and Defense Materials Market Revenue (Billion), by Country 2025 & 2033
- Figure 48: South America Aerospace and Defense Materials Market Volume (K Tons), by Country 2025 & 2033
- Figure 49: South America Aerospace and Defense Materials Market Revenue Share (%), by Country 2025 & 2033
- Figure 50: South America Aerospace and Defense Materials Market Volume Share (%), by Country 2025 & 2033
- Figure 51: Middle East and Africa Aerospace and Defense Materials Market Revenue (Billion), by Material Type 2025 & 2033
- Figure 52: Middle East and Africa Aerospace and Defense Materials Market Volume (K Tons), by Material Type 2025 & 2033
- Figure 53: Middle East and Africa Aerospace and Defense Materials Market Revenue Share (%), by Material Type 2025 & 2033
- Figure 54: Middle East and Africa Aerospace and Defense Materials Market Volume Share (%), by Material Type 2025 & 2033
- Figure 55: Middle East and Africa Aerospace and Defense Materials Market Revenue (Billion), by Aircraft Type 2025 & 2033
- Figure 56: Middle East and Africa Aerospace and Defense Materials Market Volume (K Tons), by Aircraft Type 2025 & 2033
- Figure 57: Middle East and Africa Aerospace and Defense Materials Market Revenue Share (%), by Aircraft Type 2025 & 2033
- Figure 58: Middle East and Africa Aerospace and Defense Materials Market Volume Share (%), by Aircraft Type 2025 & 2033
- Figure 59: Middle East and Africa Aerospace and Defense Materials Market Revenue (Billion), by Country 2025 & 2033
- Figure 60: Middle East and Africa Aerospace and Defense Materials Market Volume (K Tons), by Country 2025 & 2033
- Figure 61: Middle East and Africa Aerospace and Defense Materials Market Revenue Share (%), by Country 2025 & 2033
- Figure 62: Middle East and Africa Aerospace and Defense Materials Market Volume Share (%), by Country 2025 & 2033
List of Tables
- Table 1: Global Aerospace and Defense Materials Market Revenue Billion Forecast, by Material Type 2020 & 2033
- Table 2: Global Aerospace and Defense Materials Market Volume K Tons Forecast, by Material Type 2020 & 2033
- Table 3: Global Aerospace and Defense Materials Market Revenue Billion Forecast, by Aircraft Type 2020 & 2033
- Table 4: Global Aerospace and Defense Materials Market Volume K Tons Forecast, by Aircraft Type 2020 & 2033
- Table 5: Global Aerospace and Defense Materials Market Revenue Billion Forecast, by Region 2020 & 2033
- Table 6: Global Aerospace and Defense Materials Market Volume K Tons Forecast, by Region 2020 & 2033
- Table 7: Global Aerospace and Defense Materials Market Revenue Billion Forecast, by Material Type 2020 & 2033
- Table 8: Global Aerospace and Defense Materials Market Volume K Tons Forecast, by Material Type 2020 & 2033
- Table 9: Global Aerospace and Defense Materials Market Revenue Billion Forecast, by Aircraft Type 2020 & 2033
- Table 10: Global Aerospace and Defense Materials Market Volume K Tons Forecast, by Aircraft Type 2020 & 2033
- Table 11: Global Aerospace and Defense Materials Market Revenue Billion Forecast, by Country 2020 & 2033
- Table 12: Global Aerospace and Defense Materials Market Volume K Tons Forecast, by Country 2020 & 2033
- Table 13: China Aerospace and Defense Materials Market Revenue (Billion) Forecast, by Application 2020 & 2033
- Table 14: China Aerospace and Defense Materials Market Volume (K Tons) Forecast, by Application 2020 & 2033
- Table 15: India Aerospace and Defense Materials Market Revenue (Billion) Forecast, by Application 2020 & 2033
- Table 16: India Aerospace and Defense Materials Market Volume (K Tons) Forecast, by Application 2020 & 2033
- Table 17: Japan Aerospace and Defense Materials Market Revenue (Billion) Forecast, by Application 2020 & 2033
- Table 18: Japan Aerospace and Defense Materials Market Volume (K Tons) Forecast, by Application 2020 & 2033
- Table 19: South Korea Aerospace and Defense Materials Market Revenue (Billion) Forecast, by Application 2020 & 2033
- Table 20: South Korea Aerospace and Defense Materials Market Volume (K Tons) Forecast, by Application 2020 & 2033
- Table 21: Rest of Asia Pacific Aerospace and Defense Materials Market Revenue (Billion) Forecast, by Application 2020 & 2033
- Table 22: Rest of Asia Pacific Aerospace and Defense Materials Market Volume (K Tons) Forecast, by Application 2020 & 2033
- Table 23: Global Aerospace and Defense Materials Market Revenue Billion Forecast, by Material Type 2020 & 2033
- Table 24: Global Aerospace and Defense Materials Market Volume K Tons Forecast, by Material Type 2020 & 2033
- Table 25: Global Aerospace and Defense Materials Market Revenue Billion Forecast, by Aircraft Type 2020 & 2033
- Table 26: Global Aerospace and Defense Materials Market Volume K Tons Forecast, by Aircraft Type 2020 & 2033
- Table 27: Global Aerospace and Defense Materials Market Revenue Billion Forecast, by Country 2020 & 2033
- Table 28: Global Aerospace and Defense Materials Market Volume K Tons Forecast, by Country 2020 & 2033
- Table 29: United States Aerospace and Defense Materials Market Revenue (Billion) Forecast, by Application 2020 & 2033
- Table 30: United States Aerospace and Defense Materials Market Volume (K Tons) Forecast, by Application 2020 & 2033
- Table 31: Canada Aerospace and Defense Materials Market Revenue (Billion) Forecast, by Application 2020 & 2033
- Table 32: Canada Aerospace and Defense Materials Market Volume (K Tons) Forecast, by Application 2020 & 2033
- Table 33: Mexico Aerospace and Defense Materials Market Revenue (Billion) Forecast, by Application 2020 & 2033
- Table 34: Mexico Aerospace and Defense Materials Market Volume (K Tons) Forecast, by Application 2020 & 2033
- Table 35: Global Aerospace and Defense Materials Market Revenue Billion Forecast, by Material Type 2020 & 2033
- Table 36: Global Aerospace and Defense Materials Market Volume K Tons Forecast, by Material Type 2020 & 2033
- Table 37: Global Aerospace and Defense Materials Market Revenue Billion Forecast, by Aircraft Type 2020 & 2033
- Table 38: Global Aerospace and Defense Materials Market Volume K Tons Forecast, by Aircraft Type 2020 & 2033
- Table 39: Global Aerospace and Defense Materials Market Revenue Billion Forecast, by Country 2020 & 2033
- Table 40: Global Aerospace and Defense Materials Market Volume K Tons Forecast, by Country 2020 & 2033
- Table 41: Germany Aerospace and Defense Materials Market Revenue (Billion) Forecast, by Application 2020 & 2033
- Table 42: Germany Aerospace and Defense Materials Market Volume (K Tons) Forecast, by Application 2020 & 2033
- Table 43: United Kingdom Aerospace and Defense Materials Market Revenue (Billion) Forecast, by Application 2020 & 2033
- Table 44: United Kingdom Aerospace and Defense Materials Market Volume (K Tons) Forecast, by Application 2020 & 2033
- Table 45: Italy Aerospace and Defense Materials Market Revenue (Billion) Forecast, by Application 2020 & 2033
- Table 46: Italy Aerospace and Defense Materials Market Volume (K Tons) Forecast, by Application 2020 & 2033
- Table 47: France Aerospace and Defense Materials Market Revenue (Billion) Forecast, by Application 2020 & 2033
- Table 48: France Aerospace and Defense Materials Market Volume (K Tons) Forecast, by Application 2020 & 2033
- Table 49: Rest of Europe Aerospace and Defense Materials Market Revenue (Billion) Forecast, by Application 2020 & 2033
- Table 50: Rest of Europe Aerospace and Defense Materials Market Volume (K Tons) Forecast, by Application 2020 & 2033
- Table 51: Global Aerospace and Defense Materials Market Revenue Billion Forecast, by Material Type 2020 & 2033
- Table 52: Global Aerospace and Defense Materials Market Volume K Tons Forecast, by Material Type 2020 & 2033
- Table 53: Global Aerospace and Defense Materials Market Revenue Billion Forecast, by Aircraft Type 2020 & 2033
- Table 54: Global Aerospace and Defense Materials Market Volume K Tons Forecast, by Aircraft Type 2020 & 2033
- Table 55: Global Aerospace and Defense Materials Market Revenue Billion Forecast, by Country 2020 & 2033
- Table 56: Global Aerospace and Defense Materials Market Volume K Tons Forecast, by Country 2020 & 2033
- Table 57: Brazil Aerospace and Defense Materials Market Revenue (Billion) Forecast, by Application 2020 & 2033
- Table 58: Brazil Aerospace and Defense Materials Market Volume (K Tons) Forecast, by Application 2020 & 2033
- Table 59: Argentina Aerospace and Defense Materials Market Revenue (Billion) Forecast, by Application 2020 & 2033
- Table 60: Argentina Aerospace and Defense Materials Market Volume (K Tons) Forecast, by Application 2020 & 2033
- Table 61: Rest of South America Aerospace and Defense Materials Market Revenue (Billion) Forecast, by Application 2020 & 2033
- Table 62: Rest of South America Aerospace and Defense Materials Market Volume (K Tons) Forecast, by Application 2020 & 2033
- Table 63: Global Aerospace and Defense Materials Market Revenue Billion Forecast, by Material Type 2020 & 2033
- Table 64: Global Aerospace and Defense Materials Market Volume K Tons Forecast, by Material Type 2020 & 2033
- Table 65: Global Aerospace and Defense Materials Market Revenue Billion Forecast, by Aircraft Type 2020 & 2033
- Table 66: Global Aerospace and Defense Materials Market Volume K Tons Forecast, by Aircraft Type 2020 & 2033
- Table 67: Global Aerospace and Defense Materials Market Revenue Billion Forecast, by Country 2020 & 2033
- Table 68: Global Aerospace and Defense Materials Market Volume K Tons Forecast, by Country 2020 & 2033
- Table 69: Saudi Arabia Aerospace and Defense Materials Market Revenue (Billion) Forecast, by Application 2020 & 2033
- Table 70: Saudi Arabia Aerospace and Defense Materials Market Volume (K Tons) Forecast, by Application 2020 & 2033
- Table 71: South Africa Aerospace and Defense Materials Market Revenue (Billion) Forecast, by Application 2020 & 2033
- Table 72: South Africa Aerospace and Defense Materials Market Volume (K Tons) Forecast, by Application 2020 & 2033
- Table 73: Rest of Middle East and Africa Aerospace and Defense Materials Market Revenue (Billion) Forecast, by Application 2020 & 2033
- Table 74: Rest of Middle East and Africa Aerospace and Defense Materials Market Volume (K Tons) Forecast, by Application 2020 & 2033
Frequently Asked Questions
1. What is the projected Compound Annual Growth Rate (CAGR) of the Aerospace and Defense Materials Market?
The projected CAGR is approximately 7.08%.
2. Which companies are prominent players in the Aerospace and Defense Materials Market?
Key companies in the market include SGL Carbon, Arconic, Solvay, ATI, thyssenkrupp Aerospace Germany GmbH, Teijin Carbon Europe GmbH, TORAY INDUSTRIES INC, Novelis Inc, Hexcel Corporation, Constellium, Alcoa Corporation.
3. What are the main segments of the Aerospace and Defense Materials Market?
The market segments include Material Type, Aircraft Type.
4. Can you provide details about the market size?
The market size is estimated to be USD 43.8 Billion as of 2022.
5. What are some drivers contributing to market growth?
Increasing Demand for Aircraft in Asia-Pacific and the Middle East; Other Drivers.
6. What are the notable trends driving market growth?
Increasing Demand for the Commercial Aircraft Segment.
7. Are there any restraints impacting market growth?
Unfavorable Conditions Arising Due to the COVID-19 Outbreak; Other Restraints.
8. Can you provide examples of recent developments in the market?
In April 2020, Novelis Inc., the world leader in aluminum rolling and recycling, announced the completion of its acquisition of Aleris Corporation, a global supplier of rolled aluminum products.
9. What pricing options are available for accessing the report?
Pricing options include single-user, multi-user, and enterprise licenses priced at USD 4750, USD 5250, and USD 8750 respectively.
10. Is the market size provided in terms of value or volume?
The market size is provided in terms of value, measured in Billion and volume, measured in K Tons.
11. Are there any specific market keywords associated with the report?
Yes, the market keyword associated with the report is "Aerospace and Defense Materials Market," which aids in identifying and referencing the specific market segment covered.
12. How do I determine which pricing option suits my needs best?
The pricing options vary based on user requirements and access needs. Individual users may opt for single-user licenses, while businesses requiring broader access may choose multi-user or enterprise licenses for cost-effective access to the report.
13. Are there any additional resources or data provided in the Aerospace and Defense Materials Market report?
While the report offers comprehensive insights, it's advisable to review the specific contents or supplementary materials provided to ascertain if additional resources or data are available.
14. How can I stay updated on further developments or reports in the Aerospace and Defense Materials Market?
To stay informed about further developments, trends, and reports in the Aerospace and Defense Materials Market, consider subscribing to industry newsletters, following relevant companies and organizations, or regularly checking reputable industry news sources and publications.
Methodology
Step 1 - Identification of Relevant Samples Size from Population Database


Step 2 - Approaches for Defining Global Market Size (Value, Volume* & Price*)

Note*: In applicable scenarios
Step 3 - Data Sources
Primary Research
- Web Analytics
- Survey Reports
- Research Institute
- Latest Research Reports
- Opinion Leaders
Secondary Research
- Annual Reports
- White Paper
- Latest Press Release
- Industry Association
- Paid Database
- Investor Presentations

Step 4 - Data Triangulation
Involves using different sources of information in order to increase the validity of a study
These sources are likely to be stakeholders in a program - participants, other researchers, program staff, other community members, and so on.
Then we put all data in single framework & apply various statistical tools to find out the dynamic on the market.
During the analysis stage, feedback from the stakeholder groups would be compared to determine areas of agreement as well as areas of divergence