

Key Insights
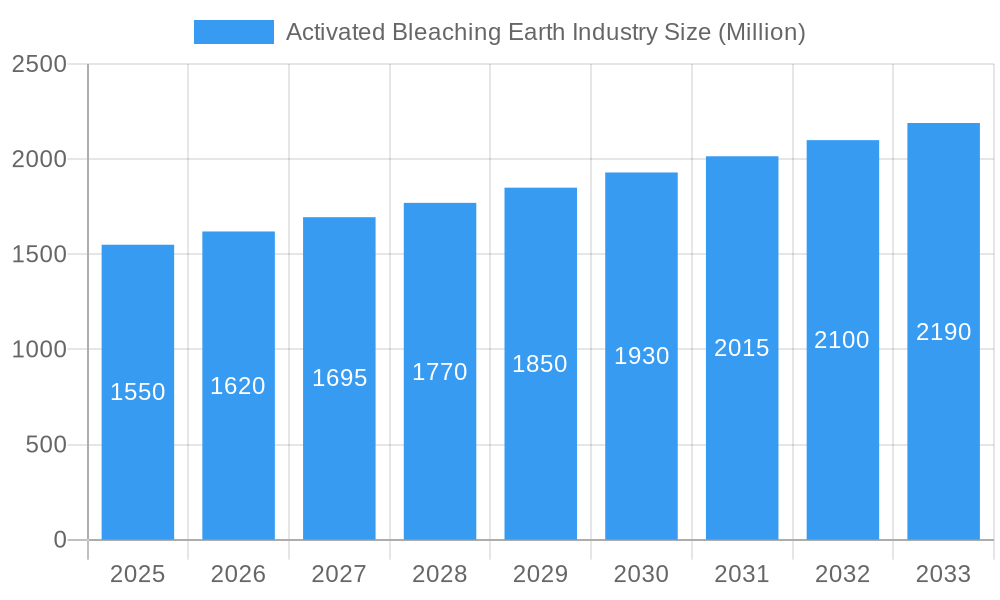
The global Activated Bleaching Earth market is projected for substantial growth, expected to reach a market size of 3091.2 million by 2025, with a CAGR of 5.2% from 2025 to 2033. This expansion is primarily attributed to escalating global demand for refined edible oils and fats, driven by population growth and increased disposable incomes in emerging economies. Activated bleaching earth is essential for purifying these oils, removing impurities, pigments, and odors, making it a vital component in food processing. Additionally, its growing use in mineral oil and lubricant refining, alongside increased interest in biodiesel production, fuels market expansion. Innovations in production, leading to improved efficacy and eco-friendly options, are also key growth drivers.
Activated Bleaching Earth Industry Market Size (In Billion)
Market restraints include fluctuating raw material costs, particularly bentonite clay, and competition from synthetic adsorbents. However, the cost-effectiveness and proven performance of activated bleaching earth in key applications are expected to mitigate these challenges. Asia Pacific is anticipated to lead the market, fueled by rapid industrialization, a robust food processing sector, and expanding refining capacities in China and India. North America and Europe are also significant markets, driven by strict edible oil quality standards and evolving lubricant industries. Market participants are focusing on strategic partnerships, capacity enhancements, and product innovation to meet diverse global demand.
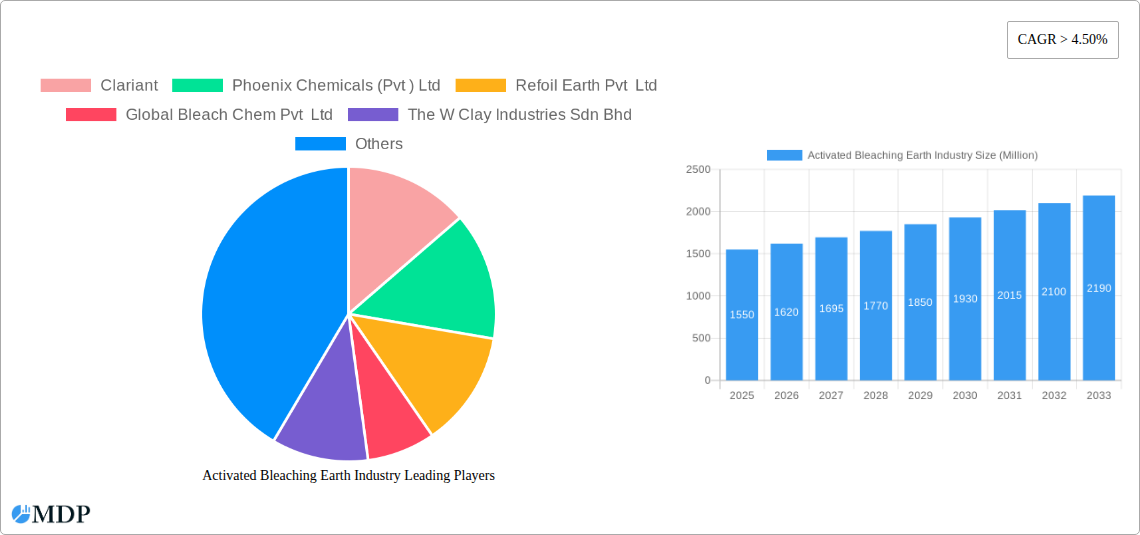
Activated Bleaching Earth Industry Company Market Share
Activated Bleaching Earth Industry: Comprehensive Market Analysis & Future Outlook (2019-2033)
Unlock critical insights into the global Activated Bleaching Earth market, a vital component for oil purification, fats refining, and lubricant production. This in-depth report provides an exhaustive analysis covering market dynamics, industry trends, leading segments, product innovations, growth drivers, challenges, emerging opportunities, competitive landscape, and key milestones. With data spanning from the historical period of 2019–2024 through the base year of 2025 and a robust forecast period of 2025–2033, this report equips industry stakeholders with actionable intelligence to navigate and capitalize on the evolving bentonite bleaching earth market. Leverage data-driven strategies for sustainable fuel production, biodiesel feedstock, and chemical processing applications.
Activated Bleaching Earth Industry Market Dynamics & Concentration
The global Activated Bleaching Earth market exhibits a moderate to high concentration, with a significant market share held by a few key players. Innovation drivers are primarily focused on enhancing adsorbent efficiency, developing eco-friendly production processes, and creating specialized grades for diverse applications. Regulatory frameworks, particularly concerning environmental impact and food safety standards, play a crucial role in shaping market entry and product development. Product substitutes, such as activated carbon and silica gel, present a competitive challenge, though Activated Bleaching Earth offers a cost-effective and highly efficient solution for many applications. End-user trends are increasingly leaning towards sustainability and improved product quality, driving demand for high-performance bleaching earth. Mergers and acquisitions (M&A) activities are strategic plays for market expansion and technology integration. For instance, recent M&A activities indicate consolidation to achieve economies of scale and enhance competitive positioning. The market share distribution reveals a dynamic landscape where established players maintain a strong foothold, while emerging companies focus on niche segments and technological advancements. The number of M&A deals in the historical period (2019-2024) has been steadily increasing, indicating a trend towards industry consolidation.
Activated Bleaching Earth Industry Industry Trends & Analysis
The Activated Bleaching Earth industry is poised for significant growth, driven by a confluence of factors spanning increasing global demand for refined edible oils, advancements in mineral oil processing, and the burgeoning renewable energy sector. The CAGR for the forecast period (2025-2033) is projected to be robust, fueled by evolving consumer preferences for healthier and higher-quality food products, which directly translate to increased demand for efficient refining agents. Technological disruptions are continuously reshaping the industry, with a focus on developing superior adsorption capabilities and more sustainable manufacturing processes. The shift towards sustainable aviation fuel (SAF) and other low-carbon transportation fuels is a major growth catalyst, as spent bleaching earth oil emerges as a valuable biofuels feedstock. Market penetration is deepening across developing economies, where industrialization and rising disposable incomes are boosting the consumption of refined products. Competitive dynamics are characterized by a blend of innovation, strategic partnerships, and a keen focus on cost-effectiveness. Companies are investing heavily in R&D to optimize the performance of their acid-activated clay offerings, ensuring compliance with stringent international standards and catering to specific end-user requirements. The increasing demand for non-GMO edible oils and the growing awareness regarding food safety further accentuate the importance of high-quality bleaching earth in the refining process. The industry is also witnessing a trend towards circular economy principles, with a growing emphasis on the regeneration and reuse of spent bleaching earth, thereby minimizing waste and enhancing sustainability credentials.
Leading Markets & Segments in Activated Bleaching Earth Industry
The Edible Oil and Fats segment dominates the global Activated Bleaching Earth market, driven by the ever-increasing worldwide consumption of cooking oils, margarines, and shortenings. Asia Pacific, particularly countries like India and China, represents a leading region due to its large population, burgeoning middle class, and significant agricultural output of oilseeds. Within this segment, key drivers include:
- Economic Policies: Government initiatives promoting domestic edible oil production and import substitution bolster demand.
- Infrastructure Development: Enhanced refining capacities and improved logistics networks facilitate wider distribution of processed edible oils.
- Consumer Preferences: Growing awareness of health and wellness fuels demand for refined, impurity-free edible oils.
The Mineral Oil and Lubricants segment holds substantial market share, owing to the critical role of Activated Bleaching Earth in purifying lubricating oils, transformer oils, and base oils. The demand is closely linked to the automotive, industrial machinery, and power generation sectors. Key drivers include:
- Industrial Growth: Expansion of manufacturing and automotive sectors necessitates a steady supply of high-quality lubricants.
- Technological Advancements: Development of advanced machinery requiring specialized, high-performance lubricants drives demand for efficient purification.
- Regulatory Standards: Increasingly stringent environmental regulations on emissions and lubricant performance necessitate superior oil refining.
The Other Applications segment, encompassing chemicals, biodiesel, and pharmaceuticals, is a rapidly growing area. The inclusion of chemical processing, biodiesel production, and the utilization of spent bleaching earth oil as a recognized biofuels feedstock are significant growth catalysts. Key drivers include:
- Renewable Energy Push: Global efforts to reduce carbon emissions and promote sustainable energy sources are driving the biodiesel market.
- Environmental Regulations: Mandates for cleaner fuels and industrial processes encourage the adoption of efficient refining agents.
- Innovation in Biodiesel: Advancements in biodiesel production technologies, particularly those utilizing waste oils, create new avenues for bleaching earth applications.
Activated Bleaching Earth Industry Product Developments
Recent product developments in the Activated Bleaching Earth industry are centered on enhancing adsorption capacity, improving selectivity for specific impurities, and developing more environmentally friendly processing methods. Innovations aim to offer superior decolorization and purification for a broader range of oils and fats, including those with challenging compositions. Companies are focusing on creating specialized grades tailored for niche applications within the mineral oil and lubricant sectors, ensuring optimal performance in high-temperature or high-pressure environments. The development of cost-effective and sustainable production techniques is also a key trend, addressing environmental concerns and improving market competitiveness.
Key Drivers of Activated Bleaching Earth Industry Growth
The Activated Bleaching Earth industry's growth is propelled by several key drivers. Economically, the rising global demand for refined edible oils, driven by population growth and increasing disposable incomes, forms a fundamental pillar. Technologically, advancements in refining processes and the growing importance of spent bleaching earth oil as a biofuels feedstock for low-carbon transportation fuels, including sustainable aviation fuel, are significant accelerators. Regulatory factors, such as stringent food safety standards and environmental mandates for cleaner industrial processes and fuels, further stimulate demand for efficient purification agents.
Challenges in the Activated Bleaching Earth Industry Market
Despite robust growth prospects, the Activated Bleaching Earth industry faces several challenges. Regulatory hurdles, particularly concerning the disposal of spent bleaching earth and its potential environmental impact, can pose complexities. Supply chain issues, including the availability and cost fluctuations of raw materials like bentonite clay, can affect production costs and market stability. Intense competitive pressures from both established players and potential substitutes like activated carbon necessitate continuous innovation and cost optimization. Furthermore, the energy-intensive nature of the bleaching earth activation process presents a challenge in terms of operational costs and environmental footprint.
Emerging Opportunities in Activated Bleaching Earth Industry
Emerging opportunities within the Activated Bleaching Earth industry are predominantly driven by the global push towards sustainability and renewable energy. The increasing demand for biofuels, especially sustainable aviation fuel, presents a significant opportunity as spent bleaching earth oil is a recognized feedstock. Technological breakthroughs in regeneration and reuse of spent bleaching earth can further enhance its economic viability and environmental profile. Strategic partnerships between bleaching earth manufacturers and biofuel producers, as well as companies involved in waste oil recycling, can unlock new market segments and drive innovation. Market expansion into untapped geographical regions with growing edible oil and lubricant consumption also offers considerable potential.
Leading Players in the Activated Bleaching Earth Industry Sector
- Clariant
- Phoenix Chemicals (Pvt ) Ltd
- Refoil Earth Pvt Ltd
- Global Bleach Chem Pvt Ltd
- The W Clay Industries Sdn Bhd
- Hrp Industries
- Ashapura Perfoclay Limited (APL)
- Shell Plc (ecooils Limited)
- Taiko Group of Companies (Taiko Bleaching Earth Sdn Bhd )
- Oil-dri Corporation of America
- Musim Mas Holdings Pte Ltd
- Indian Clay And Mineral Co
Key Milestones in Activated Bleaching Earth Industry Industry
- November 2022: Shell Eastern Petroleum (Pte) Ltd, a wholly-owned subsidiary of Shell PLC (Shell), acquired EcoOilsLimited (EcoOils), a waste oil recycling company. This acquisition is part of Shell's goal to enhance the production of low-carbon transportation fuels, particularly sustainable aviation fuel. EcoOilsMalaysia's subsidiaries and 90% of its Indonesian subsidiary will be acquired. EcoOils use recycling technology prevents waste from going to landfills and produces spent bleaching earth oil, an internationally recognized biofuels feedstock that can be used to produce low-carbon fuels.
- 2023: Introduction of new grades of Activated Bleaching Earth with enhanced adsorption capacities for specific applications in edible oil refining.
- 2024: Significant investment in R&D for developing more sustainable and energy-efficient activation processes for bleaching earth.
- 2025 (Estimated): Increased adoption of regenerated spent bleaching earth in various industrial applications, driven by cost and environmental benefits.
Strategic Outlook for Activated Bleaching Earth Industry Market
The strategic outlook for the Activated Bleaching Earth industry is highly promising, with growth accelerators focused on sustainability, technological innovation, and market diversification. The increasing demand for refined edible oils globally, coupled with the burgeoning renewable energy sector and the critical role of spent bleaching earth oil as a biofuels feedstock, presents substantial market potential. Companies are expected to invest further in R&D to develop advanced adsorbents with superior performance and environmental profiles. Strategic opportunities lie in forging stronger partnerships within the biofuel production value chain, expanding into emerging economies, and exploring novel applications in the chemical and pharmaceutical sectors. Embracing circular economy principles through efficient spent bleaching earth regeneration will be crucial for long-term success and market leadership.
Activated Bleaching Earth Industry Segmentation
-
1. Application
- 1.1. Edible Oil and Fats
- 1.2. Mineral Oil and Lubricants
- 1.3. Other Applications (Chemical, Biodiesel, etc.)
Activated Bleaching Earth Industry Segmentation By Geography
-
1. Asia Pacific
- 1.1. China
- 1.2. India
- 1.3. Japan
- 1.4. South Korea
- 1.5. Rest of Asia Pacific
-
2. North America
- 2.1. United States
- 2.2. Canada
- 2.3. Mexico
-
3. Europe
- 3.1. Germany
- 3.2. United Kingdom
- 3.3. Italy
- 3.4. France
- 3.5. Rest of Europe
-
4. South America
- 4.1. Brazil
- 4.2. Argentina
- 4.3. Rest of South America
-
5. Middle East and Africa
- 5.1. Saudi Arabia
- 5.2. South Africa
- 5.3. Rest of Middle East and Africa
Activated Bleaching Earth Industry Regional Market Share
Geographic Coverage of Activated Bleaching Earth Industry
Activated Bleaching Earth Industry REPORT HIGHLIGHTS
| Aspects | Details |
|---|---|
| Study Period | 2020-2034 |
| Base Year | 2025 |
| Estimated Year | 2026 |
| Forecast Period | 2026-2034 |
| Historical Period | 2020-2025 |
| Growth Rate | CAGR of 5.2% from 2020-2034 |
| Segmentation |
|
Table of Contents
- 1. Introduction
- 1.1. Research Scope
- 1.2. Market Segmentation
- 1.3. Research Objective
- 1.4. Definitions and Assumptions
- 2. Executive Summary
- 2.1. Market Snapshot
- 3. Market Dynamics
- 3.1. Market Drivers
- 3.2. Market Restrains
- 3.3. Market Trends
- 3.4. Market Opportunities
- 4. Market Factor Analysis
- 4.1. Porters Five Forces
- 4.1.1. Bargaining Power of Suppliers
- 4.1.2. Bargaining Power of Buyers
- 4.1.3. Threat of New Entrants
- 4.1.4. Threat of Substitutes
- 4.1.5. Competitive Rivalry
- 4.2. PESTEL analysis
- 4.3. BCG Analysis
- 4.3.1. Stars (High Growth, High Market Share)
- 4.3.2. Cash Cows (Low Growth, High Market Share)
- 4.3.3. Question Mark (High Growth, Low Market Share)
- 4.3.4. Dogs (Low Growth, Low Market Share)
- 4.4. Ansoff Matrix Analysis
- 4.5. Supply Chain Analysis
- 4.6. Regulatory Landscape
- 4.7. Current Market Potential and Opportunity Assessment (TAM–SAM–SOM Framework)
- 4.8. MDP Analyst Note
- 4.1. Porters Five Forces
- 5. Market Analysis, Insights and Forecast 2021-2033
- 5.1. Market Analysis, Insights and Forecast - by Application
- 5.1.1. Edible Oil and Fats
- 5.1.2. Mineral Oil and Lubricants
- 5.1.3. Other Applications (Chemical, Biodiesel, etc.)
- 5.2. Market Analysis, Insights and Forecast - by Region
- 5.2.1. Asia Pacific
- 5.2.2. North America
- 5.2.3. Europe
- 5.2.4. South America
- 5.2.5. Middle East and Africa
- 5.1. Market Analysis, Insights and Forecast - by Application
- 6. Global Activated Bleaching Earth Industry Analysis, Insights and Forecast, 2021-2033
- 6.1. Market Analysis, Insights and Forecast - by Application
- 6.1.1. Edible Oil and Fats
- 6.1.2. Mineral Oil and Lubricants
- 6.1.3. Other Applications (Chemical, Biodiesel, etc.)
- 6.1. Market Analysis, Insights and Forecast - by Application
- 7. Asia Pacific Activated Bleaching Earth Industry Analysis, Insights and Forecast, 2020-2032
- 7.1. Market Analysis, Insights and Forecast - by Application
- 7.1.1. Edible Oil and Fats
- 7.1.2. Mineral Oil and Lubricants
- 7.1.3. Other Applications (Chemical, Biodiesel, etc.)
- 7.1. Market Analysis, Insights and Forecast - by Application
- 8. North America Activated Bleaching Earth Industry Analysis, Insights and Forecast, 2020-2032
- 8.1. Market Analysis, Insights and Forecast - by Application
- 8.1.1. Edible Oil and Fats
- 8.1.2. Mineral Oil and Lubricants
- 8.1.3. Other Applications (Chemical, Biodiesel, etc.)
- 8.1. Market Analysis, Insights and Forecast - by Application
- 9. Europe Activated Bleaching Earth Industry Analysis, Insights and Forecast, 2020-2032
- 9.1. Market Analysis, Insights and Forecast - by Application
- 9.1.1. Edible Oil and Fats
- 9.1.2. Mineral Oil and Lubricants
- 9.1.3. Other Applications (Chemical, Biodiesel, etc.)
- 9.1. Market Analysis, Insights and Forecast - by Application
- 10. South America Activated Bleaching Earth Industry Analysis, Insights and Forecast, 2020-2032
- 10.1. Market Analysis, Insights and Forecast - by Application
- 10.1.1. Edible Oil and Fats
- 10.1.2. Mineral Oil and Lubricants
- 10.1.3. Other Applications (Chemical, Biodiesel, etc.)
- 10.1. Market Analysis, Insights and Forecast - by Application
- 11. Middle East and Africa Activated Bleaching Earth Industry Analysis, Insights and Forecast, 2020-2032
- 11.1. Market Analysis, Insights and Forecast - by Application
- 11.1.1. Edible Oil and Fats
- 11.1.2. Mineral Oil and Lubricants
- 11.1.3. Other Applications (Chemical, Biodiesel, etc.)
- 11.1. Market Analysis, Insights and Forecast - by Application
- 12. Competitive Analysis
- 12.1. Company Profiles
- 12.1.1 Clariant
- 12.1.1.1. Company Overview
- 12.1.1.2. Products
- 12.1.1.3. Company Financials
- 12.1.1.4. SWOT Analysis
- 12.1.2 Phoenix Chemicals (Pvt ) Ltd
- 12.1.2.1. Company Overview
- 12.1.2.2. Products
- 12.1.2.3. Company Financials
- 12.1.2.4. SWOT Analysis
- 12.1.3 Refoil Earth Pvt Ltd
- 12.1.3.1. Company Overview
- 12.1.3.2. Products
- 12.1.3.3. Company Financials
- 12.1.3.4. SWOT Analysis
- 12.1.4 Global Bleach Chem Pvt Ltd
- 12.1.4.1. Company Overview
- 12.1.4.2. Products
- 12.1.4.3. Company Financials
- 12.1.4.4. SWOT Analysis
- 12.1.5 The W Clay Industries Sdn Bhd
- 12.1.5.1. Company Overview
- 12.1.5.2. Products
- 12.1.5.3. Company Financials
- 12.1.5.4. SWOT Analysis
- 12.1.6 Hrp Industries
- 12.1.6.1. Company Overview
- 12.1.6.2. Products
- 12.1.6.3. Company Financials
- 12.1.6.4. SWOT Analysis
- 12.1.7 Ashapura Perfoclay Limited (APL)
- 12.1.7.1. Company Overview
- 12.1.7.2. Products
- 12.1.7.3. Company Financials
- 12.1.7.4. SWOT Analysis
- 12.1.8 Shell Plc (ecooils Limited)
- 12.1.8.1. Company Overview
- 12.1.8.2. Products
- 12.1.8.3. Company Financials
- 12.1.8.4. SWOT Analysis
- 12.1.9 Taiko Group of Companies (Taiko Bleaching Earth Sdn Bhd )
- 12.1.9.1. Company Overview
- 12.1.9.2. Products
- 12.1.9.3. Company Financials
- 12.1.9.4. SWOT Analysis
- 12.1.10 Oil-dri Corporation of America
- 12.1.10.1. Company Overview
- 12.1.10.2. Products
- 12.1.10.3. Company Financials
- 12.1.10.4. SWOT Analysis
- 12.1.11 Musim Mas Holdings Pte Ltd
- 12.1.11.1. Company Overview
- 12.1.11.2. Products
- 12.1.11.3. Company Financials
- 12.1.11.4. SWOT Analysis
- 12.1.12 Indian Clay And Mineral Co
- 12.1.12.1. Company Overview
- 12.1.12.2. Products
- 12.1.12.3. Company Financials
- 12.1.12.4. SWOT Analysis
- 12.1.1 Clariant
- 12.2. Market Entropy
- 12.2.1 Company's Key Areas Served
- 12.2.2 Recent Developments
- 12.3. Company Market Share Analysis 2025
- 12.3.1 Top 5 Companies Market Share Analysis
- 12.3.2 Top 3 Companies Market Share Analysis
- 12.4. List of Potential Customers
- 13. Research Methodology
List of Figures
- Figure 1: Global Activated Bleaching Earth Industry Revenue Breakdown (million, %) by Region 2025 & 2033
- Figure 2: Global Activated Bleaching Earth Industry Volume Breakdown (K Tons, %) by Region 2025 & 2033
- Figure 3: Asia Pacific Activated Bleaching Earth Industry Revenue (million), by Application 2025 & 2033
- Figure 4: Asia Pacific Activated Bleaching Earth Industry Volume (K Tons), by Application 2025 & 2033
- Figure 5: Asia Pacific Activated Bleaching Earth Industry Revenue Share (%), by Application 2025 & 2033
- Figure 6: Asia Pacific Activated Bleaching Earth Industry Volume Share (%), by Application 2025 & 2033
- Figure 7: Asia Pacific Activated Bleaching Earth Industry Revenue (million), by Country 2025 & 2033
- Figure 8: Asia Pacific Activated Bleaching Earth Industry Volume (K Tons), by Country 2025 & 2033
- Figure 9: Asia Pacific Activated Bleaching Earth Industry Revenue Share (%), by Country 2025 & 2033
- Figure 10: Asia Pacific Activated Bleaching Earth Industry Volume Share (%), by Country 2025 & 2033
- Figure 11: North America Activated Bleaching Earth Industry Revenue (million), by Application 2025 & 2033
- Figure 12: North America Activated Bleaching Earth Industry Volume (K Tons), by Application 2025 & 2033
- Figure 13: North America Activated Bleaching Earth Industry Revenue Share (%), by Application 2025 & 2033
- Figure 14: North America Activated Bleaching Earth Industry Volume Share (%), by Application 2025 & 2033
- Figure 15: North America Activated Bleaching Earth Industry Revenue (million), by Country 2025 & 2033
- Figure 16: North America Activated Bleaching Earth Industry Volume (K Tons), by Country 2025 & 2033
- Figure 17: North America Activated Bleaching Earth Industry Revenue Share (%), by Country 2025 & 2033
- Figure 18: North America Activated Bleaching Earth Industry Volume Share (%), by Country 2025 & 2033
- Figure 19: Europe Activated Bleaching Earth Industry Revenue (million), by Application 2025 & 2033
- Figure 20: Europe Activated Bleaching Earth Industry Volume (K Tons), by Application 2025 & 2033
- Figure 21: Europe Activated Bleaching Earth Industry Revenue Share (%), by Application 2025 & 2033
- Figure 22: Europe Activated Bleaching Earth Industry Volume Share (%), by Application 2025 & 2033
- Figure 23: Europe Activated Bleaching Earth Industry Revenue (million), by Country 2025 & 2033
- Figure 24: Europe Activated Bleaching Earth Industry Volume (K Tons), by Country 2025 & 2033
- Figure 25: Europe Activated Bleaching Earth Industry Revenue Share (%), by Country 2025 & 2033
- Figure 26: Europe Activated Bleaching Earth Industry Volume Share (%), by Country 2025 & 2033
- Figure 27: South America Activated Bleaching Earth Industry Revenue (million), by Application 2025 & 2033
- Figure 28: South America Activated Bleaching Earth Industry Volume (K Tons), by Application 2025 & 2033
- Figure 29: South America Activated Bleaching Earth Industry Revenue Share (%), by Application 2025 & 2033
- Figure 30: South America Activated Bleaching Earth Industry Volume Share (%), by Application 2025 & 2033
- Figure 31: South America Activated Bleaching Earth Industry Revenue (million), by Country 2025 & 2033
- Figure 32: South America Activated Bleaching Earth Industry Volume (K Tons), by Country 2025 & 2033
- Figure 33: South America Activated Bleaching Earth Industry Revenue Share (%), by Country 2025 & 2033
- Figure 34: South America Activated Bleaching Earth Industry Volume Share (%), by Country 2025 & 2033
- Figure 35: Middle East and Africa Activated Bleaching Earth Industry Revenue (million), by Application 2025 & 2033
- Figure 36: Middle East and Africa Activated Bleaching Earth Industry Volume (K Tons), by Application 2025 & 2033
- Figure 37: Middle East and Africa Activated Bleaching Earth Industry Revenue Share (%), by Application 2025 & 2033
- Figure 38: Middle East and Africa Activated Bleaching Earth Industry Volume Share (%), by Application 2025 & 2033
- Figure 39: Middle East and Africa Activated Bleaching Earth Industry Revenue (million), by Country 2025 & 2033
- Figure 40: Middle East and Africa Activated Bleaching Earth Industry Volume (K Tons), by Country 2025 & 2033
- Figure 41: Middle East and Africa Activated Bleaching Earth Industry Revenue Share (%), by Country 2025 & 2033
- Figure 42: Middle East and Africa Activated Bleaching Earth Industry Volume Share (%), by Country 2025 & 2033
List of Tables
- Table 1: Global Activated Bleaching Earth Industry Revenue million Forecast, by Application 2020 & 2033
- Table 2: Global Activated Bleaching Earth Industry Volume K Tons Forecast, by Application 2020 & 2033
- Table 3: Global Activated Bleaching Earth Industry Revenue million Forecast, by Region 2020 & 2033
- Table 4: Global Activated Bleaching Earth Industry Volume K Tons Forecast, by Region 2020 & 2033
- Table 5: Global Activated Bleaching Earth Industry Revenue million Forecast, by Application 2020 & 2033
- Table 6: Global Activated Bleaching Earth Industry Volume K Tons Forecast, by Application 2020 & 2033
- Table 7: Global Activated Bleaching Earth Industry Revenue million Forecast, by Country 2020 & 2033
- Table 8: Global Activated Bleaching Earth Industry Volume K Tons Forecast, by Country 2020 & 2033
- Table 9: China Activated Bleaching Earth Industry Revenue (million) Forecast, by Application 2020 & 2033
- Table 10: China Activated Bleaching Earth Industry Volume (K Tons) Forecast, by Application 2020 & 2033
- Table 11: India Activated Bleaching Earth Industry Revenue (million) Forecast, by Application 2020 & 2033
- Table 12: India Activated Bleaching Earth Industry Volume (K Tons) Forecast, by Application 2020 & 2033
- Table 13: Japan Activated Bleaching Earth Industry Revenue (million) Forecast, by Application 2020 & 2033
- Table 14: Japan Activated Bleaching Earth Industry Volume (K Tons) Forecast, by Application 2020 & 2033
- Table 15: South Korea Activated Bleaching Earth Industry Revenue (million) Forecast, by Application 2020 & 2033
- Table 16: South Korea Activated Bleaching Earth Industry Volume (K Tons) Forecast, by Application 2020 & 2033
- Table 17: Rest of Asia Pacific Activated Bleaching Earth Industry Revenue (million) Forecast, by Application 2020 & 2033
- Table 18: Rest of Asia Pacific Activated Bleaching Earth Industry Volume (K Tons) Forecast, by Application 2020 & 2033
- Table 19: Global Activated Bleaching Earth Industry Revenue million Forecast, by Application 2020 & 2033
- Table 20: Global Activated Bleaching Earth Industry Volume K Tons Forecast, by Application 2020 & 2033
- Table 21: Global Activated Bleaching Earth Industry Revenue million Forecast, by Country 2020 & 2033
- Table 22: Global Activated Bleaching Earth Industry Volume K Tons Forecast, by Country 2020 & 2033
- Table 23: United States Activated Bleaching Earth Industry Revenue (million) Forecast, by Application 2020 & 2033
- Table 24: United States Activated Bleaching Earth Industry Volume (K Tons) Forecast, by Application 2020 & 2033
- Table 25: Canada Activated Bleaching Earth Industry Revenue (million) Forecast, by Application 2020 & 2033
- Table 26: Canada Activated Bleaching Earth Industry Volume (K Tons) Forecast, by Application 2020 & 2033
- Table 27: Mexico Activated Bleaching Earth Industry Revenue (million) Forecast, by Application 2020 & 2033
- Table 28: Mexico Activated Bleaching Earth Industry Volume (K Tons) Forecast, by Application 2020 & 2033
- Table 29: Global Activated Bleaching Earth Industry Revenue million Forecast, by Application 2020 & 2033
- Table 30: Global Activated Bleaching Earth Industry Volume K Tons Forecast, by Application 2020 & 2033
- Table 31: Global Activated Bleaching Earth Industry Revenue million Forecast, by Country 2020 & 2033
- Table 32: Global Activated Bleaching Earth Industry Volume K Tons Forecast, by Country 2020 & 2033
- Table 33: Germany Activated Bleaching Earth Industry Revenue (million) Forecast, by Application 2020 & 2033
- Table 34: Germany Activated Bleaching Earth Industry Volume (K Tons) Forecast, by Application 2020 & 2033
- Table 35: United Kingdom Activated Bleaching Earth Industry Revenue (million) Forecast, by Application 2020 & 2033
- Table 36: United Kingdom Activated Bleaching Earth Industry Volume (K Tons) Forecast, by Application 2020 & 2033
- Table 37: Italy Activated Bleaching Earth Industry Revenue (million) Forecast, by Application 2020 & 2033
- Table 38: Italy Activated Bleaching Earth Industry Volume (K Tons) Forecast, by Application 2020 & 2033
- Table 39: France Activated Bleaching Earth Industry Revenue (million) Forecast, by Application 2020 & 2033
- Table 40: France Activated Bleaching Earth Industry Volume (K Tons) Forecast, by Application 2020 & 2033
- Table 41: Rest of Europe Activated Bleaching Earth Industry Revenue (million) Forecast, by Application 2020 & 2033
- Table 42: Rest of Europe Activated Bleaching Earth Industry Volume (K Tons) Forecast, by Application 2020 & 2033
- Table 43: Global Activated Bleaching Earth Industry Revenue million Forecast, by Application 2020 & 2033
- Table 44: Global Activated Bleaching Earth Industry Volume K Tons Forecast, by Application 2020 & 2033
- Table 45: Global Activated Bleaching Earth Industry Revenue million Forecast, by Country 2020 & 2033
- Table 46: Global Activated Bleaching Earth Industry Volume K Tons Forecast, by Country 2020 & 2033
- Table 47: Brazil Activated Bleaching Earth Industry Revenue (million) Forecast, by Application 2020 & 2033
- Table 48: Brazil Activated Bleaching Earth Industry Volume (K Tons) Forecast, by Application 2020 & 2033
- Table 49: Argentina Activated Bleaching Earth Industry Revenue (million) Forecast, by Application 2020 & 2033
- Table 50: Argentina Activated Bleaching Earth Industry Volume (K Tons) Forecast, by Application 2020 & 2033
- Table 51: Rest of South America Activated Bleaching Earth Industry Revenue (million) Forecast, by Application 2020 & 2033
- Table 52: Rest of South America Activated Bleaching Earth Industry Volume (K Tons) Forecast, by Application 2020 & 2033
- Table 53: Global Activated Bleaching Earth Industry Revenue million Forecast, by Application 2020 & 2033
- Table 54: Global Activated Bleaching Earth Industry Volume K Tons Forecast, by Application 2020 & 2033
- Table 55: Global Activated Bleaching Earth Industry Revenue million Forecast, by Country 2020 & 2033
- Table 56: Global Activated Bleaching Earth Industry Volume K Tons Forecast, by Country 2020 & 2033
- Table 57: Saudi Arabia Activated Bleaching Earth Industry Revenue (million) Forecast, by Application 2020 & 2033
- Table 58: Saudi Arabia Activated Bleaching Earth Industry Volume (K Tons) Forecast, by Application 2020 & 2033
- Table 59: South Africa Activated Bleaching Earth Industry Revenue (million) Forecast, by Application 2020 & 2033
- Table 60: South Africa Activated Bleaching Earth Industry Volume (K Tons) Forecast, by Application 2020 & 2033
- Table 61: Rest of Middle East and Africa Activated Bleaching Earth Industry Revenue (million) Forecast, by Application 2020 & 2033
- Table 62: Rest of Middle East and Africa Activated Bleaching Earth Industry Volume (K Tons) Forecast, by Application 2020 & 2033
Frequently Asked Questions
1. What is the projected Compound Annual Growth Rate (CAGR) of the Activated Bleaching Earth Industry?
The projected CAGR is approximately 5.2%.
2. Which companies are prominent players in the Activated Bleaching Earth Industry?
Key companies in the market include Clariant, Phoenix Chemicals (Pvt ) Ltd, Refoil Earth Pvt Ltd, Global Bleach Chem Pvt Ltd, The W Clay Industries Sdn Bhd, Hrp Industries, Ashapura Perfoclay Limited (APL), Shell Plc (ecooils Limited), Taiko Group of Companies (Taiko Bleaching Earth Sdn Bhd ), Oil-dri Corporation of America, Musim Mas Holdings Pte Ltd, Indian Clay And Mineral Co.
3. What are the main segments of the Activated Bleaching Earth Industry?
The market segments include Application.
4. Can you provide details about the market size?
The market size is estimated to be USD 3091.2 million as of 2022.
5. What are some drivers contributing to market growth?
Growing Demand for Edible Oils.
6. What are the notable trends driving market growth?
Increasing Demand for Edible Oil & Fats.
7. Are there any restraints impacting market growth?
Presence of Alternative Products and Technologies.
8. Can you provide examples of recent developments in the market?
November 2022: Shell Eastern Petroleum (Pte) Ltd, a wholly-owned subsidiary of Shell PLC (Shell), acquired EcoOilsLimited (EcoOils), a waste oil recycling company. This acquisition is part of Shell's goal to enhance the production of low-carbon transportation fuels, particularly sustainable aviation fuel. EcoOilsMalaysia's subsidiaries and 90% of its Indonesian subsidiary will be acquired. EcoOilsuse recycling technology prevents waste from going to landfills and produces spent bleaching earth oil, an internationally recognized biofuels feedstock that can be used to produce low-carbon fuels.
9. What pricing options are available for accessing the report?
Pricing options include single-user, multi-user, and enterprise licenses priced at USD 4750, USD 5250, and USD 8750 respectively.
10. Is the market size provided in terms of value or volume?
The market size is provided in terms of value, measured in million and volume, measured in K Tons.
11. Are there any specific market keywords associated with the report?
Yes, the market keyword associated with the report is "Activated Bleaching Earth Industry," which aids in identifying and referencing the specific market segment covered.
12. How do I determine which pricing option suits my needs best?
The pricing options vary based on user requirements and access needs. Individual users may opt for single-user licenses, while businesses requiring broader access may choose multi-user or enterprise licenses for cost-effective access to the report.
13. Are there any additional resources or data provided in the Activated Bleaching Earth Industry report?
While the report offers comprehensive insights, it's advisable to review the specific contents or supplementary materials provided to ascertain if additional resources or data are available.
14. How can I stay updated on further developments or reports in the Activated Bleaching Earth Industry?
To stay informed about further developments, trends, and reports in the Activated Bleaching Earth Industry, consider subscribing to industry newsletters, following relevant companies and organizations, or regularly checking reputable industry news sources and publications.
Methodology
Step 1 - Identification of Relevant Samples Size from Population Database


Step 2 - Approaches for Defining Global Market Size (Value, Volume* & Price*)

Note*: In applicable scenarios
Step 3 - Data Sources
Primary Research
- Web Analytics
- Survey Reports
- Research Institute
- Latest Research Reports
- Opinion Leaders
Secondary Research
- Annual Reports
- White Paper
- Latest Press Release
- Industry Association
- Paid Database
- Investor Presentations

Step 4 - Data Triangulation
Involves using different sources of information in order to increase the validity of a study
These sources are likely to be stakeholders in a program - participants, other researchers, program staff, other community members, and so on.
Then we put all data in single framework & apply various statistical tools to find out the dynamic on the market.
During the analysis stage, feedback from the stakeholder groups would be compared to determine areas of agreement as well as areas of divergence