

Key Insights
The US travel accommodation market, valued at $47.10 billion in 2025, is projected to experience robust growth, exceeding a 7% CAGR from 2025 to 2033. This expansion is fueled by several key drivers. Increased disposable incomes and a growing preference for leisure travel among US consumers significantly contribute to market growth. The rise of online travel agencies (OTAs) like Expedia, Booking.com, and Airbnb, offering diverse options and competitive pricing, further stimulates demand. Technological advancements, such as improved mobile booking platforms and personalized travel recommendations, enhance user experience and drive adoption. Furthermore, the increasing popularity of unique accommodation types, including boutique hotels and vacation rentals, caters to evolving travel preferences, contributing to market diversification.
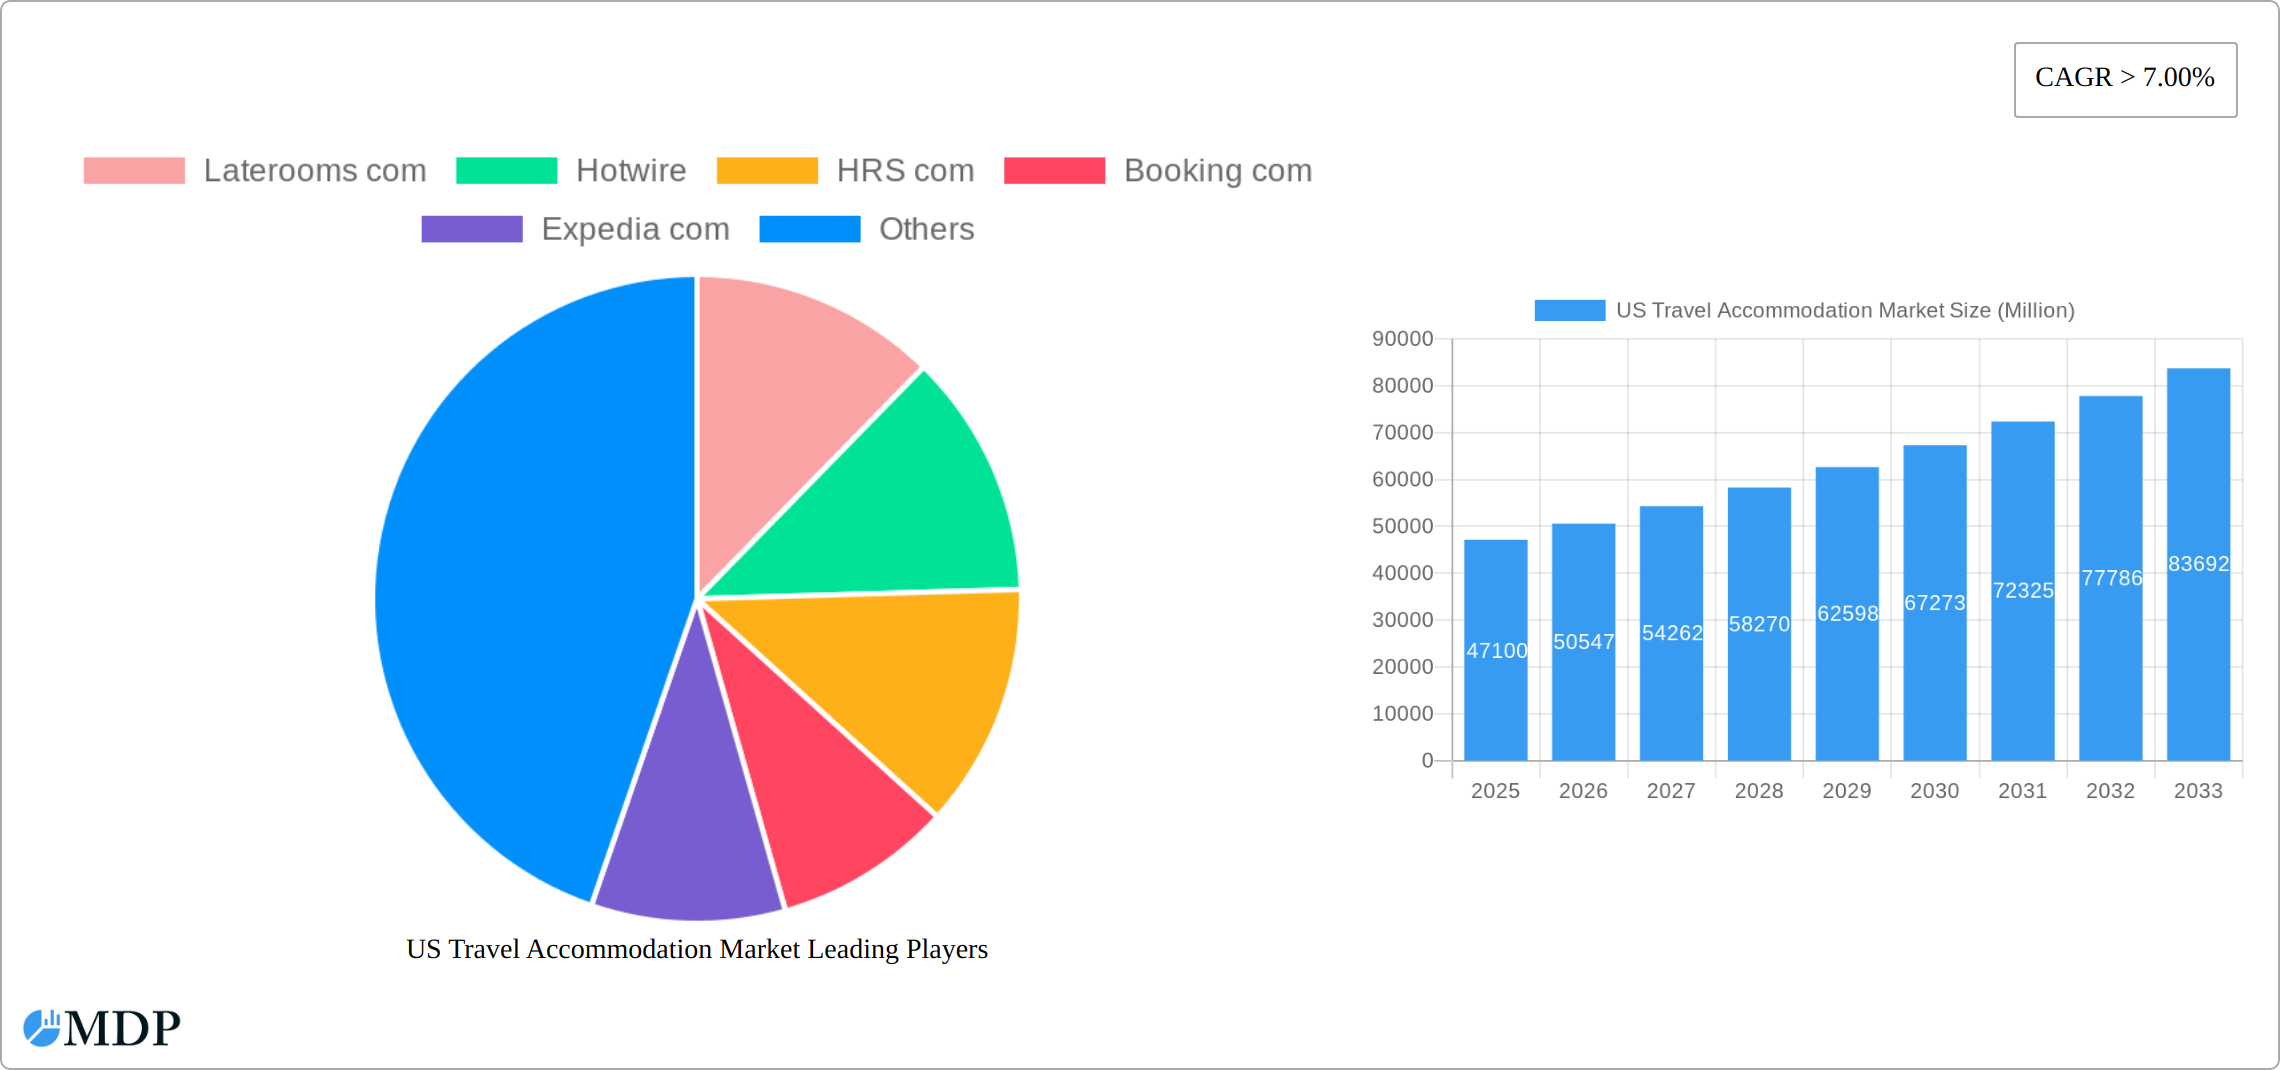
US Travel Accommodation Market Market Size (In Billion)
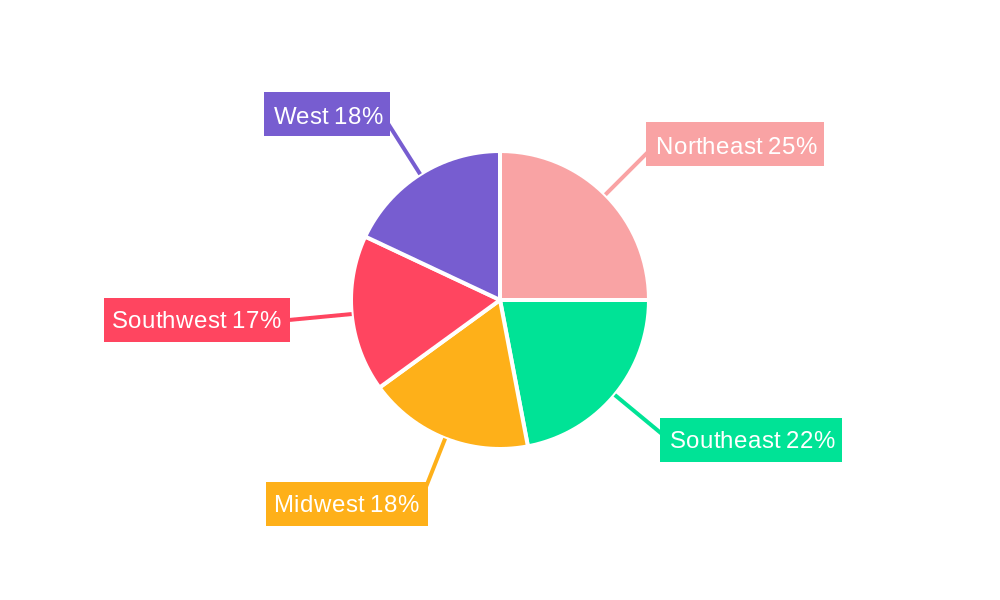
However, the market faces certain constraints. Economic fluctuations can impact travel spending, while rising accommodation costs and potential regulatory changes pose challenges. Competition among various players, including established OTAs and emerging niche platforms, remains intense. Nevertheless, the market's growth trajectory is positive, driven by the enduring appeal of travel and the continuous adaptation of the industry to technological advancements and changing consumer needs. Segmentation reveals significant market share held by online booking platforms, with both mobile applications and websites playing a critical role. The direct/captive portal segment also holds considerable weight, indicating a strong preference for booking directly with hotels or other accommodation providers, especially among those seeking loyalty programs and personalized services. Regional analysis across the US (Northeast, Southeast, Midwest, Southwest, and West) would reveal variations in market size and growth patterns, reflecting differences in tourism hotspots, population density, and economic activity.
US Travel Accommodation Market Company Market Share
US Travel Accommodation Market Report: 2019-2033 Forecast
Uncover the lucrative opportunities and challenges shaping the US Travel Accommodation Market with our comprehensive report, covering the period 2019-2033. This in-depth analysis provides actionable insights for industry stakeholders, investors, and businesses seeking to navigate this dynamic sector.
US Travel Accommodation Market Market Dynamics & Concentration
The US travel accommodation market, a multi-billion dollar industry in 2024, is fiercely competitive and undergoing significant consolidation. Market concentration is high, with a few dominant players controlling a substantial portion of the market share. This dynamic landscape is shaped by technological innovation, evolving consumer preferences, and regulatory changes.
Market Share (Estimated 2025): These estimates represent a snapshot and actual figures may vary based on reporting methodologies and data sources.
- Expedia Group: 25%
- Booking Holdings: 20%
- Airbnb: 15%
- Other Online Travel Agencies (OTAs): 20%
- Direct Bookings: 20%
Innovation Drivers: The market is experiencing rapid transformation driven by technological advancements. Mobile booking platforms, AI-powered personalization, and dynamic pricing algorithms are enhancing the customer experience and creating new revenue streams. The growing demand for sustainable and experiential travel is also fueling innovation, with a rise in eco-friendly accommodations and unique travel offerings.
Regulatory Landscape: The US travel accommodation market operates within a complex regulatory framework encompassing data privacy (like CCPA and GDPR implications for US-based companies handling EU data), consumer protection, and antitrust laws. Recent regulatory shifts emphasizing transparency and consumer rights are likely to further impact market practices and competition. Compliance with these regulations is crucial for market players.
Competitive Dynamics: The market faces intense competition from various sources. Alternative accommodation options like vacation rentals (Airbnb) and homestays compete directly with traditional hotels, offering diverse price points and experiences. The emergence of unique accommodation types, including glamping and boutique hotels, further diversifies the market and caters to niche consumer segments.
Evolving Consumer Preferences: End-user trends are significantly shaping the market. Consumers increasingly seek personalized experiences, flexible booking options, value-added services, and transparent pricing. The growing preference for sustainable and responsible travel is also influencing accommodation choices, driving demand for eco-conscious options.
Mergers and Acquisitions (M&A): The US travel accommodation market has witnessed considerable M&A activity in recent years (XX deals in the past 5 years), reflecting the pursuit of market share expansion, diversification, and enhanced technological capabilities by larger players. This consolidation trend is anticipated to continue as companies strive for greater scale and efficiency.
US Travel Accommodation Market Industry Trends & Analysis
The US travel accommodation market is experiencing robust growth, driven by a combination of factors. The Compound Annual Growth Rate (CAGR) for the forecast period (2025-2033) is estimated at XX%. Increased disposable incomes, rising tourism, and the growing popularity of online travel booking platforms are key growth drivers. The market penetration of online travel agencies (OTAs) continues to rise, reaching an estimated XX% in 2025. Technological disruptions such as the emergence of metasearch engines and the integration of AI in travel planning are significantly influencing consumer behaviour and market dynamics. The increasing adoption of mobile booking applications and the growing preference for personalized travel experiences are shaping the competitive landscape. Shifting consumer preferences towards unique accommodations, sustainable travel choices, and value-driven packages are creating new opportunities for market players.
Leading Markets & Segments in US Travel Accommodation Market
Geographic Distribution: Major metropolitan areas and popular tourist destinations remain the most significant market segments, benefiting from high visitor traffic and diverse accommodation offerings.
Key Segments:
- Booking Platform: Mobile applications are projected to maintain their dominance in 2025, leveraging their convenience and widespread consumer adoption. This trend necessitates optimized mobile-first strategies for success in this market.
- Booking Method: While third-party online travel agencies (OTAs) retain a substantial market share, direct bookings via hotel websites and captive portals are experiencing faster growth, driven by brand loyalty programs and the desire for personalized service. This highlights the importance of building strong brand loyalty and effective direct booking strategies.
Growth Drivers:
- Economic Factors: Rising disposable incomes and a strengthening middle class are fueling increased travel expenditure, directly impacting demand for accommodation services. Economic indicators are key to forecasting market growth.
- Infrastructure Development: Investments in improved transportation infrastructure, particularly in key tourist destinations, enhance accessibility and support market expansion. Efficient and accessible transportation networks are vital for the sector's growth.
- Government Policies: Supportive tourism policies, including infrastructure investments and marketing initiatives, create a favorable environment for market growth. Government regulations and incentives play a significant role in shaping the industry landscape.
The continued dominance of mobile bookings emphasizes the need for user-friendly mobile applications, while the growth of direct bookings underscores the importance of effective loyalty programs and a strong brand presence.
US Travel Accommodation Market Product Developments
Significant advancements in technology have led to the development of innovative products and services within the US travel accommodation market. These include AI-powered personalization tools, virtual reality tours, and enhanced mobile applications with seamless booking features. The focus on providing personalized and customized travel experiences tailored to specific customer preferences is driving product development. This focus on customer-centric solutions, coupled with an increase in user-friendly interfaces and integration with various travel services, creates competitive advantages for businesses in the sector.
Key Drivers of US Travel Accommodation Market Growth
The growth trajectory of the US travel accommodation market is propelled by a confluence of factors:
- Technological Innovation: Mobile booking platforms, AI-powered recommendations, personalized travel itineraries, and virtual reality experiences are enhancing the customer experience, driving engagement, and boosting bookings. Companies that embrace these technologies will gain a competitive advantage.
- Economic Expansion: A robust economy and rising disposable incomes directly translate into increased travel spending, significantly impacting the demand for accommodation services. Economic forecasts are critical for accurate market projections.
- Supportive Government Policies: Tourism-focused initiatives, infrastructure investments, and streamlined visa processes create a conducive environment for the sector's expansion. Government support plays a vital role in fostering sustainable market growth.
- Shifting Travel Preferences: The increasing demand for unique and experiential travel, sustainable accommodations, and flexible booking options presents both challenges and opportunities for accommodation providers.
Challenges in the US Travel Accommodation Market Market
The US travel accommodation market faces several challenges:
- Increased competition: The highly competitive landscape, with numerous OTAs and alternative accommodation providers, puts pressure on pricing and profitability. The impact of this competition leads to reduced margins for many companies.
- Supply chain disruptions: Fluctuations in global supply chains can impact hotel operations and availability. This negatively impacted the market in 2022, resulting in a XX Million loss in revenue.
- Regulatory hurdles: Compliance with evolving regulations regarding data privacy and consumer protection adds operational complexity.
Emerging Opportunities in US Travel Accommodation Market
Several emerging trends present significant opportunities for growth in the US travel accommodation market. These include the expansion of sustainable and eco-friendly travel options, the rise of experiential travel focusing on unique and authentic experiences, and the increasing integration of technology to create seamless and personalized travel experiences. The adoption of innovative technologies and strategic partnerships are key to exploiting these opportunities.
Leading Players in the US Travel Accommodation Market Sector
- Laterooms.com
- Hotwire
- HRS.com
- Booking.com
- Expedia.com
- Tripadvisor.com
- Orbitz.com
- Hotels.com
- Airbnb.com
- Priceline.com
- Agoda.com
Key Milestones in US Travel Accommodation Market Industry
- September 2023: Philippine Airlines' launch of PAL Holidays powered by Expedia Group signifies Expedia's expansion into new markets and partnerships, boosting its market reach and potential for future growth. This strategic alliance demonstrates the ongoing consolidation within the travel sector.
- March 2023: Expedia Group's partnership with Wheel the World highlights a commitment to inclusive travel, tapping into a previously underserved market segment of travelers with disabilities. This initiative showcases the growing importance of accessibility and inclusivity within the travel industry.
- [Add more recent milestones here with detailed descriptions and their impact on the market] Include dates, companies involved, and the significance of the event for the market. For example, new technologies adopted, significant funding rounds, impactful regulatory changes, etc.
Strategic Outlook for US Travel Accommodation Market Market
The US travel accommodation market exhibits strong growth potential, driven by technological advancements, evolving consumer preferences, and strategic partnerships. The focus on personalized experiences, sustainable tourism, and the expansion of accessible travel options will be key drivers of future growth. Companies that successfully adapt to these trends and leverage technological innovations to enhance customer experiences are poised for success in this dynamic market.
US Travel Accommodation Market Segmentation
-
1. Platform Type
- 1.1. Mobile Application
- 1.2. Website
-
2. Mode of Booking Type
- 2.1. Third Party online portals
- 2.2. Direct/Captive portals
US Travel Accommodation Market Segmentation By Geography
-
1. North America
- 1.1. United States
- 1.2. Canada
- 1.3. Mexico
-
2. South America
- 2.1. Brazil
- 2.2. Argentina
- 2.3. Rest of South America
-
3. Europe
- 3.1. United Kingdom
- 3.2. Germany
- 3.3. France
- 3.4. Italy
- 3.5. Spain
- 3.6. Russia
- 3.7. Benelux
- 3.8. Nordics
- 3.9. Rest of Europe
-
4. Middle East & Africa
- 4.1. Turkey
- 4.2. Israel
- 4.3. GCC
- 4.4. North Africa
- 4.5. South Africa
- 4.6. Rest of Middle East & Africa
-
5. Asia Pacific
- 5.1. China
- 5.2. India
- 5.3. Japan
- 5.4. South Korea
- 5.5. ASEAN
- 5.6. Oceania
- 5.7. Rest of Asia Pacific
US Travel Accommodation Market Regional Market Share
Geographic Coverage of US Travel Accommodation Market
US Travel Accommodation Market REPORT HIGHLIGHTS
| Aspects | Details |
|---|---|
| Study Period | 2020-2034 |
| Base Year | 2025 |
| Estimated Year | 2026 |
| Forecast Period | 2026-2034 |
| Historical Period | 2020-2025 |
| Growth Rate | CAGR of > 7.00% from 2020-2034 |
| Segmentation |
|
Table of Contents
- 1. Introduction
- 1.1. Research Scope
- 1.2. Market Segmentation
- 1.3. Research Objective
- 1.4. Definitions and Assumptions
- 2. Executive Summary
- 2.1. Market Snapshot
- 3. Market Dynamics
- 3.1. Market Drivers
- 3.2. Market Restrains
- 3.3. Market Trends
- 3.4. Market Opportunities
- 4. Market Factor Analysis
- 4.1. Porters Five Forces
- 4.1.1. Bargaining Power of Suppliers
- 4.1.2. Bargaining Power of Buyers
- 4.1.3. Threat of New Entrants
- 4.1.4. Threat of Substitutes
- 4.1.5. Competitive Rivalry
- 4.2. PESTEL analysis
- 4.3. BCG Analysis
- 4.3.1. Stars (High Growth, High Market Share)
- 4.3.2. Cash Cows (Low Growth, High Market Share)
- 4.3.3. Question Mark (High Growth, Low Market Share)
- 4.3.4. Dogs (Low Growth, Low Market Share)
- 4.4. Ansoff Matrix Analysis
- 4.5. Supply Chain Analysis
- 4.6. Regulatory Landscape
- 4.7. Current Market Potential and Opportunity Assessment (TAM–SAM–SOM Framework)
- 4.8. MDP Analyst Note
- 4.1. Porters Five Forces
- 5. Market Analysis, Insights and Forecast 2021-2033
- 5.1. Market Analysis, Insights and Forecast - by Platform Type
- 5.1.1. Mobile Application
- 5.1.2. Website
- 5.2. Market Analysis, Insights and Forecast - by Mode of Booking Type
- 5.2.1. Third Party online portals
- 5.2.2. Direct/Captive portals
- 5.3. Market Analysis, Insights and Forecast - by Region
- 5.3.1. North America
- 5.3.2. South America
- 5.3.3. Europe
- 5.3.4. Middle East & Africa
- 5.3.5. Asia Pacific
- 5.1. Market Analysis, Insights and Forecast - by Platform Type
- 6. Global US Travel Accommodation Market Analysis, Insights and Forecast, 2021-2033
- 6.1. Market Analysis, Insights and Forecast - by Platform Type
- 6.1.1. Mobile Application
- 6.1.2. Website
- 6.2. Market Analysis, Insights and Forecast - by Mode of Booking Type
- 6.2.1. Third Party online portals
- 6.2.2. Direct/Captive portals
- 6.1. Market Analysis, Insights and Forecast - by Platform Type
- 7. North America US Travel Accommodation Market Analysis, Insights and Forecast, 2020-2032
- 7.1. Market Analysis, Insights and Forecast - by Platform Type
- 7.1.1. Mobile Application
- 7.1.2. Website
- 7.2. Market Analysis, Insights and Forecast - by Mode of Booking Type
- 7.2.1. Third Party online portals
- 7.2.2. Direct/Captive portals
- 7.1. Market Analysis, Insights and Forecast - by Platform Type
- 8. South America US Travel Accommodation Market Analysis, Insights and Forecast, 2020-2032
- 8.1. Market Analysis, Insights and Forecast - by Platform Type
- 8.1.1. Mobile Application
- 8.1.2. Website
- 8.2. Market Analysis, Insights and Forecast - by Mode of Booking Type
- 8.2.1. Third Party online portals
- 8.2.2. Direct/Captive portals
- 8.1. Market Analysis, Insights and Forecast - by Platform Type
- 9. Europe US Travel Accommodation Market Analysis, Insights and Forecast, 2020-2032
- 9.1. Market Analysis, Insights and Forecast - by Platform Type
- 9.1.1. Mobile Application
- 9.1.2. Website
- 9.2. Market Analysis, Insights and Forecast - by Mode of Booking Type
- 9.2.1. Third Party online portals
- 9.2.2. Direct/Captive portals
- 9.1. Market Analysis, Insights and Forecast - by Platform Type
- 10. Middle East & Africa US Travel Accommodation Market Analysis, Insights and Forecast, 2020-2032
- 10.1. Market Analysis, Insights and Forecast - by Platform Type
- 10.1.1. Mobile Application
- 10.1.2. Website
- 10.2. Market Analysis, Insights and Forecast - by Mode of Booking Type
- 10.2.1. Third Party online portals
- 10.2.2. Direct/Captive portals
- 10.1. Market Analysis, Insights and Forecast - by Platform Type
- 11. Asia Pacific US Travel Accommodation Market Analysis, Insights and Forecast, 2020-2032
- 11.1. Market Analysis, Insights and Forecast - by Platform Type
- 11.1.1. Mobile Application
- 11.1.2. Website
- 11.2. Market Analysis, Insights and Forecast - by Mode of Booking Type
- 11.2.1. Third Party online portals
- 11.2.2. Direct/Captive portals
- 11.1. Market Analysis, Insights and Forecast - by Platform Type
- 12. Competitive Analysis
- 12.1. Company Profiles
- 12.1.1 Laterooms com
- 12.1.1.1. Company Overview
- 12.1.1.2. Products
- 12.1.1.3. Company Financials
- 12.1.1.4. SWOT Analysis
- 12.1.2 Hotwire
- 12.1.2.1. Company Overview
- 12.1.2.2. Products
- 12.1.2.3. Company Financials
- 12.1.2.4. SWOT Analysis
- 12.1.3 HRS com
- 12.1.3.1. Company Overview
- 12.1.3.2. Products
- 12.1.3.3. Company Financials
- 12.1.3.4. SWOT Analysis
- 12.1.4 Booking com
- 12.1.4.1. Company Overview
- 12.1.4.2. Products
- 12.1.4.3. Company Financials
- 12.1.4.4. SWOT Analysis
- 12.1.5 Expedia com
- 12.1.5.1. Company Overview
- 12.1.5.2. Products
- 12.1.5.3. Company Financials
- 12.1.5.4. SWOT Analysis
- 12.1.6 Tripadvisor com**List Not Exhaustive
- 12.1.6.1. Company Overview
- 12.1.6.2. Products
- 12.1.6.3. Company Financials
- 12.1.6.4. SWOT Analysis
- 12.1.7 Orbitz com
- 12.1.7.1. Company Overview
- 12.1.7.2. Products
- 12.1.7.3. Company Financials
- 12.1.7.4. SWOT Analysis
- 12.1.8 Hotels com
- 12.1.8.1. Company Overview
- 12.1.8.2. Products
- 12.1.8.3. Company Financials
- 12.1.8.4. SWOT Analysis
- 12.1.9 Airbnb com
- 12.1.9.1. Company Overview
- 12.1.9.2. Products
- 12.1.9.3. Company Financials
- 12.1.9.4. SWOT Analysis
- 12.1.10 Priceline com
- 12.1.10.1. Company Overview
- 12.1.10.2. Products
- 12.1.10.3. Company Financials
- 12.1.10.4. SWOT Analysis
- 12.1.11 Agoda com
- 12.1.11.1. Company Overview
- 12.1.11.2. Products
- 12.1.11.3. Company Financials
- 12.1.11.4. SWOT Analysis
- 12.1.1 Laterooms com
- 12.2. Market Entropy
- 12.2.1 Company's Key Areas Served
- 12.2.2 Recent Developments
- 12.3. Company Market Share Analysis 2025
- 12.3.1 Top 5 Companies Market Share Analysis
- 12.3.2 Top 3 Companies Market Share Analysis
- 12.4. List of Potential Customers
- 13. Research Methodology
List of Figures
- Figure 1: Global US Travel Accommodation Market Revenue Breakdown (Million, %) by Region 2025 & 2033
- Figure 2: North America US Travel Accommodation Market Revenue (Million), by Platform Type 2025 & 2033
- Figure 3: North America US Travel Accommodation Market Revenue Share (%), by Platform Type 2025 & 2033
- Figure 4: North America US Travel Accommodation Market Revenue (Million), by Mode of Booking Type 2025 & 2033
- Figure 5: North America US Travel Accommodation Market Revenue Share (%), by Mode of Booking Type 2025 & 2033
- Figure 6: North America US Travel Accommodation Market Revenue (Million), by Country 2025 & 2033
- Figure 7: North America US Travel Accommodation Market Revenue Share (%), by Country 2025 & 2033
- Figure 8: South America US Travel Accommodation Market Revenue (Million), by Platform Type 2025 & 2033
- Figure 9: South America US Travel Accommodation Market Revenue Share (%), by Platform Type 2025 & 2033
- Figure 10: South America US Travel Accommodation Market Revenue (Million), by Mode of Booking Type 2025 & 2033
- Figure 11: South America US Travel Accommodation Market Revenue Share (%), by Mode of Booking Type 2025 & 2033
- Figure 12: South America US Travel Accommodation Market Revenue (Million), by Country 2025 & 2033
- Figure 13: South America US Travel Accommodation Market Revenue Share (%), by Country 2025 & 2033
- Figure 14: Europe US Travel Accommodation Market Revenue (Million), by Platform Type 2025 & 2033
- Figure 15: Europe US Travel Accommodation Market Revenue Share (%), by Platform Type 2025 & 2033
- Figure 16: Europe US Travel Accommodation Market Revenue (Million), by Mode of Booking Type 2025 & 2033
- Figure 17: Europe US Travel Accommodation Market Revenue Share (%), by Mode of Booking Type 2025 & 2033
- Figure 18: Europe US Travel Accommodation Market Revenue (Million), by Country 2025 & 2033
- Figure 19: Europe US Travel Accommodation Market Revenue Share (%), by Country 2025 & 2033
- Figure 20: Middle East & Africa US Travel Accommodation Market Revenue (Million), by Platform Type 2025 & 2033
- Figure 21: Middle East & Africa US Travel Accommodation Market Revenue Share (%), by Platform Type 2025 & 2033
- Figure 22: Middle East & Africa US Travel Accommodation Market Revenue (Million), by Mode of Booking Type 2025 & 2033
- Figure 23: Middle East & Africa US Travel Accommodation Market Revenue Share (%), by Mode of Booking Type 2025 & 2033
- Figure 24: Middle East & Africa US Travel Accommodation Market Revenue (Million), by Country 2025 & 2033
- Figure 25: Middle East & Africa US Travel Accommodation Market Revenue Share (%), by Country 2025 & 2033
- Figure 26: Asia Pacific US Travel Accommodation Market Revenue (Million), by Platform Type 2025 & 2033
- Figure 27: Asia Pacific US Travel Accommodation Market Revenue Share (%), by Platform Type 2025 & 2033
- Figure 28: Asia Pacific US Travel Accommodation Market Revenue (Million), by Mode of Booking Type 2025 & 2033
- Figure 29: Asia Pacific US Travel Accommodation Market Revenue Share (%), by Mode of Booking Type 2025 & 2033
- Figure 30: Asia Pacific US Travel Accommodation Market Revenue (Million), by Country 2025 & 2033
- Figure 31: Asia Pacific US Travel Accommodation Market Revenue Share (%), by Country 2025 & 2033
List of Tables
- Table 1: Global US Travel Accommodation Market Revenue Million Forecast, by Platform Type 2020 & 2033
- Table 2: Global US Travel Accommodation Market Revenue Million Forecast, by Mode of Booking Type 2020 & 2033
- Table 3: Global US Travel Accommodation Market Revenue Million Forecast, by Region 2020 & 2033
- Table 4: Global US Travel Accommodation Market Revenue Million Forecast, by Platform Type 2020 & 2033
- Table 5: Global US Travel Accommodation Market Revenue Million Forecast, by Mode of Booking Type 2020 & 2033
- Table 6: Global US Travel Accommodation Market Revenue Million Forecast, by Country 2020 & 2033
- Table 7: United States US Travel Accommodation Market Revenue (Million) Forecast, by Application 2020 & 2033
- Table 8: Canada US Travel Accommodation Market Revenue (Million) Forecast, by Application 2020 & 2033
- Table 9: Mexico US Travel Accommodation Market Revenue (Million) Forecast, by Application 2020 & 2033
- Table 10: Global US Travel Accommodation Market Revenue Million Forecast, by Platform Type 2020 & 2033
- Table 11: Global US Travel Accommodation Market Revenue Million Forecast, by Mode of Booking Type 2020 & 2033
- Table 12: Global US Travel Accommodation Market Revenue Million Forecast, by Country 2020 & 2033
- Table 13: Brazil US Travel Accommodation Market Revenue (Million) Forecast, by Application 2020 & 2033
- Table 14: Argentina US Travel Accommodation Market Revenue (Million) Forecast, by Application 2020 & 2033
- Table 15: Rest of South America US Travel Accommodation Market Revenue (Million) Forecast, by Application 2020 & 2033
- Table 16: Global US Travel Accommodation Market Revenue Million Forecast, by Platform Type 2020 & 2033
- Table 17: Global US Travel Accommodation Market Revenue Million Forecast, by Mode of Booking Type 2020 & 2033
- Table 18: Global US Travel Accommodation Market Revenue Million Forecast, by Country 2020 & 2033
- Table 19: United Kingdom US Travel Accommodation Market Revenue (Million) Forecast, by Application 2020 & 2033
- Table 20: Germany US Travel Accommodation Market Revenue (Million) Forecast, by Application 2020 & 2033
- Table 21: France US Travel Accommodation Market Revenue (Million) Forecast, by Application 2020 & 2033
- Table 22: Italy US Travel Accommodation Market Revenue (Million) Forecast, by Application 2020 & 2033
- Table 23: Spain US Travel Accommodation Market Revenue (Million) Forecast, by Application 2020 & 2033
- Table 24: Russia US Travel Accommodation Market Revenue (Million) Forecast, by Application 2020 & 2033
- Table 25: Benelux US Travel Accommodation Market Revenue (Million) Forecast, by Application 2020 & 2033
- Table 26: Nordics US Travel Accommodation Market Revenue (Million) Forecast, by Application 2020 & 2033
- Table 27: Rest of Europe US Travel Accommodation Market Revenue (Million) Forecast, by Application 2020 & 2033
- Table 28: Global US Travel Accommodation Market Revenue Million Forecast, by Platform Type 2020 & 2033
- Table 29: Global US Travel Accommodation Market Revenue Million Forecast, by Mode of Booking Type 2020 & 2033
- Table 30: Global US Travel Accommodation Market Revenue Million Forecast, by Country 2020 & 2033
- Table 31: Turkey US Travel Accommodation Market Revenue (Million) Forecast, by Application 2020 & 2033
- Table 32: Israel US Travel Accommodation Market Revenue (Million) Forecast, by Application 2020 & 2033
- Table 33: GCC US Travel Accommodation Market Revenue (Million) Forecast, by Application 2020 & 2033
- Table 34: North Africa US Travel Accommodation Market Revenue (Million) Forecast, by Application 2020 & 2033
- Table 35: South Africa US Travel Accommodation Market Revenue (Million) Forecast, by Application 2020 & 2033
- Table 36: Rest of Middle East & Africa US Travel Accommodation Market Revenue (Million) Forecast, by Application 2020 & 2033
- Table 37: Global US Travel Accommodation Market Revenue Million Forecast, by Platform Type 2020 & 2033
- Table 38: Global US Travel Accommodation Market Revenue Million Forecast, by Mode of Booking Type 2020 & 2033
- Table 39: Global US Travel Accommodation Market Revenue Million Forecast, by Country 2020 & 2033
- Table 40: China US Travel Accommodation Market Revenue (Million) Forecast, by Application 2020 & 2033
- Table 41: India US Travel Accommodation Market Revenue (Million) Forecast, by Application 2020 & 2033
- Table 42: Japan US Travel Accommodation Market Revenue (Million) Forecast, by Application 2020 & 2033
- Table 43: South Korea US Travel Accommodation Market Revenue (Million) Forecast, by Application 2020 & 2033
- Table 44: ASEAN US Travel Accommodation Market Revenue (Million) Forecast, by Application 2020 & 2033
- Table 45: Oceania US Travel Accommodation Market Revenue (Million) Forecast, by Application 2020 & 2033
- Table 46: Rest of Asia Pacific US Travel Accommodation Market Revenue (Million) Forecast, by Application 2020 & 2033
Frequently Asked Questions
1. What is the projected Compound Annual Growth Rate (CAGR) of the US Travel Accommodation Market?
The projected CAGR is approximately > 7.00%.
2. Which companies are prominent players in the US Travel Accommodation Market?
Key companies in the market include Laterooms com, Hotwire, HRS com, Booking com, Expedia com, Tripadvisor com**List Not Exhaustive, Orbitz com, Hotels com, Airbnb com, Priceline com, Agoda com.
3. What are the main segments of the US Travel Accommodation Market?
The market segments include Platform Type, Mode of Booking Type.
4. Can you provide details about the market size?
The market size is estimated to be USD 47.10 Million as of 2022.
5. What are some drivers contributing to market growth?
Airbnb in United States is Dominating the Market; The US Online Accommodation Market is Booming due to an Increase in Domestic Trips.
6. What are the notable trends driving market growth?
Rise in the Number of Visitors in California.
7. Are there any restraints impacting market growth?
Booking Cancellation.
8. Can you provide examples of recent developments in the market?
September 2023: Philippine Airlines launched PAL Holidays powered by Expedia Group, a one-stop travel website that offers travelers a seamless and comprehensive platform for all their travel needs. The new site is now live in the US, Canada, Australia, and the Philippines. The new platform is powered by Expedia Group’s White Label Template technology. It is designed to help passengers effortlessly plan and book their entire journey, including PAL flights, hotels, transportation, and exciting travel activities, all in one convenient location.
9. What pricing options are available for accessing the report?
Pricing options include single-user, multi-user, and enterprise licenses priced at USD 3800, USD 4500, and USD 5800 respectively.
10. Is the market size provided in terms of value or volume?
The market size is provided in terms of value, measured in Million.
11. Are there any specific market keywords associated with the report?
Yes, the market keyword associated with the report is "US Travel Accommodation Market," which aids in identifying and referencing the specific market segment covered.
12. How do I determine which pricing option suits my needs best?
The pricing options vary based on user requirements and access needs. Individual users may opt for single-user licenses, while businesses requiring broader access may choose multi-user or enterprise licenses for cost-effective access to the report.
13. Are there any additional resources or data provided in the US Travel Accommodation Market report?
While the report offers comprehensive insights, it's advisable to review the specific contents or supplementary materials provided to ascertain if additional resources or data are available.
14. How can I stay updated on further developments or reports in the US Travel Accommodation Market?
To stay informed about further developments, trends, and reports in the US Travel Accommodation Market, consider subscribing to industry newsletters, following relevant companies and organizations, or regularly checking reputable industry news sources and publications.
Methodology
Step 1 - Identification of Relevant Samples Size from Population Database


Step 2 - Approaches for Defining Global Market Size (Value, Volume* & Price*)

Note*: In applicable scenarios
Step 3 - Data Sources
Primary Research
- Web Analytics
- Survey Reports
- Research Institute
- Latest Research Reports
- Opinion Leaders
Secondary Research
- Annual Reports
- White Paper
- Latest Press Release
- Industry Association
- Paid Database
- Investor Presentations

Step 4 - Data Triangulation
Involves using different sources of information in order to increase the validity of a study
These sources are likely to be stakeholders in a program - participants, other researchers, program staff, other community members, and so on.
Then we put all data in single framework & apply various statistical tools to find out the dynamic on the market.
During the analysis stage, feedback from the stakeholder groups would be compared to determine areas of agreement as well as areas of divergence