

Key Insights
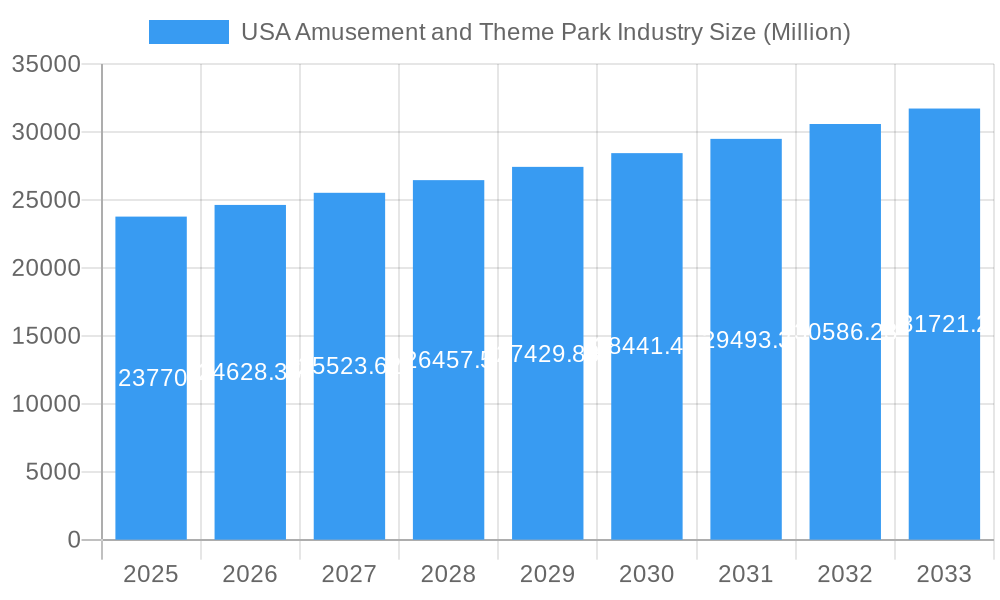
The US amusement and theme park industry, valued at $23.77 billion in 2025, is projected to experience robust growth, with a compound annual growth rate (CAGR) exceeding 3.50% from 2025 to 2033. This expansion is fueled by several key drivers. Increased disposable incomes, coupled with a rising preference for leisure and entertainment activities, particularly among millennials and Gen Z, significantly contribute to this growth. The continuous innovation in ride technology, immersive experiences, and themed attractions keeps the industry fresh and appealing to a broad demographic. Furthermore, strategic partnerships and collaborations between parks and entertainment companies, along with effective marketing strategies, contribute to increased visitor numbers and revenue generation. The industry's segmentation, encompassing land and water rides, diverse revenue streams (tickets, food & beverage, merchandise, and hospitality), and regional variations (Northeast, Southeast, Midwest, Southwest, and West), provides opportunities for targeted marketing and expansion.
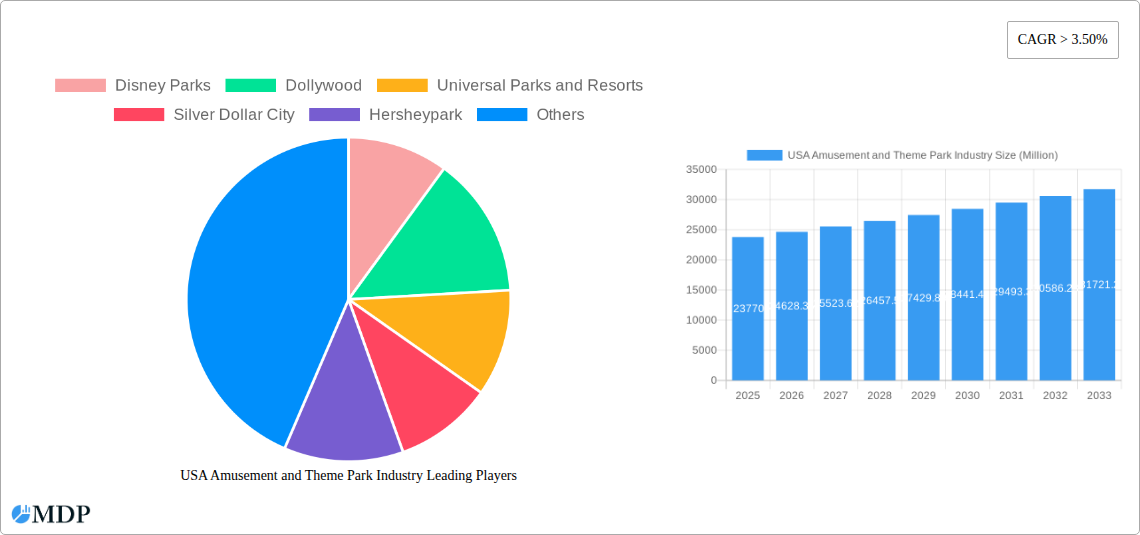
USA Amusement and Theme Park Industry Market Size (In Billion)
However, the industry also faces certain restraints. Economic fluctuations and inflation can impact consumer spending on discretionary entertainment. Increasing operational costs, including maintenance, staffing, and security, present challenges for profitability. Competition among established players like Disney Parks, Universal Parks and Resorts, Six Flags, and regional parks necessitates continuous innovation and investment to maintain market share. Environmental concerns and the need for sustainable practices are also emerging as critical considerations for the industry's long-term sustainability. Managing these challenges strategically will be crucial for continued growth and success in this dynamic and competitive market. The industry's resilience, demonstrated by its recovery from past economic downturns, suggests a positive outlook for the foreseeable future, particularly given the ongoing demand for engaging and memorable experiences.
USA Amusement and Theme Park Industry Company Market Share
USA Amusement and Theme Park Industry Report: 2019-2033
Dive into the exhilarating world of the USA Amusement and Theme Park industry with this comprehensive market analysis, projecting growth from 2019 to 2033. This report provides actionable insights for industry stakeholders, investors, and businesses seeking to navigate this dynamic sector. We delve into market dynamics, trends, leading players (including Disney Parks, Universal Parks & Resorts, Six Flags Inc., Cedar Fair Entertainment Company, and more), and emerging opportunities. The report covers a comprehensive analysis based on revenue streams (Tickets, Food & Beverages, Merchandise, Hospitality, and Others), ride types (Land Rides, Water Rides, and Other Types) and incorporates key developments impacting the industry. With a base year of 2025 and a forecast period extending to 2033, this report is an essential resource for understanding the current landscape and future trajectory of the US amusement and theme park industry. The total market size in 2025 is estimated at xx Million.
USA Amusement and Theme Park Industry Market Dynamics & Concentration
The USA amusement and theme park industry exhibits a moderately concentrated market structure, dominated by a few major players like Disney Parks, Universal Parks & Resorts, and Six Flags Inc. These companies hold significant market share, benefiting from brand recognition, established infrastructure, and economies of scale. However, regional players and niche operators also contribute to the market's overall dynamism.
Market Concentration Metrics (2024 Estimates):
- Top 3 Players Market Share: 60% (estimated)
- Top 5 Players Market Share: 75% (estimated)
- Number of M&A Deals (2019-2024): xx
Innovation Drivers:
- Technological advancements in ride design and immersive experiences.
- The integration of augmented and virtual reality (AR/VR) technologies.
- Development of personalized guest experiences through data analytics.
Regulatory Framework:
The industry operates under various local, state, and federal regulations concerning safety, accessibility, and environmental impact. Compliance requirements impact operational costs and investment decisions.
Product Substitutes:
Other forms of entertainment, including video games, streaming services, and home entertainment systems, compete for consumer leisure spending.
End-User Trends:
Growing demand for immersive experiences, family-friendly entertainment, and unique themed attractions shapes market growth. Millennials and Gen Z prioritize personalized experiences and social media-worthy moments, impacting park design and marketing strategies.
M&A Activities:
The industry witnesses occasional M&A activity, with larger players expanding their portfolios through acquisitions of smaller parks or related businesses. Recent examples include the acquisitions detailed in the “Key Milestones” section.
USA Amusement and Theme Park Industry Industry Trends & Analysis
The US amusement and theme park industry is experiencing steady growth, driven by several key factors. Increased disposable incomes, growing tourism, and the ongoing appeal of family entertainment contribute to market expansion. Technological advancements, such as the incorporation of AR/VR and interactive elements, enhance the guest experience and drive revenue generation. However, the industry faces challenges from economic downturns, changing consumer preferences, and the need to adapt to evolving entertainment landscapes.
Market Growth Drivers:
- Rising disposable incomes and tourism in key regions.
- Growing demand for immersive and interactive experiences.
- Technological advancements in ride technology, theming, and guest services.
Technological Disruptions:
AR/VR integration enhances ride experiences and creates unique entertainment opportunities. Data analytics contributes to personalized marketing and operations. Mobile applications facilitate ticket purchases, reservations, and in-park navigation.
Consumer Preferences:
Experiential entertainment is favored over traditional forms of passive leisure. Consumers seek unique, themed experiences, and interactive elements influence the popularity of certain parks and attractions.
Competitive Dynamics:
Competition is intense, especially among major players. Differentiation relies on unique attractions, immersive theming, strategic location, and effective marketing.
Market Size & CAGR: The market size is projected to reach xx Million by 2033, with a CAGR of xx% during the forecast period (2025-2033). Market penetration for theme parks remains relatively high in densely populated areas, while opportunities exist in underserved regions.
Leading Markets & Segments in USA Amusement and Theme Park Industry
The US amusement and theme park market is geographically diverse, with concentration in key tourist destinations and metropolitan areas. Florida and California, particularly, stand out as dominant regions due to their favorable climate, extensive tourism infrastructure, and presence of major theme parks.
By Type:
- Land Rides: This segment holds the largest market share, driven by the enduring appeal of roller coasters, thrill rides, and family-friendly attractions.
- Water Rides: This segment experiences seasonal fluctuations, but remains popular, especially in warmer climates.
- Other Types: This segment includes shows, parades, interactive experiences, and other forms of entertainment that enhance the overall park experience.
By Source of Revenue:
- Tickets: This is the primary revenue source for most parks.
- Food & Beverages: A significant revenue stream, particularly given the high volume of visitors.
- Merchandise: A substantial contributor, offering opportunities for themed merchandise sales.
- Hospitality: Revenue from hotels and resorts affiliated with the parks.
- Other Source of Revenues: This includes parking, special events, and other ancillary services.
Key Drivers for Dominant Regions:
- Florida & California: Strong tourism infrastructure, favorable weather, established major parks, and high population density.
- Other Regions: Growing tourism, investment in new attractions, and favorable economic conditions.
USA Amusement and Theme Park Industry Product Developments
Recent product innovations focus on enhancing guest experiences through technology integration. AR/VR, interactive games, and personalized digital platforms enrich the entertainment value. New ride designs prioritize safety and incorporate innovative storytelling and special effects. The market increasingly emphasizes sustainable practices and environmentally friendly operations.
Key Drivers of USA Amusement and Theme Park Industry Growth
Several factors drive the industry’s growth, including:
- Technological advancements: Enhanced ride technologies, immersive experiences, and digital integration.
- Economic growth: Rising disposable incomes fuel consumer spending on leisure activities.
- Favorable demographics: A growing population with a preference for experiential entertainment.
- Tourism: Increased domestic and international tourism boosts park attendance.
- Strategic partnerships: Collaborations with other businesses to enhance offerings and attract new visitors.
Challenges in the USA Amusement and Theme Park Industry Market
The industry faces challenges like:
- Economic downturns: Recessions can significantly impact consumer spending on discretionary activities.
- Seasonal fluctuations: Attendance and revenue are affected by weather patterns and seasonal demand.
- Competition: Intense competition among established players and the rise of new entertainment options.
- Regulatory compliance: Adherence to safety and environmental regulations increases operational costs.
- Supply chain issues: Disruptions can impact the timely construction and maintenance of attractions.
Emerging Opportunities in USA Amusement and Theme Park Industry
Long-term growth will be driven by:
- Technological breakthroughs: Continued innovation in ride design and immersive experiences.
- Strategic partnerships: Collaborations with technology providers and entertainment companies.
- Market expansion: Development of new parks in underserved regions.
- Sustainable practices: Emphasis on environmental responsibility attracts environmentally conscious visitors.
- Global partnerships: Collaboration with international entertainment companies opens new avenues of revenue.
Leading Players in the USA Amusement and Theme Park Industry Sector
- Disney Parks
- Dollywood
- Universal Parks and Resorts
- Silver Dollar City
- Hersheypark
- Six Flags Inc
- Busch Gardens
- The Island in Pigeon Forge
- Cedar Fair Entertainment Company
- Magic Kingdom Park
- Dells Waterpark
- Seaworld Parks and Entertainment
Key Milestones in USA Amusement and Theme Park Industry Industry
- September 2023: Crescent Real Estate LLC acquired the Element Orlando Universal Blvd. hotel, enhancing lodging options near Icon Park.
- July 2023: Asacha Media Group acquired a majority share in Arrow International Media, impacting the production of Disney's Animal Kingdom.
Strategic Outlook for USA Amusement and Theme Park Industry Market
The future of the US amusement and theme park industry looks bright. Continued technological innovation, strategic partnerships, and expansion into new markets will fuel long-term growth. Parks that adapt to evolving consumer preferences, embrace sustainable practices, and prioritize guest experience will thrive in the coming years. The market offers significant opportunities for both established players and new entrants seeking to capitalize on the ongoing demand for experiential entertainment.
USA Amusement and Theme Park Industry Segmentation
-
1. Type
- 1.1. Land Rides
- 1.2. Water Rides
- 1.3. Other Types
-
2. Source of Revenue
- 2.1. Tickets
- 2.2. Foods & Beverages
- 2.3. Merchandise
- 2.4. Hospitality
- 2.5. Other Source of Revenues
USA Amusement and Theme Park Industry Segmentation By Geography
-
1. North America
- 1.1. United States
- 1.2. Canada
- 1.3. Mexico
-
2. South America
- 2.1. Brazil
- 2.2. Argentina
- 2.3. Rest of South America
-
3. Europe
- 3.1. United Kingdom
- 3.2. Germany
- 3.3. France
- 3.4. Italy
- 3.5. Spain
- 3.6. Russia
- 3.7. Benelux
- 3.8. Nordics
- 3.9. Rest of Europe
-
4. Middle East & Africa
- 4.1. Turkey
- 4.2. Israel
- 4.3. GCC
- 4.4. North Africa
- 4.5. South Africa
- 4.6. Rest of Middle East & Africa
-
5. Asia Pacific
- 5.1. China
- 5.2. India
- 5.3. Japan
- 5.4. South Korea
- 5.5. ASEAN
- 5.6. Oceania
- 5.7. Rest of Asia Pacific
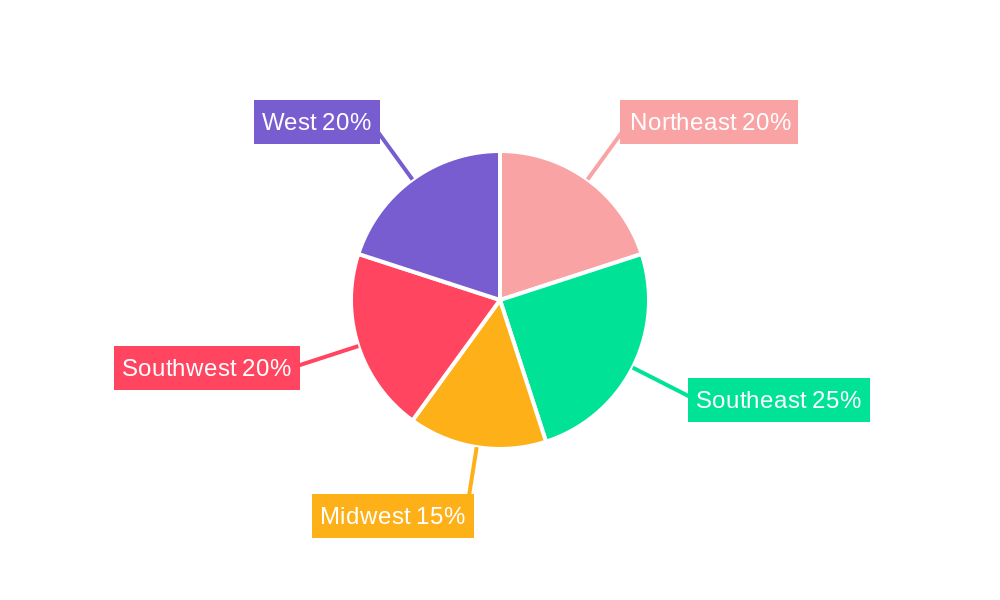
USA Amusement and Theme Park Industry Regional Market Share
Geographic Coverage of USA Amusement and Theme Park Industry
USA Amusement and Theme Park Industry REPORT HIGHLIGHTS
| Aspects | Details |
|---|---|
| Study Period | 2020-2034 |
| Base Year | 2025 |
| Estimated Year | 2026 |
| Forecast Period | 2026-2034 |
| Historical Period | 2020-2025 |
| Growth Rate | CAGR of > 3.50% from 2020-2034 |
| Segmentation |
|
Table of Contents
- 1. Introduction
- 1.1. Research Scope
- 1.2. Market Segmentation
- 1.3. Research Objective
- 1.4. Definitions and Assumptions
- 2. Executive Summary
- 2.1. Market Snapshot
- 3. Market Dynamics
- 3.1. Market Drivers
- 3.2. Market Restrains
- 3.3. Market Trends
- 3.4. Market Opportunities
- 4. Market Factor Analysis
- 4.1. Porters Five Forces
- 4.1.1. Bargaining Power of Suppliers
- 4.1.2. Bargaining Power of Buyers
- 4.1.3. Threat of New Entrants
- 4.1.4. Threat of Substitutes
- 4.1.5. Competitive Rivalry
- 4.2. PESTEL analysis
- 4.3. BCG Analysis
- 4.3.1. Stars (High Growth, High Market Share)
- 4.3.2. Cash Cows (Low Growth, High Market Share)
- 4.3.3. Question Mark (High Growth, Low Market Share)
- 4.3.4. Dogs (Low Growth, Low Market Share)
- 4.4. Ansoff Matrix Analysis
- 4.5. Supply Chain Analysis
- 4.6. Regulatory Landscape
- 4.7. Current Market Potential and Opportunity Assessment (TAM–SAM–SOM Framework)
- 4.8. MDP Analyst Note
- 4.1. Porters Five Forces
- 5. Market Analysis, Insights and Forecast 2021-2033
- 5.1. Market Analysis, Insights and Forecast - by Type
- 5.1.1. Land Rides
- 5.1.2. Water Rides
- 5.1.3. Other Types
- 5.2. Market Analysis, Insights and Forecast - by Source of Revenue
- 5.2.1. Tickets
- 5.2.2. Foods & Beverages
- 5.2.3. Merchandise
- 5.2.4. Hospitality
- 5.2.5. Other Source of Revenues
- 5.3. Market Analysis, Insights and Forecast - by Region
- 5.3.1. North America
- 5.3.2. South America
- 5.3.3. Europe
- 5.3.4. Middle East & Africa
- 5.3.5. Asia Pacific
- 5.1. Market Analysis, Insights and Forecast - by Type
- 6. Global USA Amusement and Theme Park Industry Analysis, Insights and Forecast, 2021-2033
- 6.1. Market Analysis, Insights and Forecast - by Type
- 6.1.1. Land Rides
- 6.1.2. Water Rides
- 6.1.3. Other Types
- 6.2. Market Analysis, Insights and Forecast - by Source of Revenue
- 6.2.1. Tickets
- 6.2.2. Foods & Beverages
- 6.2.3. Merchandise
- 6.2.4. Hospitality
- 6.2.5. Other Source of Revenues
- 6.1. Market Analysis, Insights and Forecast - by Type
- 7. North America USA Amusement and Theme Park Industry Analysis, Insights and Forecast, 2020-2032
- 7.1. Market Analysis, Insights and Forecast - by Type
- 7.1.1. Land Rides
- 7.1.2. Water Rides
- 7.1.3. Other Types
- 7.2. Market Analysis, Insights and Forecast - by Source of Revenue
- 7.2.1. Tickets
- 7.2.2. Foods & Beverages
- 7.2.3. Merchandise
- 7.2.4. Hospitality
- 7.2.5. Other Source of Revenues
- 7.1. Market Analysis, Insights and Forecast - by Type
- 8. South America USA Amusement and Theme Park Industry Analysis, Insights and Forecast, 2020-2032
- 8.1. Market Analysis, Insights and Forecast - by Type
- 8.1.1. Land Rides
- 8.1.2. Water Rides
- 8.1.3. Other Types
- 8.2. Market Analysis, Insights and Forecast - by Source of Revenue
- 8.2.1. Tickets
- 8.2.2. Foods & Beverages
- 8.2.3. Merchandise
- 8.2.4. Hospitality
- 8.2.5. Other Source of Revenues
- 8.1. Market Analysis, Insights and Forecast - by Type
- 9. Europe USA Amusement and Theme Park Industry Analysis, Insights and Forecast, 2020-2032
- 9.1. Market Analysis, Insights and Forecast - by Type
- 9.1.1. Land Rides
- 9.1.2. Water Rides
- 9.1.3. Other Types
- 9.2. Market Analysis, Insights and Forecast - by Source of Revenue
- 9.2.1. Tickets
- 9.2.2. Foods & Beverages
- 9.2.3. Merchandise
- 9.2.4. Hospitality
- 9.2.5. Other Source of Revenues
- 9.1. Market Analysis, Insights and Forecast - by Type
- 10. Middle East & Africa USA Amusement and Theme Park Industry Analysis, Insights and Forecast, 2020-2032
- 10.1. Market Analysis, Insights and Forecast - by Type
- 10.1.1. Land Rides
- 10.1.2. Water Rides
- 10.1.3. Other Types
- 10.2. Market Analysis, Insights and Forecast - by Source of Revenue
- 10.2.1. Tickets
- 10.2.2. Foods & Beverages
- 10.2.3. Merchandise
- 10.2.4. Hospitality
- 10.2.5. Other Source of Revenues
- 10.1. Market Analysis, Insights and Forecast - by Type
- 11. Asia Pacific USA Amusement and Theme Park Industry Analysis, Insights and Forecast, 2020-2032
- 11.1. Market Analysis, Insights and Forecast - by Type
- 11.1.1. Land Rides
- 11.1.2. Water Rides
- 11.1.3. Other Types
- 11.2. Market Analysis, Insights and Forecast - by Source of Revenue
- 11.2.1. Tickets
- 11.2.2. Foods & Beverages
- 11.2.3. Merchandise
- 11.2.4. Hospitality
- 11.2.5. Other Source of Revenues
- 11.1. Market Analysis, Insights and Forecast - by Type
- 12. Competitive Analysis
- 12.1. Company Profiles
- 12.1.1 Disney Parks
- 12.1.1.1. Company Overview
- 12.1.1.2. Products
- 12.1.1.3. Company Financials
- 12.1.1.4. SWOT Analysis
- 12.1.2 Dollywood
- 12.1.2.1. Company Overview
- 12.1.2.2. Products
- 12.1.2.3. Company Financials
- 12.1.2.4. SWOT Analysis
- 12.1.3 Universal Parks and Resorts
- 12.1.3.1. Company Overview
- 12.1.3.2. Products
- 12.1.3.3. Company Financials
- 12.1.3.4. SWOT Analysis
- 12.1.4 Silver Dollar City
- 12.1.4.1. Company Overview
- 12.1.4.2. Products
- 12.1.4.3. Company Financials
- 12.1.4.4. SWOT Analysis
- 12.1.5 Hersheypark
- 12.1.5.1. Company Overview
- 12.1.5.2. Products
- 12.1.5.3. Company Financials
- 12.1.5.4. SWOT Analysis
- 12.1.6 Six Flags Inc
- 12.1.6.1. Company Overview
- 12.1.6.2. Products
- 12.1.6.3. Company Financials
- 12.1.6.4. SWOT Analysis
- 12.1.7 Busch Garden
- 12.1.7.1. Company Overview
- 12.1.7.2. Products
- 12.1.7.3. Company Financials
- 12.1.7.4. SWOT Analysis
- 12.1.8 The Island in Pigeon Forge
- 12.1.8.1. Company Overview
- 12.1.8.2. Products
- 12.1.8.3. Company Financials
- 12.1.8.4. SWOT Analysis
- 12.1.9 Cedar Fair Entertainment Company
- 12.1.9.1. Company Overview
- 12.1.9.2. Products
- 12.1.9.3. Company Financials
- 12.1.9.4. SWOT Analysis
- 12.1.10 Magic Kingdom Park
- 12.1.10.1. Company Overview
- 12.1.10.2. Products
- 12.1.10.3. Company Financials
- 12.1.10.4. SWOT Analysis
- 12.1.11 Dells Waterpark**List Not Exhaustive
- 12.1.11.1. Company Overview
- 12.1.11.2. Products
- 12.1.11.3. Company Financials
- 12.1.11.4. SWOT Analysis
- 12.1.12 Seaworld Parks and Entertainment
- 12.1.12.1. Company Overview
- 12.1.12.2. Products
- 12.1.12.3. Company Financials
- 12.1.12.4. SWOT Analysis
- 12.1.1 Disney Parks
- 12.2. Market Entropy
- 12.2.1 Company's Key Areas Served
- 12.2.2 Recent Developments
- 12.3. Company Market Share Analysis 2025
- 12.3.1 Top 5 Companies Market Share Analysis
- 12.3.2 Top 3 Companies Market Share Analysis
- 12.4. List of Potential Customers
- 13. Research Methodology
List of Figures
- Figure 1: Global USA Amusement and Theme Park Industry Revenue Breakdown (Million, %) by Region 2025 & 2033
- Figure 2: North America USA Amusement and Theme Park Industry Revenue (Million), by Type 2025 & 2033
- Figure 3: North America USA Amusement and Theme Park Industry Revenue Share (%), by Type 2025 & 2033
- Figure 4: North America USA Amusement and Theme Park Industry Revenue (Million), by Source of Revenue 2025 & 2033
- Figure 5: North America USA Amusement and Theme Park Industry Revenue Share (%), by Source of Revenue 2025 & 2033
- Figure 6: North America USA Amusement and Theme Park Industry Revenue (Million), by Country 2025 & 2033
- Figure 7: North America USA Amusement and Theme Park Industry Revenue Share (%), by Country 2025 & 2033
- Figure 8: South America USA Amusement and Theme Park Industry Revenue (Million), by Type 2025 & 2033
- Figure 9: South America USA Amusement and Theme Park Industry Revenue Share (%), by Type 2025 & 2033
- Figure 10: South America USA Amusement and Theme Park Industry Revenue (Million), by Source of Revenue 2025 & 2033
- Figure 11: South America USA Amusement and Theme Park Industry Revenue Share (%), by Source of Revenue 2025 & 2033
- Figure 12: South America USA Amusement and Theme Park Industry Revenue (Million), by Country 2025 & 2033
- Figure 13: South America USA Amusement and Theme Park Industry Revenue Share (%), by Country 2025 & 2033
- Figure 14: Europe USA Amusement and Theme Park Industry Revenue (Million), by Type 2025 & 2033
- Figure 15: Europe USA Amusement and Theme Park Industry Revenue Share (%), by Type 2025 & 2033
- Figure 16: Europe USA Amusement and Theme Park Industry Revenue (Million), by Source of Revenue 2025 & 2033
- Figure 17: Europe USA Amusement and Theme Park Industry Revenue Share (%), by Source of Revenue 2025 & 2033
- Figure 18: Europe USA Amusement and Theme Park Industry Revenue (Million), by Country 2025 & 2033
- Figure 19: Europe USA Amusement and Theme Park Industry Revenue Share (%), by Country 2025 & 2033
- Figure 20: Middle East & Africa USA Amusement and Theme Park Industry Revenue (Million), by Type 2025 & 2033
- Figure 21: Middle East & Africa USA Amusement and Theme Park Industry Revenue Share (%), by Type 2025 & 2033
- Figure 22: Middle East & Africa USA Amusement and Theme Park Industry Revenue (Million), by Source of Revenue 2025 & 2033
- Figure 23: Middle East & Africa USA Amusement and Theme Park Industry Revenue Share (%), by Source of Revenue 2025 & 2033
- Figure 24: Middle East & Africa USA Amusement and Theme Park Industry Revenue (Million), by Country 2025 & 2033
- Figure 25: Middle East & Africa USA Amusement and Theme Park Industry Revenue Share (%), by Country 2025 & 2033
- Figure 26: Asia Pacific USA Amusement and Theme Park Industry Revenue (Million), by Type 2025 & 2033
- Figure 27: Asia Pacific USA Amusement and Theme Park Industry Revenue Share (%), by Type 2025 & 2033
- Figure 28: Asia Pacific USA Amusement and Theme Park Industry Revenue (Million), by Source of Revenue 2025 & 2033
- Figure 29: Asia Pacific USA Amusement and Theme Park Industry Revenue Share (%), by Source of Revenue 2025 & 2033
- Figure 30: Asia Pacific USA Amusement and Theme Park Industry Revenue (Million), by Country 2025 & 2033
- Figure 31: Asia Pacific USA Amusement and Theme Park Industry Revenue Share (%), by Country 2025 & 2033
List of Tables
- Table 1: Global USA Amusement and Theme Park Industry Revenue Million Forecast, by Type 2020 & 2033
- Table 2: Global USA Amusement and Theme Park Industry Revenue Million Forecast, by Source of Revenue 2020 & 2033
- Table 3: Global USA Amusement and Theme Park Industry Revenue Million Forecast, by Region 2020 & 2033
- Table 4: Global USA Amusement and Theme Park Industry Revenue Million Forecast, by Type 2020 & 2033
- Table 5: Global USA Amusement and Theme Park Industry Revenue Million Forecast, by Source of Revenue 2020 & 2033
- Table 6: Global USA Amusement and Theme Park Industry Revenue Million Forecast, by Country 2020 & 2033
- Table 7: United States USA Amusement and Theme Park Industry Revenue (Million) Forecast, by Application 2020 & 2033
- Table 8: Canada USA Amusement and Theme Park Industry Revenue (Million) Forecast, by Application 2020 & 2033
- Table 9: Mexico USA Amusement and Theme Park Industry Revenue (Million) Forecast, by Application 2020 & 2033
- Table 10: Global USA Amusement and Theme Park Industry Revenue Million Forecast, by Type 2020 & 2033
- Table 11: Global USA Amusement and Theme Park Industry Revenue Million Forecast, by Source of Revenue 2020 & 2033
- Table 12: Global USA Amusement and Theme Park Industry Revenue Million Forecast, by Country 2020 & 2033
- Table 13: Brazil USA Amusement and Theme Park Industry Revenue (Million) Forecast, by Application 2020 & 2033
- Table 14: Argentina USA Amusement and Theme Park Industry Revenue (Million) Forecast, by Application 2020 & 2033
- Table 15: Rest of South America USA Amusement and Theme Park Industry Revenue (Million) Forecast, by Application 2020 & 2033
- Table 16: Global USA Amusement and Theme Park Industry Revenue Million Forecast, by Type 2020 & 2033
- Table 17: Global USA Amusement and Theme Park Industry Revenue Million Forecast, by Source of Revenue 2020 & 2033
- Table 18: Global USA Amusement and Theme Park Industry Revenue Million Forecast, by Country 2020 & 2033
- Table 19: United Kingdom USA Amusement and Theme Park Industry Revenue (Million) Forecast, by Application 2020 & 2033
- Table 20: Germany USA Amusement and Theme Park Industry Revenue (Million) Forecast, by Application 2020 & 2033
- Table 21: France USA Amusement and Theme Park Industry Revenue (Million) Forecast, by Application 2020 & 2033
- Table 22: Italy USA Amusement and Theme Park Industry Revenue (Million) Forecast, by Application 2020 & 2033
- Table 23: Spain USA Amusement and Theme Park Industry Revenue (Million) Forecast, by Application 2020 & 2033
- Table 24: Russia USA Amusement and Theme Park Industry Revenue (Million) Forecast, by Application 2020 & 2033
- Table 25: Benelux USA Amusement and Theme Park Industry Revenue (Million) Forecast, by Application 2020 & 2033
- Table 26: Nordics USA Amusement and Theme Park Industry Revenue (Million) Forecast, by Application 2020 & 2033
- Table 27: Rest of Europe USA Amusement and Theme Park Industry Revenue (Million) Forecast, by Application 2020 & 2033
- Table 28: Global USA Amusement and Theme Park Industry Revenue Million Forecast, by Type 2020 & 2033
- Table 29: Global USA Amusement and Theme Park Industry Revenue Million Forecast, by Source of Revenue 2020 & 2033
- Table 30: Global USA Amusement and Theme Park Industry Revenue Million Forecast, by Country 2020 & 2033
- Table 31: Turkey USA Amusement and Theme Park Industry Revenue (Million) Forecast, by Application 2020 & 2033
- Table 32: Israel USA Amusement and Theme Park Industry Revenue (Million) Forecast, by Application 2020 & 2033
- Table 33: GCC USA Amusement and Theme Park Industry Revenue (Million) Forecast, by Application 2020 & 2033
- Table 34: North Africa USA Amusement and Theme Park Industry Revenue (Million) Forecast, by Application 2020 & 2033
- Table 35: South Africa USA Amusement and Theme Park Industry Revenue (Million) Forecast, by Application 2020 & 2033
- Table 36: Rest of Middle East & Africa USA Amusement and Theme Park Industry Revenue (Million) Forecast, by Application 2020 & 2033
- Table 37: Global USA Amusement and Theme Park Industry Revenue Million Forecast, by Type 2020 & 2033
- Table 38: Global USA Amusement and Theme Park Industry Revenue Million Forecast, by Source of Revenue 2020 & 2033
- Table 39: Global USA Amusement and Theme Park Industry Revenue Million Forecast, by Country 2020 & 2033
- Table 40: China USA Amusement and Theme Park Industry Revenue (Million) Forecast, by Application 2020 & 2033
- Table 41: India USA Amusement and Theme Park Industry Revenue (Million) Forecast, by Application 2020 & 2033
- Table 42: Japan USA Amusement and Theme Park Industry Revenue (Million) Forecast, by Application 2020 & 2033
- Table 43: South Korea USA Amusement and Theme Park Industry Revenue (Million) Forecast, by Application 2020 & 2033
- Table 44: ASEAN USA Amusement and Theme Park Industry Revenue (Million) Forecast, by Application 2020 & 2033
- Table 45: Oceania USA Amusement and Theme Park Industry Revenue (Million) Forecast, by Application 2020 & 2033
- Table 46: Rest of Asia Pacific USA Amusement and Theme Park Industry Revenue (Million) Forecast, by Application 2020 & 2033
Frequently Asked Questions
1. What is the projected Compound Annual Growth Rate (CAGR) of the USA Amusement and Theme Park Industry?
The projected CAGR is approximately > 3.50%.
2. Which companies are prominent players in the USA Amusement and Theme Park Industry?
Key companies in the market include Disney Parks, Dollywood, Universal Parks and Resorts, Silver Dollar City, Hersheypark, Six Flags Inc, Busch Garden, The Island in Pigeon Forge, Cedar Fair Entertainment Company, Magic Kingdom Park, Dells Waterpark**List Not Exhaustive, Seaworld Parks and Entertainment.
3. What are the main segments of the USA Amusement and Theme Park Industry?
The market segments include Type, Source of Revenue.
4. Can you provide details about the market size?
The market size is estimated to be USD 23.77 Million as of 2022.
5. What are some drivers contributing to market growth?
The number of baby-boomer tourists is expected to increase. which will fuel the growth of the worldwide amusement park market.; Incorporating energy-saving innovations like LED lighting and solar panels.
6. What are the notable trends driving market growth?
Increase in the number of visitors in amusement and theme parks.
7. Are there any restraints impacting market growth?
Theme parks are raising admission costs and letting guests ride every ride without waiting in queue; Theme parks utilising virtual reality are becoming more and more common..
8. Can you provide examples of recent developments in the market?
September 2023: Crescent Real Estate LLC acquired the Element Orlando Universal Blvd., a 165-key hotel operated under a franchise agreement with Marriott International. Located just outside the confines of the mixed-use development known as Icon Park, Element Orlando hotel guests have immediate access to 20 acres of entertainment opportunities.
9. What pricing options are available for accessing the report?
Pricing options include single-user, multi-user, and enterprise licenses priced at USD 3800, USD 4500, and USD 5800 respectively.
10. Is the market size provided in terms of value or volume?
The market size is provided in terms of value, measured in Million.
11. Are there any specific market keywords associated with the report?
Yes, the market keyword associated with the report is "USA Amusement and Theme Park Industry," which aids in identifying and referencing the specific market segment covered.
12. How do I determine which pricing option suits my needs best?
The pricing options vary based on user requirements and access needs. Individual users may opt for single-user licenses, while businesses requiring broader access may choose multi-user or enterprise licenses for cost-effective access to the report.
13. Are there any additional resources or data provided in the USA Amusement and Theme Park Industry report?
While the report offers comprehensive insights, it's advisable to review the specific contents or supplementary materials provided to ascertain if additional resources or data are available.
14. How can I stay updated on further developments or reports in the USA Amusement and Theme Park Industry?
To stay informed about further developments, trends, and reports in the USA Amusement and Theme Park Industry, consider subscribing to industry newsletters, following relevant companies and organizations, or regularly checking reputable industry news sources and publications.
Methodology
Step 1 - Identification of Relevant Samples Size from Population Database


Step 2 - Approaches for Defining Global Market Size (Value, Volume* & Price*)

Note*: In applicable scenarios
Step 3 - Data Sources
Primary Research
- Web Analytics
- Survey Reports
- Research Institute
- Latest Research Reports
- Opinion Leaders
Secondary Research
- Annual Reports
- White Paper
- Latest Press Release
- Industry Association
- Paid Database
- Investor Presentations

Step 4 - Data Triangulation
Involves using different sources of information in order to increase the validity of a study
These sources are likely to be stakeholders in a program - participants, other researchers, program staff, other community members, and so on.
Then we put all data in single framework & apply various statistical tools to find out the dynamic on the market.
During the analysis stage, feedback from the stakeholder groups would be compared to determine areas of agreement as well as areas of divergence