

Key Insights
The Asia-Pacific amusement park market is poised for significant expansion, driven by increasing disposable incomes, rapid urbanization, and a growing demand for leisure and entertainment. The market, projected to reach 40687.9 million by 2024, is anticipated to grow at a Compound Annual Growth Rate (CAGR) of 8.8% from the base year 2024 through 2033. This growth is propelled by substantial investments in new parks and attractions, particularly in key markets like China and Japan. The integration of advanced technologies such as virtual and augmented reality is enhancing visitor experiences and broadening appeal across diverse demographics. While mechanical and water rides remain popular, innovative attractions are emerging as a key growth driver. The 19-35 age demographic currently leads revenue contribution, though all age groups show increasing engagement. Park operators are diversifying revenue streams through enhanced food and beverage offerings, merchandise, and integrated resort packages to ensure sustained profitability.
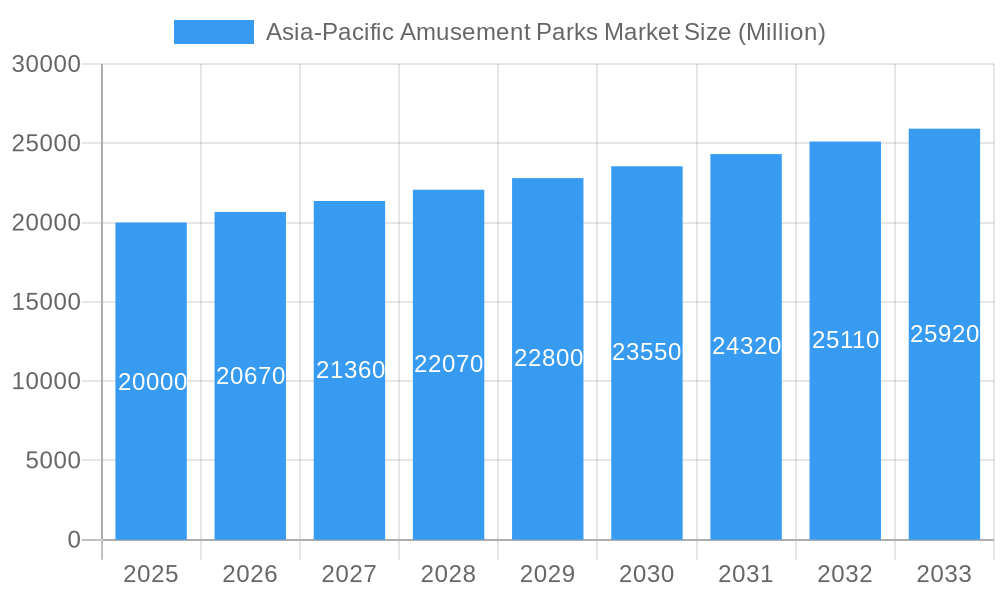
Asia-Pacific Amusement Parks Market Market Size (In Billion)
Despite a positive market outlook, operators face challenges including intense competition, rising operational costs, and evolving government regulations concerning safety and environmental impact. Future success hinges on effectively navigating these challenges and adapting to changing consumer preferences. Strategic expansion into secondary cities, coupled with marketing initiatives emphasizing experiential value beyond rides, will be crucial for sustained growth. The competitive landscape is dominated by established brands such as Tokyo Disneyland and Shanghai Disneyland, which leverage strong brand equity. However, innovative new entrants pose a significant competitive challenge. A thorough understanding of regional demographics, economic trends, and leisure patterns is essential for market success.
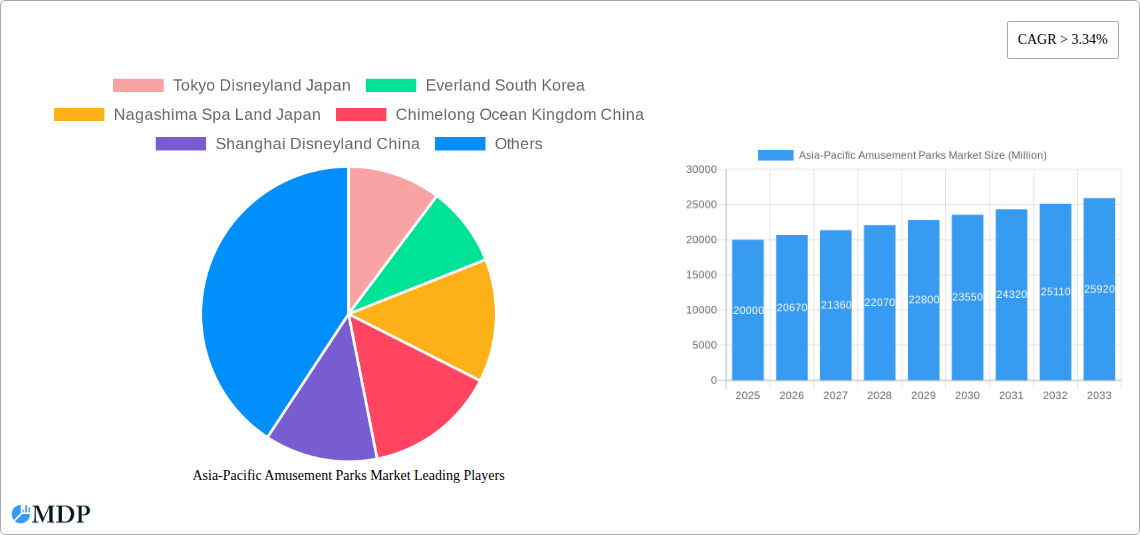
Asia-Pacific Amusement Parks Market Company Market Share
Asia-Pacific Amusement Parks Market Analysis: 2024-2033
This comprehensive report provides an in-depth analysis of the Asia-Pacific amusement parks market, covering market dynamics, key trends, and future projections from 2024 to 2033. It examines critical market segments, leading players, and significant industry developments, offering valuable insights for investors and stakeholders. Utilizing a robust methodology, the report incorporates historical data, a base year of 2024, and forecasts through 2033, estimating a market size of 40687.9 million by the end of the forecast period with a CAGR of 8.8%.
Asia-Pacific Amusement Parks Market Market Dynamics & Concentration
The Asia-Pacific amusement parks market exhibits a dynamic landscape shaped by several key factors. Market concentration is moderately high, with a few major players like Tokyo Disneyland and Shanghai Disneyland commanding significant market share. However, the emergence of regional players and independent parks fosters competition. Innovation is a critical driver, with parks continuously introducing new rides, technologies, and themed experiences to attract visitors. Regulatory frameworks, varying across countries, influence operational costs and expansion strategies. Product substitutes, such as virtual reality experiences and home entertainment options, exert some competitive pressure. End-user trends, including a growing preference for immersive and interactive experiences, are shaping park development. M&A activities, such as PAG's acquisition of a Japanese theme park in August 2022, demonstrate consolidation and capital investment within the sector.
- Market Concentration: While exact figures are proprietary, the market exhibits moderate concentration with a top five players holding an estimated xx% market share in 2025.
- M&A Activity: The number of M&A deals in the period 2019-2024 totaled xx, indicating a growing trend of consolidation.
- Innovation Drivers: Technological advancements in ride design, augmented reality, and virtual reality are key drivers.
- Regulatory Impact: Variations in safety regulations and licensing requirements across the region significantly impact operational costs.
Asia-Pacific Amusement Parks Market Industry Trends & Analysis
The Asia-Pacific amusement parks market is experiencing robust growth, driven by several factors. Rising disposable incomes, particularly in emerging economies, fuel increased spending on leisure and entertainment. Technological advancements, like immersive VR experiences and advanced ride technologies, are enhancing the visitor experience and driving attendance. A shift in consumer preferences towards unique, themed experiences, and interactive attractions is shaping park development. Competitive dynamics are intense, with established players constantly innovating to maintain market share while new entrants strive to gain a foothold. The market is projected to exhibit a Compound Annual Growth Rate (CAGR) of xx% during the forecast period (2025-2033), with market penetration expected to reach xx% by 2033. However, challenges such as pandemic-related disruptions and evolving consumer preferences need careful consideration.
Leading Markets & Segments in Asia-Pacific Amusement Parks Market
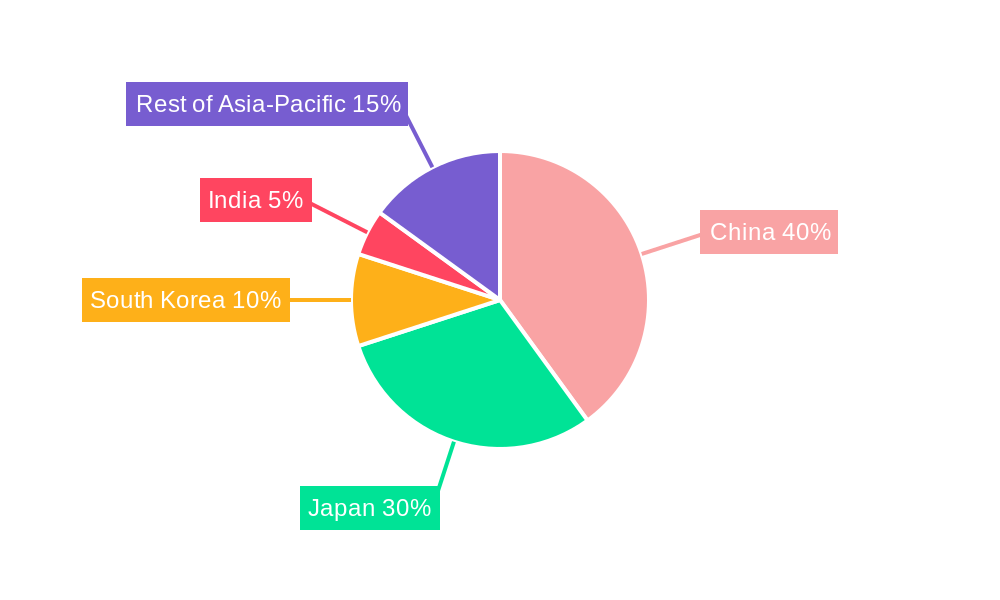
Japan and China dominate the Asia-Pacific amusement park market, owing to their large populations, developed infrastructure, and strong tourism sectors. Within these countries, major cities with established tourism hubs attract the largest number of visitors and generate the highest revenue.
- By Country: Japan and China are the leading markets, followed by other countries in the Rest of Asia-Pacific region including South Korea and India.
- By Rides: Mechanical rides represent the largest segment by revenue, followed by water rides and other rides. Technological advancements in mechanical rides drive its dominance.
- By Age: The 19-35 age group contributes the largest share of revenue, followed closely by the under-18 group. This highlights the importance of appealing to the youth market.
- By Revenue Source: Ticket sales constitute the primary revenue source, followed by food and beverages, merchandise, and hotels/resorts. This indicates opportunities for revenue diversification strategies through ancillary businesses.
Key drivers for these dominant markets and segments include robust tourism infrastructure, favorable government policies supporting the tourism sector, and significant investments in new theme park developments. Japan's established theme park culture and China's rapid economic growth significantly contribute to their dominance.
Asia-Pacific Amusement Parks Market Product Developments
Recent product innovations include the integration of augmented reality (AR) and virtual reality (VR) technologies into rides and attractions, enhancing the immersive experience for visitors. The development of more sophisticated and thrilling mechanical rides, coupled with unique theming and storytelling, provides a competitive advantage. These innovative offerings cater to evolving consumer preferences for interactive and technologically advanced entertainment. The successful integration of these technologies is pivotal for enhancing customer experience and generating higher revenue streams.
Key Drivers of Asia-Pacific Amusement Parks Market Growth
Several factors contribute to the growth of the Asia-Pacific amusement parks market. The rising disposable incomes in many Asian countries are fueling increased spending on leisure and entertainment. Technological advancements enhance the visitor experience and attract wider audiences. Favorable government policies that promote tourism and recreation provide a supportive regulatory environment. The strategic investments made by major players in building state-of-the-art facilities and expanding into new markets also drive growth.
Challenges in the Asia-Pacific Amusement Parks Market Market
The Asia-Pacific amusement park market faces various challenges. Stringent safety regulations and licensing procedures can increase operational costs. The seasonality of the tourism industry can impact revenue streams. Intense competition from existing and new players can exert significant pressure. Supply chain disruptions can impact the availability of equipment and materials necessary for park operations and maintenance. These factors can collectively affect the profitability and sustainability of amusement parks.
Emerging Opportunities in Asia-Pacific Amusement Parks Market
The Asia-Pacific amusement parks market presents exciting long-term growth opportunities. The integration of new technologies, such as AI-powered interactive elements and personalized experiences, holds significant potential. Strategic partnerships between theme park operators and other entertainment companies can create unique and synergistic offerings. Expanding into untapped markets within the region, targeting growing tourism hubs and developing economies, offers significant potential for market expansion.
Leading Players in the Asia-Pacific Amusement Parks Market Sector
- Tokyo Disneyland Japan
- Everland South Korea
- Nagashima Spa Land Japan
- Chimelong Ocean Kingdom China
- Shanghai Disneyland China
- OCT Happy Valley Beijing China
- Chimelong Paradise China
- OCT Happy Valley Shenzhen China
- Universal Studios Japan
- Tokyo Disneysea Japan
Key Milestones in Asia-Pacific Amusement Parks Market Industry
- November 2022: The Walt Disney Company Asia Pacific expanded its collaboration with Kodansha to include Japanese anime, indicating a diversification strategy and leveraging popular Japanese culture.
- August 2022: PAG's acquisition of a Japanese theme park for USD 720 Million signals increased investor interest and consolidation within the market, driven by post-pandemic recovery.
Strategic Outlook for Asia-Pacific Amusement Parks Market Market
The future of the Asia-Pacific amusement parks market looks promising. Continued technological advancements, strategic partnerships, and expansion into new markets will drive growth. Focusing on immersive experiences, personalized services, and sustainable practices will be crucial for success. The market presents significant potential for growth, especially with the increasing disposable income and the desire for unique entertainment experiences in the region.
Asia-Pacific Amusement Parks Market Segmentation
-
1. Rides
- 1.1. Mechanical Rides
- 1.2. Water Rides
- 1.3. Other Rides
-
2. Age
- 2.1. Upto 18 years
- 2.2. 19 to 35 years
- 2.3. 36 to 50 years
- 2.4. 51 to 65 years
- 2.5. More than 65 years
-
3. Revenue Source
- 3.1. Tickets
- 3.2. Food & Beverages
- 3.3. Merchandise
- 3.4. Hotels/Resorts
- 3.5. Others
Asia-Pacific Amusement Parks Market Segmentation By Geography
-
1. Asia Pacific
- 1.1. China
- 1.2. Japan
- 1.3. South Korea
- 1.4. India
- 1.5. Australia
- 1.6. New Zealand
- 1.7. Indonesia
- 1.8. Malaysia
- 1.9. Singapore
- 1.10. Thailand
- 1.11. Vietnam
- 1.12. Philippines
Asia-Pacific Amusement Parks Market Regional Market Share
Geographic Coverage of Asia-Pacific Amusement Parks Market
Asia-Pacific Amusement Parks Market REPORT HIGHLIGHTS
| Aspects | Details |
|---|---|
| Study Period | 2020-2034 |
| Base Year | 2025 |
| Estimated Year | 2026 |
| Forecast Period | 2026-2034 |
| Historical Period | 2020-2025 |
| Growth Rate | CAGR of 8.8% from 2020-2034 |
| Segmentation |
|
Table of Contents
- 1. Introduction
- 1.1. Research Scope
- 1.2. Market Segmentation
- 1.3. Research Objective
- 1.4. Definitions and Assumptions
- 2. Executive Summary
- 2.1. Market Snapshot
- 3. Market Dynamics
- 3.1. Market Drivers
- 3.2. Market Restrains
- 3.3. Market Trends
- 3.4. Market Opportunities
- 4. Market Factor Analysis
- 4.1. Porters Five Forces
- 4.1.1. Bargaining Power of Suppliers
- 4.1.2. Bargaining Power of Buyers
- 4.1.3. Threat of New Entrants
- 4.1.4. Threat of Substitutes
- 4.1.5. Competitive Rivalry
- 4.2. PESTEL analysis
- 4.3. BCG Analysis
- 4.3.1. Stars (High Growth, High Market Share)
- 4.3.2. Cash Cows (Low Growth, High Market Share)
- 4.3.3. Question Mark (High Growth, Low Market Share)
- 4.3.4. Dogs (Low Growth, Low Market Share)
- 4.4. Ansoff Matrix Analysis
- 4.5. Supply Chain Analysis
- 4.6. Regulatory Landscape
- 4.7. Current Market Potential and Opportunity Assessment (TAM–SAM–SOM Framework)
- 4.8. MDP Analyst Note
- 4.1. Porters Five Forces
- 5. Market Analysis, Insights and Forecast 2021-2033
- 5.1. Market Analysis, Insights and Forecast - by Rides
- 5.1.1. Mechanical Rides
- 5.1.2. Water Rides
- 5.1.3. Other Rides
- 5.2. Market Analysis, Insights and Forecast - by Age
- 5.2.1. Upto 18 years
- 5.2.2. 19 to 35 years
- 5.2.3. 36 to 50 years
- 5.2.4. 51 to 65 years
- 5.2.5. More than 65 years
- 5.3. Market Analysis, Insights and Forecast - by Revenue Source
- 5.3.1. Tickets
- 5.3.2. Food & Beverages
- 5.3.3. Merchandise
- 5.3.4. Hotels/Resorts
- 5.3.5. Others
- 5.4. Market Analysis, Insights and Forecast - by Region
- 5.4.1. Asia Pacific
- 5.1. Market Analysis, Insights and Forecast - by Rides
- 6. Asia-Pacific Amusement Parks Market Analysis, Insights and Forecast, 2021-2033
- 6.1. Market Analysis, Insights and Forecast - by Rides
- 6.1.1. Mechanical Rides
- 6.1.2. Water Rides
- 6.1.3. Other Rides
- 6.2. Market Analysis, Insights and Forecast - by Age
- 6.2.1. Upto 18 years
- 6.2.2. 19 to 35 years
- 6.2.3. 36 to 50 years
- 6.2.4. 51 to 65 years
- 6.2.5. More than 65 years
- 6.3. Market Analysis, Insights and Forecast - by Revenue Source
- 6.3.1. Tickets
- 6.3.2. Food & Beverages
- 6.3.3. Merchandise
- 6.3.4. Hotels/Resorts
- 6.3.5. Others
- 6.1. Market Analysis, Insights and Forecast - by Rides
- 7. Competitive Analysis
- 7.1. Company Profiles
- 7.1.1 Tokyo Disneyland Japan
- 7.1.1.1. Company Overview
- 7.1.1.2. Products
- 7.1.1.3. Company Financials
- 7.1.1.4. SWOT Analysis
- 7.1.2 Everland South Korea
- 7.1.2.1. Company Overview
- 7.1.2.2. Products
- 7.1.2.3. Company Financials
- 7.1.2.4. SWOT Analysis
- 7.1.3 Nagashima Spa Land Japan
- 7.1.3.1. Company Overview
- 7.1.3.2. Products
- 7.1.3.3. Company Financials
- 7.1.3.4. SWOT Analysis
- 7.1.4 Chimelong Ocean Kingdom China
- 7.1.4.1. Company Overview
- 7.1.4.2. Products
- 7.1.4.3. Company Financials
- 7.1.4.4. SWOT Analysis
- 7.1.5 Shanghai Disneyland China
- 7.1.5.1. Company Overview
- 7.1.5.2. Products
- 7.1.5.3. Company Financials
- 7.1.5.4. SWOT Analysis
- 7.1.6 OCT Happy Valley Beijing China
- 7.1.6.1. Company Overview
- 7.1.6.2. Products
- 7.1.6.3. Company Financials
- 7.1.6.4. SWOT Analysis
- 7.1.7 Chimelong Paradise China
- 7.1.7.1. Company Overview
- 7.1.7.2. Products
- 7.1.7.3. Company Financials
- 7.1.7.4. SWOT Analysis
- 7.1.8 OCT Happy Valley Shenzhen China**List Not Exhaustive
- 7.1.8.1. Company Overview
- 7.1.8.2. Products
- 7.1.8.3. Company Financials
- 7.1.8.4. SWOT Analysis
- 7.1.9 Universal Studios Japan
- 7.1.9.1. Company Overview
- 7.1.9.2. Products
- 7.1.9.3. Company Financials
- 7.1.9.4. SWOT Analysis
- 7.1.10 Tokyo Disneysea Japan
- 7.1.10.1. Company Overview
- 7.1.10.2. Products
- 7.1.10.3. Company Financials
- 7.1.10.4. SWOT Analysis
- 7.1.1 Tokyo Disneyland Japan
- 7.2. Market Entropy
- 7.2.1 Company's Key Areas Served
- 7.2.2 Recent Developments
- 7.3. Company Market Share Analysis 2025
- 7.3.1 Top 5 Companies Market Share Analysis
- 7.3.2 Top 3 Companies Market Share Analysis
- 7.4. List of Potential Customers
- 8. Research Methodology
List of Figures
- Figure 1: Asia-Pacific Amusement Parks Market Revenue Breakdown (million, %) by Product 2025 & 2033
- Figure 2: Asia-Pacific Amusement Parks Market Share (%) by Company 2025
List of Tables
- Table 1: Asia-Pacific Amusement Parks Market Revenue million Forecast, by Rides 2020 & 2033
- Table 2: Asia-Pacific Amusement Parks Market Revenue million Forecast, by Age 2020 & 2033
- Table 3: Asia-Pacific Amusement Parks Market Revenue million Forecast, by Revenue Source 2020 & 2033
- Table 4: Asia-Pacific Amusement Parks Market Revenue million Forecast, by Region 2020 & 2033
- Table 5: Asia-Pacific Amusement Parks Market Revenue million Forecast, by Rides 2020 & 2033
- Table 6: Asia-Pacific Amusement Parks Market Revenue million Forecast, by Age 2020 & 2033
- Table 7: Asia-Pacific Amusement Parks Market Revenue million Forecast, by Revenue Source 2020 & 2033
- Table 8: Asia-Pacific Amusement Parks Market Revenue million Forecast, by Country 2020 & 2033
- Table 9: China Asia-Pacific Amusement Parks Market Revenue (million) Forecast, by Application 2020 & 2033
- Table 10: Japan Asia-Pacific Amusement Parks Market Revenue (million) Forecast, by Application 2020 & 2033
- Table 11: South Korea Asia-Pacific Amusement Parks Market Revenue (million) Forecast, by Application 2020 & 2033
- Table 12: India Asia-Pacific Amusement Parks Market Revenue (million) Forecast, by Application 2020 & 2033
- Table 13: Australia Asia-Pacific Amusement Parks Market Revenue (million) Forecast, by Application 2020 & 2033
- Table 14: New Zealand Asia-Pacific Amusement Parks Market Revenue (million) Forecast, by Application 2020 & 2033
- Table 15: Indonesia Asia-Pacific Amusement Parks Market Revenue (million) Forecast, by Application 2020 & 2033
- Table 16: Malaysia Asia-Pacific Amusement Parks Market Revenue (million) Forecast, by Application 2020 & 2033
- Table 17: Singapore Asia-Pacific Amusement Parks Market Revenue (million) Forecast, by Application 2020 & 2033
- Table 18: Thailand Asia-Pacific Amusement Parks Market Revenue (million) Forecast, by Application 2020 & 2033
- Table 19: Vietnam Asia-Pacific Amusement Parks Market Revenue (million) Forecast, by Application 2020 & 2033
- Table 20: Philippines Asia-Pacific Amusement Parks Market Revenue (million) Forecast, by Application 2020 & 2033
Frequently Asked Questions
1. What is the projected Compound Annual Growth Rate (CAGR) of the Asia-Pacific Amusement Parks Market?
The projected CAGR is approximately 8.8%.
2. Which companies are prominent players in the Asia-Pacific Amusement Parks Market?
Key companies in the market include Tokyo Disneyland Japan, Everland South Korea, Nagashima Spa Land Japan, Chimelong Ocean Kingdom China, Shanghai Disneyland China, OCT Happy Valley Beijing China, Chimelong Paradise China, OCT Happy Valley Shenzhen China**List Not Exhaustive, Universal Studios Japan, Tokyo Disneysea Japan.
3. What are the main segments of the Asia-Pacific Amusement Parks Market?
The market segments include Rides, Age, Revenue Source.
4. Can you provide details about the market size?
The market size is estimated to be USD 40687.9 million as of 2022.
5. What are some drivers contributing to market growth?
Internet Penetration is Driving the Market.
6. What are the notable trends driving market growth?
Rising Water Parks and Rides.
7. Are there any restraints impacting market growth?
Government Regulations are Restraining the Market.
8. Can you provide examples of recent developments in the market?
Nov 2022: The Walt Disney Company Asia Pacific revealed an expansion of its 70-year collaboration with publishing house Kodansha to include Japanese anime. Disney and Kodansha worked together in the publishing space and will now venture into the world of anime.
9. What pricing options are available for accessing the report?
Pricing options include single-user, multi-user, and enterprise licenses priced at USD 4750, USD 4950, and USD 6800 respectively.
10. Is the market size provided in terms of value or volume?
The market size is provided in terms of value, measured in million.
11. Are there any specific market keywords associated with the report?
Yes, the market keyword associated with the report is "Asia-Pacific Amusement Parks Market," which aids in identifying and referencing the specific market segment covered.
12. How do I determine which pricing option suits my needs best?
The pricing options vary based on user requirements and access needs. Individual users may opt for single-user licenses, while businesses requiring broader access may choose multi-user or enterprise licenses for cost-effective access to the report.
13. Are there any additional resources or data provided in the Asia-Pacific Amusement Parks Market report?
While the report offers comprehensive insights, it's advisable to review the specific contents or supplementary materials provided to ascertain if additional resources or data are available.
14. How can I stay updated on further developments or reports in the Asia-Pacific Amusement Parks Market?
To stay informed about further developments, trends, and reports in the Asia-Pacific Amusement Parks Market, consider subscribing to industry newsletters, following relevant companies and organizations, or regularly checking reputable industry news sources and publications.
Methodology
Step 1 - Identification of Relevant Samples Size from Population Database


Step 2 - Approaches for Defining Global Market Size (Value, Volume* & Price*)

Note*: In applicable scenarios
Step 3 - Data Sources
Primary Research
- Web Analytics
- Survey Reports
- Research Institute
- Latest Research Reports
- Opinion Leaders
Secondary Research
- Annual Reports
- White Paper
- Latest Press Release
- Industry Association
- Paid Database
- Investor Presentations

Step 4 - Data Triangulation
Involves using different sources of information in order to increase the validity of a study
These sources are likely to be stakeholders in a program - participants, other researchers, program staff, other community members, and so on.
Then we put all data in single framework & apply various statistical tools to find out the dynamic on the market.
During the analysis stage, feedback from the stakeholder groups would be compared to determine areas of agreement as well as areas of divergence