

Key Insights
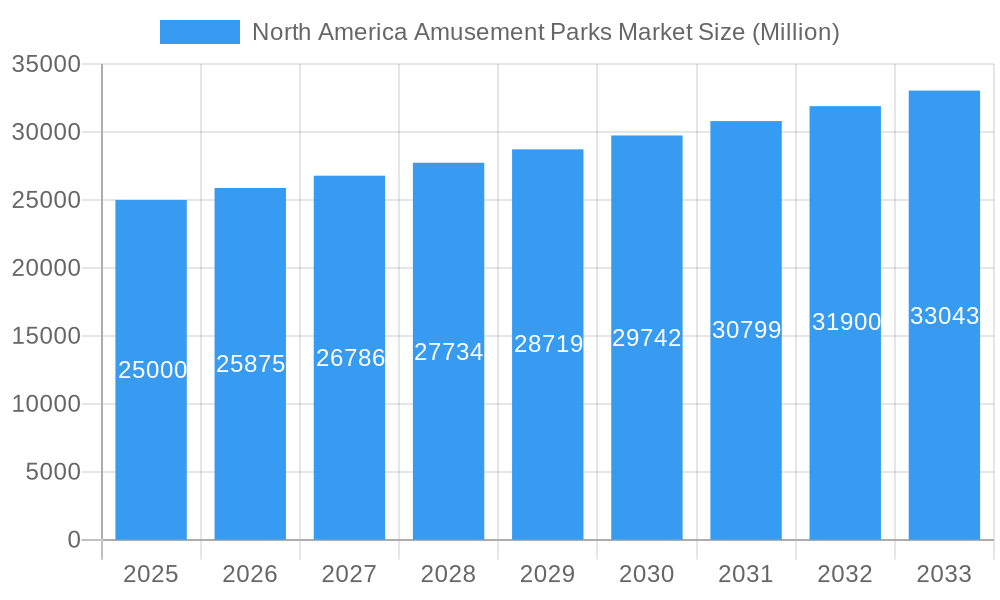
The North America Amusement Park Market is poised for substantial expansion, with a projected market size of 33.3 billion. Fueled by a Compound Annual Growth Rate (CAGR) of 29.8% from a base year of 2025, this growth is attributed to increasing disposable incomes and leisure time, driving demand for entertainment. Technological advancements in ride design and immersive experiences, including VR and AR integration, are enhancing guest engagement and justifying premium pricing. Strategic marketing, partnerships with hospitality providers, and integrated package deals are also contributing to revenue growth. The market is significantly influenced by the "Upto 18 years" demographic, underscoring the importance of family-centric attractions. Primary revenue streams include ticket sales, complemented by food and beverage, merchandise, and resort packages. Key challenges include economic fluctuations impacting discretionary spending and seasonal attendance variations. Intense competition among major players like Disney, Universal Studios, and SeaWorld necessitates ongoing investment in innovation and infrastructure.
North America Amusement Parks Market Market Size (In Billion)
Geographically, the United States commands the largest share within the North America amusement park market, followed by Canada and Mexico. Emerging opportunities exist in "Rest of North America" due to infrastructure development and rising tourism. Future market success will depend on continuous innovation in park design, immersive technologies, and targeted demographic marketing. The development of themed attractions, superior guest services, and sustainable practices will be crucial for customer loyalty and market dominance. Effective cost management and strategies to mitigate seasonality are vital for sustained profitability in this dynamic sector.
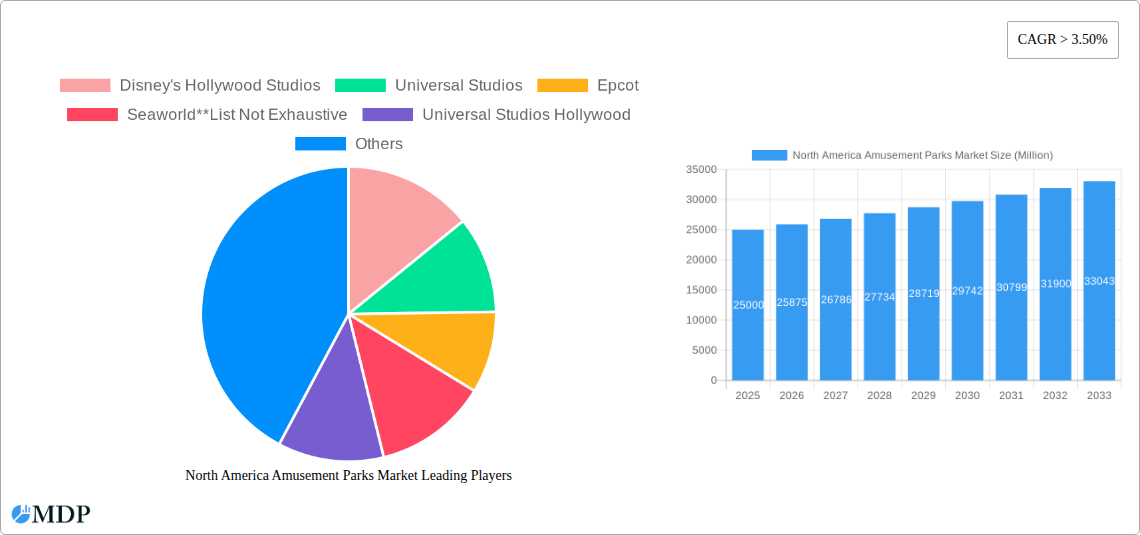
North America Amusement Parks Market Company Market Share
North America Amusement Parks Market: A Comprehensive Report (2019-2033)
This in-depth report provides a comprehensive analysis of the North America amusement parks market, encompassing market dynamics, industry trends, leading segments, key players, and future outlook. The study period covers 2019-2033, with 2025 serving as the base and estimated year. The report offers actionable insights for industry stakeholders, investors, and businesses operating within this dynamic sector. The market is projected to reach xx Million by 2033.
North America Amusement Parks Market Market Dynamics & Concentration
The North American amusement park market exhibits a concentrated landscape, dominated by major players like Disney (Magic Kingdom, Epcot, Disneyland, Disney's California Adventure, Disney's Animal Kingdom), Universal Studios (Universal Studios Hollywood, Islands of Adventure, Universal Studios), and SeaWorld. However, smaller regional players and independent parks contribute significantly to the overall market diversity. Market concentration is influenced by factors such as brand recognition, established infrastructure, and economies of scale. The market share of the top 5 players is estimated to be around 60% in 2025.
Innovation plays a crucial role, with continuous development of new rides, technologies (VR, AR), and immersive experiences driving growth. Regulatory frameworks, including safety standards and environmental regulations, significantly impact operations and investments. Product substitutes, such as alternative entertainment options (e.g., video games, streaming services), pose a competitive challenge. End-user trends, including changing demographics and preferences, necessitate adaptation in park offerings. Mergers and acquisitions (M&A) are frequent, as larger companies seek to expand their portfolio and market reach. The number of M&A deals in the sector averaged xx per year during the historical period (2019-2024).
- Market Concentration: High, with major players holding significant market share.
- Innovation Drivers: Technological advancements, new ride concepts, immersive experiences.
- Regulatory Framework: Stringent safety and environmental standards.
- Product Substitutes: Alternative entertainment options.
- End-User Trends: Shifting demographics and evolving preferences.
- M&A Activity: Frequent acquisitions to expand market presence.
North America Amusement Parks Market Industry Trends & Analysis
The North American amusement park market is experiencing robust growth, driven by several factors. Rising disposable incomes, increased tourism, and a growing preference for leisure activities contribute significantly to market expansion. Technological advancements, such as virtual and augmented reality integration, enhance the visitor experience and attract a broader audience. Consumer preferences are shifting towards immersive and interactive experiences, prompting parks to innovate continuously. Competitive dynamics are intense, with major players investing heavily in new attractions and enhancing their offerings to maintain market share. The CAGR for the market during the forecast period (2025-2033) is projected to be xx%. Market penetration of VR/AR technologies in amusement parks is estimated at xx% in 2025, expected to grow to xx% by 2033.
The industry is also witnessing the integration of data analytics and personalized marketing strategies to enhance visitor engagement and optimize revenue generation. However, challenges persist, such as seasonality, fluctuating economic conditions, and the need to adapt to changing consumer preferences.
Leading Markets & Segments in North America Amusement Parks Market
The United States dominates the North American amusement park market, accounting for the largest share of revenue and visitor numbers. Mexico and Canada follow, with significant regional variations in market dynamics.
By Rides: Mechanical rides constitute the largest segment, followed by water rides and other attractions.
By Age: The 19-35 years age group represents the largest segment, followed by the under-18 age group.
By Revenue: Ticket sales form the primary revenue stream, complemented by food and beverage sales, merchandise, hotels/resorts, and other ancillary revenue sources.
- Key Drivers (United States): Strong tourism infrastructure, high disposable incomes, diverse attractions.
- Key Drivers (Canada): Growing tourism sector, government initiatives supporting leisure and tourism.
- Key Drivers (Mexico): Increasing domestic tourism, proximity to US markets.
North America Amusement Parks Market Product Developments
Recent product innovations focus on enhancing visitor experience through technological integration. Virtual reality (VR) and augmented reality (AR) rides, interactive games, and immersive shows are gaining popularity. These advancements cater to evolving consumer preferences for engaging and unique experiences, offering a competitive advantage to parks that adopt these technologies quickly. The integration of mobile applications for ticketing, navigation, and personalized offers further streamlines the visitor journey.
Key Drivers of North America Amusement Parks Market Growth
Technological advancements, notably VR/AR integration, create immersive experiences, driving visitor numbers. Economic growth and rising disposable incomes contribute to increased leisure spending. Favorable government policies and infrastructure development facilitate tourism growth, supporting the sector.
Challenges in the North America Amusement Parks Market Market
Seasonality significantly impacts revenue streams. Fluctuations in economic conditions affect consumer spending patterns. Intense competition necessitates continuous innovation and investment to remain competitive. Supply chain disruptions can impact operations and maintenance.
Emerging Opportunities in North America Amusement Parks Market
Expansion into niche markets, such as family-oriented parks or adventure-themed attractions, offers growth potential. Strategic partnerships with technology companies can lead to innovative offerings. Expansion into underserved geographical areas presents opportunities for market penetration.
Leading Players in the North America Amusement Parks Market Sector
- Disney
- Universal Studios
- SeaWorld
- Six Flags (List Not Exhaustive)
Key Milestones in North America Amusement Parks Market Industry
- July 2022: Five Star Parks & Attractions acquired three Malibu Jack's Indoor Theme Parks. This indicates consolidation in the smaller parks segment.
- January 2023: Delaware North's acquisition of the Best Western Premier Grand Canyon Squire Inn signifies expansion in the lodging sector within the amusement park ecosystem.
Strategic Outlook for North America Amusement Parks Market Market
The North America amusement parks market exhibits significant growth potential, driven by technological innovations, evolving consumer preferences, and increasing tourism. Strategic investments in immersive technologies, expansion into new markets, and diversification of revenue streams will be crucial for sustained success in this competitive landscape. The focus on enhancing the guest experience and leveraging data analytics for personalized services will be pivotal.
North America Amusement Parks Market Segmentation
-
1. Rides
- 1.1. Mechanical Rides
- 1.2. Water Rides
- 1.3. Other Rides
-
2. Age
- 2.1. Upto 18 years
- 2.2. 19 to 35 years
- 2.3. 36 to 50 years
- 2.4. 51 to 65 years
- 2.5. More than 65 years
-
3. Revenue
- 3.1. Tickets
- 3.2. Food & Beverages
- 3.3. Merchandise
- 3.4. Hotels/Resorts
- 3.5. Other Revenues
North America Amusement Parks Market Segmentation By Geography
-
1. North America
- 1.1. United States
- 1.2. Canada
- 1.3. Mexico
North America Amusement Parks Market Regional Market Share
Geographic Coverage of North America Amusement Parks Market
North America Amusement Parks Market REPORT HIGHLIGHTS
| Aspects | Details |
|---|---|
| Study Period | 2020-2034 |
| Base Year | 2025 |
| Estimated Year | 2026 |
| Forecast Period | 2026-2034 |
| Historical Period | 2020-2025 |
| Growth Rate | CAGR of 29.8% from 2020-2034 |
| Segmentation |
|
Table of Contents
- 1. Introduction
- 1.1. Research Scope
- 1.2. Market Segmentation
- 1.3. Research Objective
- 1.4. Definitions and Assumptions
- 2. Executive Summary
- 2.1. Market Snapshot
- 3. Market Dynamics
- 3.1. Market Drivers
- 3.2. Market Restrains
- 3.3. Market Trends
- 3.4. Market Opportunities
- 4. Market Factor Analysis
- 4.1. Porters Five Forces
- 4.1.1. Bargaining Power of Suppliers
- 4.1.2. Bargaining Power of Buyers
- 4.1.3. Threat of New Entrants
- 4.1.4. Threat of Substitutes
- 4.1.5. Competitive Rivalry
- 4.2. PESTEL analysis
- 4.3. BCG Analysis
- 4.3.1. Stars (High Growth, High Market Share)
- 4.3.2. Cash Cows (Low Growth, High Market Share)
- 4.3.3. Question Mark (High Growth, Low Market Share)
- 4.3.4. Dogs (Low Growth, Low Market Share)
- 4.4. Ansoff Matrix Analysis
- 4.5. Supply Chain Analysis
- 4.6. Regulatory Landscape
- 4.7. Current Market Potential and Opportunity Assessment (TAM–SAM–SOM Framework)
- 4.8. MDP Analyst Note
- 4.1. Porters Five Forces
- 5. Market Analysis, Insights and Forecast 2021-2033
- 5.1. Market Analysis, Insights and Forecast - by Rides
- 5.1.1. Mechanical Rides
- 5.1.2. Water Rides
- 5.1.3. Other Rides
- 5.2. Market Analysis, Insights and Forecast - by Age
- 5.2.1. Upto 18 years
- 5.2.2. 19 to 35 years
- 5.2.3. 36 to 50 years
- 5.2.4. 51 to 65 years
- 5.2.5. More than 65 years
- 5.3. Market Analysis, Insights and Forecast - by Revenue
- 5.3.1. Tickets
- 5.3.2. Food & Beverages
- 5.3.3. Merchandise
- 5.3.4. Hotels/Resorts
- 5.3.5. Other Revenues
- 5.4. Market Analysis, Insights and Forecast - by Region
- 5.4.1. North America
- 5.1. Market Analysis, Insights and Forecast - by Rides
- 6. North America Amusement Parks Market Analysis, Insights and Forecast, 2021-2033
- 6.1. Market Analysis, Insights and Forecast - by Rides
- 6.1.1. Mechanical Rides
- 6.1.2. Water Rides
- 6.1.3. Other Rides
- 6.2. Market Analysis, Insights and Forecast - by Age
- 6.2.1. Upto 18 years
- 6.2.2. 19 to 35 years
- 6.2.3. 36 to 50 years
- 6.2.4. 51 to 65 years
- 6.2.5. More than 65 years
- 6.3. Market Analysis, Insights and Forecast - by Revenue
- 6.3.1. Tickets
- 6.3.2. Food & Beverages
- 6.3.3. Merchandise
- 6.3.4. Hotels/Resorts
- 6.3.5. Other Revenues
- 6.1. Market Analysis, Insights and Forecast - by Rides
- 7. Competitive Analysis
- 7.1. Company Profiles
- 7.1.1 Disney's Hollywood Studios
- 7.1.1.1. Company Overview
- 7.1.1.2. Products
- 7.1.1.3. Company Financials
- 7.1.1.4. SWOT Analysis
- 7.1.2 Universal Studios
- 7.1.2.1. Company Overview
- 7.1.2.2. Products
- 7.1.2.3. Company Financials
- 7.1.2.4. SWOT Analysis
- 7.1.3 Epcot
- 7.1.3.1. Company Overview
- 7.1.3.2. Products
- 7.1.3.3. Company Financials
- 7.1.3.4. SWOT Analysis
- 7.1.4 Seaworld**List Not Exhaustive
- 7.1.4.1. Company Overview
- 7.1.4.2. Products
- 7.1.4.3. Company Financials
- 7.1.4.4. SWOT Analysis
- 7.1.5 Universal Studios Hollywood
- 7.1.5.1. Company Overview
- 7.1.5.2. Products
- 7.1.5.3. Company Financials
- 7.1.5.4. SWOT Analysis
- 7.1.6 Magic Kingdom
- 7.1.6.1. Company Overview
- 7.1.6.2. Products
- 7.1.6.3. Company Financials
- 7.1.6.4. SWOT Analysis
- 7.1.7 Disney's Animal Kingdom
- 7.1.7.1. Company Overview
- 7.1.7.2. Products
- 7.1.7.3. Company Financials
- 7.1.7.4. SWOT Analysis
- 7.1.8 Disney's California Adventure
- 7.1.8.1. Company Overview
- 7.1.8.2. Products
- 7.1.8.3. Company Financials
- 7.1.8.4. SWOT Analysis
- 7.1.9 Islands of Adventure
- 7.1.9.1. Company Overview
- 7.1.9.2. Products
- 7.1.9.3. Company Financials
- 7.1.9.4. SWOT Analysis
- 7.1.10 Disneyland
- 7.1.10.1. Company Overview
- 7.1.10.2. Products
- 7.1.10.3. Company Financials
- 7.1.10.4. SWOT Analysis
- 7.1.1 Disney's Hollywood Studios
- 7.2. Market Entropy
- 7.2.1 Company's Key Areas Served
- 7.2.2 Recent Developments
- 7.3. Company Market Share Analysis 2025
- 7.3.1 Top 5 Companies Market Share Analysis
- 7.3.2 Top 3 Companies Market Share Analysis
- 7.4. List of Potential Customers
- 8. Research Methodology
List of Figures
- Figure 1: North America Amusement Parks Market Revenue Breakdown (billion, %) by Product 2025 & 2033
- Figure 2: North America Amusement Parks Market Share (%) by Company 2025
List of Tables
- Table 1: North America Amusement Parks Market Revenue billion Forecast, by Rides 2020 & 2033
- Table 2: North America Amusement Parks Market Revenue billion Forecast, by Age 2020 & 2033
- Table 3: North America Amusement Parks Market Revenue billion Forecast, by Revenue 2020 & 2033
- Table 4: North America Amusement Parks Market Revenue billion Forecast, by Region 2020 & 2033
- Table 5: North America Amusement Parks Market Revenue billion Forecast, by Rides 2020 & 2033
- Table 6: North America Amusement Parks Market Revenue billion Forecast, by Age 2020 & 2033
- Table 7: North America Amusement Parks Market Revenue billion Forecast, by Revenue 2020 & 2033
- Table 8: North America Amusement Parks Market Revenue billion Forecast, by Country 2020 & 2033
- Table 9: United States North America Amusement Parks Market Revenue (billion) Forecast, by Application 2020 & 2033
- Table 10: Canada North America Amusement Parks Market Revenue (billion) Forecast, by Application 2020 & 2033
- Table 11: Mexico North America Amusement Parks Market Revenue (billion) Forecast, by Application 2020 & 2033
Frequently Asked Questions
1. What is the projected Compound Annual Growth Rate (CAGR) of the North America Amusement Parks Market?
The projected CAGR is approximately 29.8%.
2. Which companies are prominent players in the North America Amusement Parks Market?
Key companies in the market include Disney's Hollywood Studios, Universal Studios, Epcot, Seaworld**List Not Exhaustive, Universal Studios Hollywood, Magic Kingdom, Disney's Animal Kingdom, Disney's California Adventure, Islands of Adventure, Disneyland.
3. What are the main segments of the North America Amusement Parks Market?
The market segments include Rides, Age, Revenue.
4. Can you provide details about the market size?
The market size is estimated to be USD 33.3 billion as of 2022.
5. What are some drivers contributing to market growth?
Rise in the Number of Visitors to Museums is Driving the Market; Digitalization is Driving the Market.
6. What are the notable trends driving market growth?
Mechanical Rides Powering North America's Amusement Park Industry.
7. Are there any restraints impacting market growth?
Maintenance and Preservation Costs; Changing Visitor Preferences.
8. Can you provide examples of recent developments in the market?
January 2023: Global hospitality and entertainment company Delaware North announced its continued expansion in the parks and lodging sector through the acquisition of the Best Western Premier Grand Canyon Squire Inn.
9. What pricing options are available for accessing the report?
Pricing options include single-user, multi-user, and enterprise licenses priced at USD 4750, USD 4950, and USD 6800 respectively.
10. Is the market size provided in terms of value or volume?
The market size is provided in terms of value, measured in billion.
11. Are there any specific market keywords associated with the report?
Yes, the market keyword associated with the report is "North America Amusement Parks Market," which aids in identifying and referencing the specific market segment covered.
12. How do I determine which pricing option suits my needs best?
The pricing options vary based on user requirements and access needs. Individual users may opt for single-user licenses, while businesses requiring broader access may choose multi-user or enterprise licenses for cost-effective access to the report.
13. Are there any additional resources or data provided in the North America Amusement Parks Market report?
While the report offers comprehensive insights, it's advisable to review the specific contents or supplementary materials provided to ascertain if additional resources or data are available.
14. How can I stay updated on further developments or reports in the North America Amusement Parks Market?
To stay informed about further developments, trends, and reports in the North America Amusement Parks Market, consider subscribing to industry newsletters, following relevant companies and organizations, or regularly checking reputable industry news sources and publications.
Methodology
Step 1 - Identification of Relevant Samples Size from Population Database


Step 2 - Approaches for Defining Global Market Size (Value, Volume* & Price*)

Note*: In applicable scenarios
Step 3 - Data Sources
Primary Research
- Web Analytics
- Survey Reports
- Research Institute
- Latest Research Reports
- Opinion Leaders
Secondary Research
- Annual Reports
- White Paper
- Latest Press Release
- Industry Association
- Paid Database
- Investor Presentations

Step 4 - Data Triangulation
Involves using different sources of information in order to increase the validity of a study
These sources are likely to be stakeholders in a program - participants, other researchers, program staff, other community members, and so on.
Then we put all data in single framework & apply various statistical tools to find out the dynamic on the market.
During the analysis stage, feedback from the stakeholder groups would be compared to determine areas of agreement as well as areas of divergence