

Key Insights
The global non-residential accommodation market is experiencing robust growth, projected to maintain a Compound Annual Growth Rate (CAGR) exceeding 12% from 2025 to 2033. This expansion is fueled by several key drivers. The burgeoning business travel sector, particularly in rapidly developing economies in Asia-Pacific and South America, is a significant contributor. Furthermore, the increasing popularity of leisure travel, coupled with the rise of experiential tourism and the diversification of accommodation options (e.g., vacation rentals and boutique hotels), is significantly boosting market demand. Online travel agencies (OTAs) and streamlined hotel booking platforms are enhancing accessibility and driving market penetration, particularly within the leisure travel segment. However, economic fluctuations, geopolitical uncertainties, and the potential impact of future pandemics pose significant restraints to the market's continued expansion. Segmentation analysis reveals that hotels remain the dominant accommodation type, followed by motels and resorts. The distribution channel landscape is also dynamic, with online travel agencies gaining market share at the expense of traditional travel agents. North America and Europe currently hold substantial market share, but the Asia-Pacific region is poised for significant growth, driven by rising disposable incomes and increasing tourism.
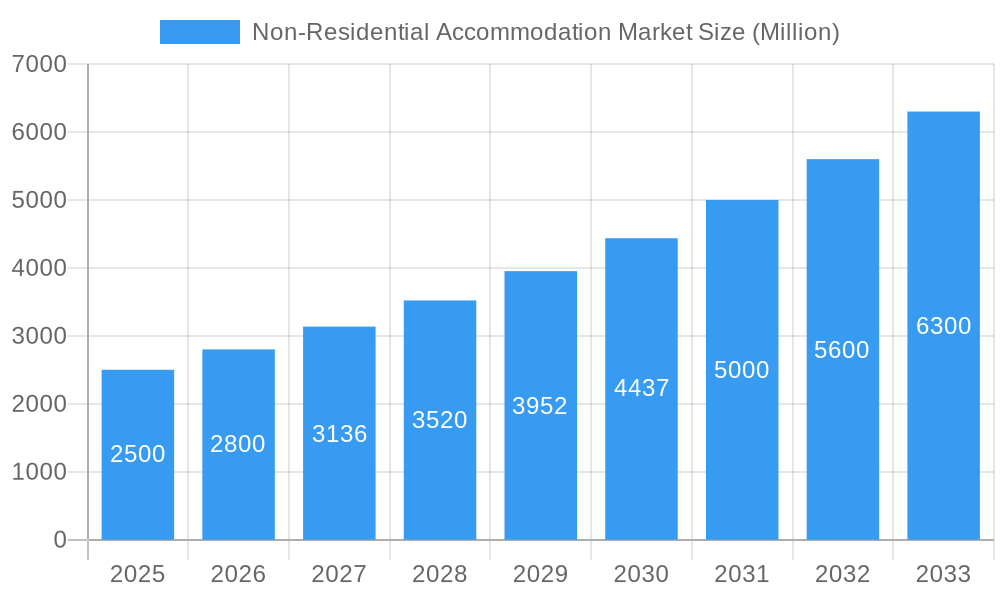
Non-Residential Accommodation Market Market Size (In Billion)
The competitive landscape is characterized by a mix of established international hotel chains (e.g., Marriott, Hilton, InterContinental) and increasingly prominent regional players. These companies are employing various strategies to maintain market share, including expanding their brand portfolios, enhancing customer loyalty programs, investing in technology to improve the booking experience, and focusing on sustainable tourism practices to appeal to environmentally conscious travelers. The market is also witnessing an increase in the number of independent hotels and vacation rentals, presenting both opportunities and challenges for established players. Future growth will likely hinge on adapting to evolving customer preferences, leveraging technological advancements, and responding proactively to external economic and geopolitical factors. Strategic mergers and acquisitions are expected to further shape the competitive landscape in the coming years. Detailed regional analysis suggests consistent, albeit varied, growth across all geographical segments, with variations in growth rates reflecting the unique economic and tourism landscapes of each region.
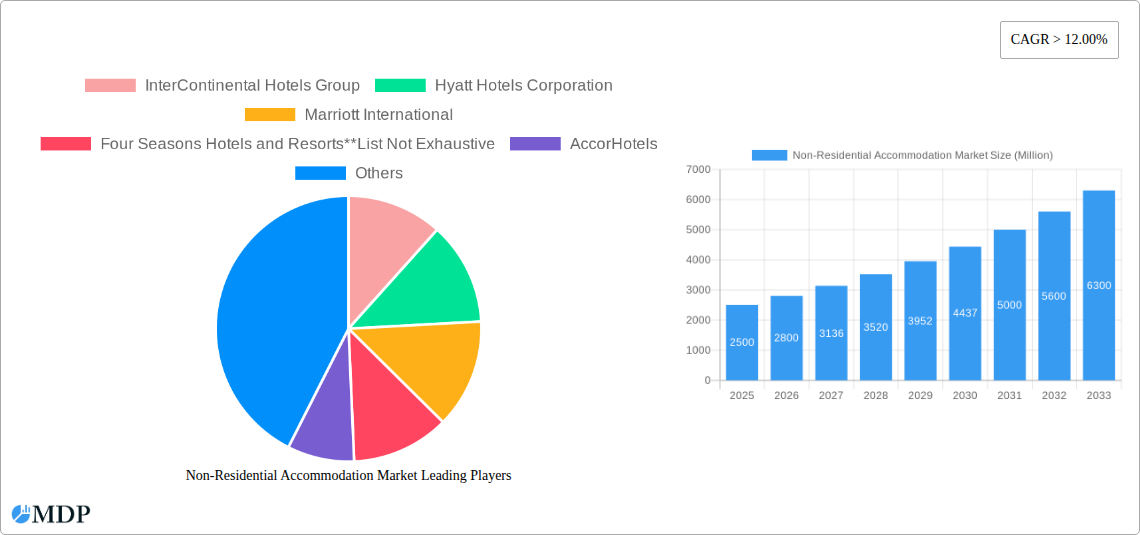
Non-Residential Accommodation Market Company Market Share
Non-Residential Accommodation Market Report: 2019-2033 Forecast
This comprehensive report provides a detailed analysis of the Non-Residential Accommodation Market, offering invaluable insights for industry stakeholders, investors, and strategic planners. Covering the period 2019-2033, with a focus on 2025, this report unveils market dynamics, trends, and future growth potential, incorporating data-driven projections and expert analysis. The market is valued at xx Million in 2025 and is projected to reach xx Million by 2033, exhibiting a CAGR of xx%.
Non-Residential Accommodation Market Market Dynamics & Concentration
The Non-Residential Accommodation market is characterized by a moderately concentrated landscape, with key players such as InterContinental Hotels Group, Hyatt Hotels Corporation, Marriott International, and Hilton Worldwide Holdings holding significant market share. However, the market also features numerous smaller players and independent operators, contributing to a dynamic competitive environment. Market concentration is further influenced by mergers and acquisitions (M&A) activity, with an estimated xx M&A deals occurring between 2019 and 2024. Innovation drives competition, with companies focusing on technological advancements like personalized guest experiences, optimized booking systems, and sustainable practices. Regulatory frameworks, varying across regions, impact operations and expansion plans. Product substitutes, such as vacation rentals (Airbnb, VRBO), challenge traditional hotels, forcing adaptation and diversification. End-user trends, particularly the rise of bleisure travel (blending business and leisure), and the growing preference for unique experiences, are shaping market demand.
- Market Share (2024 Estimate): Marriott International (xx%), Hilton Worldwide Holdings (xx%), InterContinental Hotels Group (xx%), Hyatt Hotels Corporation (xx%), Others (xx%).
- M&A Deal Count (2019-2024): xx
- Key Innovation Drivers: Sustainable tourism initiatives, personalized guest experiences, technological integration (AI, IoT), loyalty programs.
- Major Regulatory Impacts: Zoning laws, building codes, taxation policies, environmental regulations.
Non-Residential Accommodation Market Industry Trends & Analysis
The Non-Residential Accommodation market is experiencing robust growth, driven by several key factors. Rising disposable incomes, particularly in emerging economies, are fueling demand for travel and leisure activities. The increasing popularity of bleisure travel blurs the lines between business and leisure trips, broadening the customer base. Technological disruptions, particularly in online booking platforms and personalized service delivery, are transforming the customer experience. Consumer preferences are shifting towards experiential travel, sustainable accommodations, and personalized service. Competitive dynamics are intense, with companies vying for market share through strategic alliances, acquisitions, and innovative offerings. The market penetration of online travel agencies (OTAs) continues to rise, impacting the distribution landscape.
Leading Markets & Segments in Non-Residential Accommodation Market
Dominant Region: North America (United States and Canada) currently dominates the market due to high tourism spending and a well-established hospitality infrastructure. Asia-Pacific is showing significant growth potential.
Dominant Segment (By End-User): Leisure travelers represent the largest segment, fueled by rising disposable incomes and increased vacation time. Business travelers remain a significant segment.
Dominant Segment (By Distribution Channel): Online Travel Agencies (OTAs) command a large market share, driven by their convenience and wide reach. Hotel websites are increasingly important for direct bookings and customer relationship management.
Dominant Segment (By Type): Hotels constitute the largest market segment. However, vacation rentals are growing rapidly, particularly in the leisure travel segment.
Key Drivers (North America): Strong domestic tourism, well-developed infrastructure, favorable economic conditions.
Key Drivers (Asia-Pacific): Rapid economic growth, rising middle class, increasing outbound tourism.
Non-Residential Accommodation Market Product Developments
Recent product innovations focus on enhancing the guest experience through technological integrations. This includes smart room technology (e.g., voice-activated controls, personalized settings), mobile check-in/check-out, and contactless services. Companies are also investing in sustainable practices, such as energy-efficient building designs and waste reduction programs, to appeal to environmentally conscious travelers. These developments aim to differentiate offerings and meet evolving customer expectations.
Key Drivers of Non-Residential Accommodation Market Growth
Several key factors are driving the growth of the Non-Residential Accommodation market:
- Technological advancements: Smart room technology, mobile applications, and online booking platforms enhance the guest experience and operational efficiency.
- Economic growth: Rising disposable incomes in both developed and developing economies fuel demand for travel and leisure.
- Favorable government policies: Tourism promotion initiatives and infrastructure development support industry growth.
Challenges in the Non-Residential Accommodation Market Market
The Non-Residential Accommodation market faces several challenges:
- Increased competition: The rise of alternative accommodation options, such as vacation rentals, puts pressure on traditional hotels.
- Fluctuations in global economies: Economic downturns can significantly impact travel spending and hotel occupancy rates.
- Supply chain disruptions: Global events, like pandemics or natural disasters, can affect the supply of goods and services within the hospitality industry.
Emerging Opportunities in Non-Residential Accommodation Market
Several emerging opportunities are poised to drive long-term growth:
- Growth of experiential travel: Hotels are increasingly offering unique experiences, such as curated tours and wellness retreats, to attract customers.
- Expansion into emerging markets: Untapped potential exists in developing economies with rising middle classes and increased travel demand.
- Strategic partnerships: Collaborations with technology companies and travel agencies can enhance reach and customer engagement.
Leading Players in the Non-Residential Accommodation Market Sector
- InterContinental Hotels Group
- Hyatt Hotels Corporation
- Marriott International
- Four Seasons Hotels and Resorts
- AccorHotels
- Hilton Worldwide Holdings
- MGM Resorts International
- Starwood Hotels
- Ctrip Com International Ltd
- Rewe Group
Key Milestones in Non-Residential Accommodation Market Industry
October 2022: Marriott International announced its acquisition of a city express brand, aiming to expand its presence in the affordable midscale segment. This move reflects a strategic focus on broadening market reach and catering to budget-conscious travelers.
December 2022: Hilton announced the continued expansion of its Waldorf Astoria Hotels & Resorts brand in the Caribbean and Latin America, signing a new hotel in San Miguel de Allende, Mexico. This signals a commitment to luxury market growth in these regions.
Strategic Outlook for Non-Residential Accommodation Market Market
The Non-Residential Accommodation market is poised for continued growth, driven by evolving consumer preferences, technological advancements, and strategic market expansion. Companies that effectively adapt to changing trends, embrace innovation, and prioritize customer experience are best positioned to thrive in this dynamic landscape. The focus on sustainable practices and personalized service will play a key role in shaping future market leadership.
Non-Residential Accommodation Market Segmentation
-
1. Type
- 1.1. Hotels
- 1.2. Motels
- 1.3. Resorts
- 1.4. Vacation Rentals
- 1.5. Others
-
2. End User
- 2.1. Leisure Travelers
- 2.2. Business Travelers
- 2.3. Group Travelers
-
3. Distribution Channels
- 3.1. Hotel Websites
- 3.2. Online Travel Agencies (OTA)
- 3.3. Travel Management Companies (TMCs)
- 3.4. Corporate Travel Agents
Non-Residential Accommodation Market Segmentation By Geography
- 1. North America
- 2. Europe
- 3. Asia Pacific
- 4. South America
- 5. Middle East
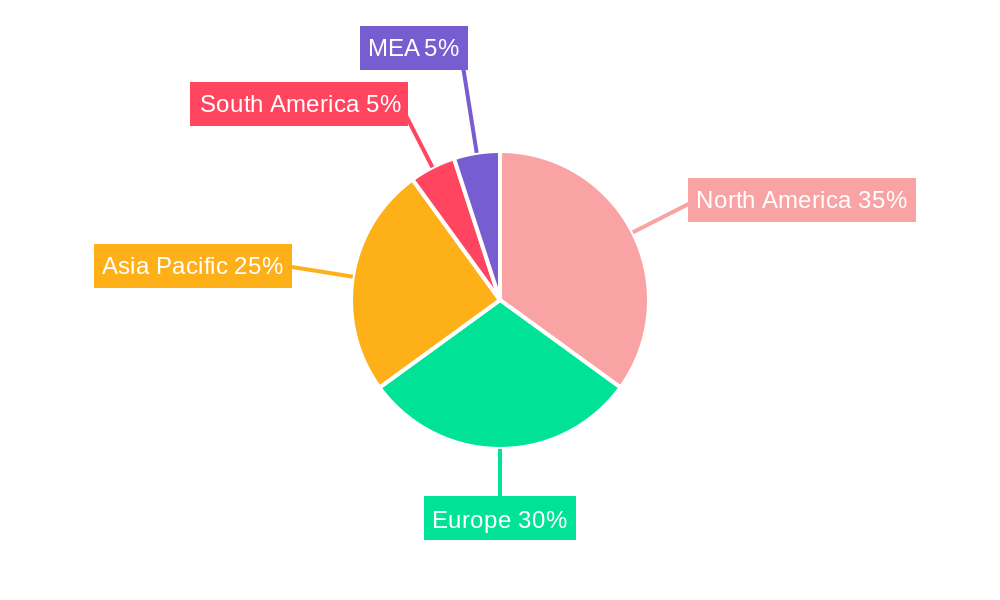
Non-Residential Accommodation Market Regional Market Share
Geographic Coverage of Non-Residential Accommodation Market
Non-Residential Accommodation Market REPORT HIGHLIGHTS
| Aspects | Details |
|---|---|
| Study Period | 2020-2034 |
| Base Year | 2025 |
| Estimated Year | 2026 |
| Forecast Period | 2026-2034 |
| Historical Period | 2020-2025 |
| Growth Rate | CAGR of > 12.00% from 2020-2034 |
| Segmentation |
|
Table of Contents
- 1. Introduction
- 1.1. Research Scope
- 1.2. Market Segmentation
- 1.3. Research Objective
- 1.4. Definitions and Assumptions
- 2. Executive Summary
- 2.1. Market Snapshot
- 3. Market Dynamics
- 3.1. Market Drivers
- 3.2. Market Restrains
- 3.3. Market Trends
- 3.4. Market Opportunities
- 4. Market Factor Analysis
- 4.1. Porters Five Forces
- 4.1.1. Bargaining Power of Suppliers
- 4.1.2. Bargaining Power of Buyers
- 4.1.3. Threat of New Entrants
- 4.1.4. Threat of Substitutes
- 4.1.5. Competitive Rivalry
- 4.2. PESTEL analysis
- 4.3. BCG Analysis
- 4.3.1. Stars (High Growth, High Market Share)
- 4.3.2. Cash Cows (Low Growth, High Market Share)
- 4.3.3. Question Mark (High Growth, Low Market Share)
- 4.3.4. Dogs (Low Growth, Low Market Share)
- 4.4. Ansoff Matrix Analysis
- 4.5. Supply Chain Analysis
- 4.6. Regulatory Landscape
- 4.7. Current Market Potential and Opportunity Assessment (TAM–SAM–SOM Framework)
- 4.8. MDP Analyst Note
- 4.1. Porters Five Forces
- 5. Market Analysis, Insights and Forecast 2021-2033
- 5.1. Market Analysis, Insights and Forecast - by Type
- 5.1.1. Hotels
- 5.1.2. Motels
- 5.1.3. Resorts
- 5.1.4. Vacation Rentals
- 5.1.5. Others
- 5.2. Market Analysis, Insights and Forecast - by End User
- 5.2.1. Leisure Travelers
- 5.2.2. Business Travelers
- 5.2.3. Group Travelers
- 5.3. Market Analysis, Insights and Forecast - by Distribution Channels
- 5.3.1. Hotel Websites
- 5.3.2. Online Travel Agencies (OTA)
- 5.3.3. Travel Management Companies (TMCs)
- 5.3.4. Corporate Travel Agents
- 5.4. Market Analysis, Insights and Forecast - by Region
- 5.4.1. North America
- 5.4.2. Europe
- 5.4.3. Asia Pacific
- 5.4.4. South America
- 5.4.5. Middle East
- 5.1. Market Analysis, Insights and Forecast - by Type
- 6. Global Non-Residential Accommodation Market Analysis, Insights and Forecast, 2021-2033
- 6.1. Market Analysis, Insights and Forecast - by Type
- 6.1.1. Hotels
- 6.1.2. Motels
- 6.1.3. Resorts
- 6.1.4. Vacation Rentals
- 6.1.5. Others
- 6.2. Market Analysis, Insights and Forecast - by End User
- 6.2.1. Leisure Travelers
- 6.2.2. Business Travelers
- 6.2.3. Group Travelers
- 6.3. Market Analysis, Insights and Forecast - by Distribution Channels
- 6.3.1. Hotel Websites
- 6.3.2. Online Travel Agencies (OTA)
- 6.3.3. Travel Management Companies (TMCs)
- 6.3.4. Corporate Travel Agents
- 6.1. Market Analysis, Insights and Forecast - by Type
- 7. North America Non-Residential Accommodation Market Analysis, Insights and Forecast, 2020-2032
- 7.1. Market Analysis, Insights and Forecast - by Type
- 7.1.1. Hotels
- 7.1.2. Motels
- 7.1.3. Resorts
- 7.1.4. Vacation Rentals
- 7.1.5. Others
- 7.2. Market Analysis, Insights and Forecast - by End User
- 7.2.1. Leisure Travelers
- 7.2.2. Business Travelers
- 7.2.3. Group Travelers
- 7.3. Market Analysis, Insights and Forecast - by Distribution Channels
- 7.3.1. Hotel Websites
- 7.3.2. Online Travel Agencies (OTA)
- 7.3.3. Travel Management Companies (TMCs)
- 7.3.4. Corporate Travel Agents
- 7.1. Market Analysis, Insights and Forecast - by Type
- 8. Europe Non-Residential Accommodation Market Analysis, Insights and Forecast, 2020-2032
- 8.1. Market Analysis, Insights and Forecast - by Type
- 8.1.1. Hotels
- 8.1.2. Motels
- 8.1.3. Resorts
- 8.1.4. Vacation Rentals
- 8.1.5. Others
- 8.2. Market Analysis, Insights and Forecast - by End User
- 8.2.1. Leisure Travelers
- 8.2.2. Business Travelers
- 8.2.3. Group Travelers
- 8.3. Market Analysis, Insights and Forecast - by Distribution Channels
- 8.3.1. Hotel Websites
- 8.3.2. Online Travel Agencies (OTA)
- 8.3.3. Travel Management Companies (TMCs)
- 8.3.4. Corporate Travel Agents
- 8.1. Market Analysis, Insights and Forecast - by Type
- 9. Asia Pacific Non-Residential Accommodation Market Analysis, Insights and Forecast, 2020-2032
- 9.1. Market Analysis, Insights and Forecast - by Type
- 9.1.1. Hotels
- 9.1.2. Motels
- 9.1.3. Resorts
- 9.1.4. Vacation Rentals
- 9.1.5. Others
- 9.2. Market Analysis, Insights and Forecast - by End User
- 9.2.1. Leisure Travelers
- 9.2.2. Business Travelers
- 9.2.3. Group Travelers
- 9.3. Market Analysis, Insights and Forecast - by Distribution Channels
- 9.3.1. Hotel Websites
- 9.3.2. Online Travel Agencies (OTA)
- 9.3.3. Travel Management Companies (TMCs)
- 9.3.4. Corporate Travel Agents
- 9.1. Market Analysis, Insights and Forecast - by Type
- 10. South America Non-Residential Accommodation Market Analysis, Insights and Forecast, 2020-2032
- 10.1. Market Analysis, Insights and Forecast - by Type
- 10.1.1. Hotels
- 10.1.2. Motels
- 10.1.3. Resorts
- 10.1.4. Vacation Rentals
- 10.1.5. Others
- 10.2. Market Analysis, Insights and Forecast - by End User
- 10.2.1. Leisure Travelers
- 10.2.2. Business Travelers
- 10.2.3. Group Travelers
- 10.3. Market Analysis, Insights and Forecast - by Distribution Channels
- 10.3.1. Hotel Websites
- 10.3.2. Online Travel Agencies (OTA)
- 10.3.3. Travel Management Companies (TMCs)
- 10.3.4. Corporate Travel Agents
- 10.1. Market Analysis, Insights and Forecast - by Type
- 11. Middle East Non-Residential Accommodation Market Analysis, Insights and Forecast, 2020-2032
- 11.1. Market Analysis, Insights and Forecast - by Type
- 11.1.1. Hotels
- 11.1.2. Motels
- 11.1.3. Resorts
- 11.1.4. Vacation Rentals
- 11.1.5. Others
- 11.2. Market Analysis, Insights and Forecast - by End User
- 11.2.1. Leisure Travelers
- 11.2.2. Business Travelers
- 11.2.3. Group Travelers
- 11.3. Market Analysis, Insights and Forecast - by Distribution Channels
- 11.3.1. Hotel Websites
- 11.3.2. Online Travel Agencies (OTA)
- 11.3.3. Travel Management Companies (TMCs)
- 11.3.4. Corporate Travel Agents
- 11.1. Market Analysis, Insights and Forecast - by Type
- 12. Competitive Analysis
- 12.1. Company Profiles
- 12.1.1 InterContinental Hotels Group
- 12.1.1.1. Company Overview
- 12.1.1.2. Products
- 12.1.1.3. Company Financials
- 12.1.1.4. SWOT Analysis
- 12.1.2 Hyatt Hotels Corporation
- 12.1.2.1. Company Overview
- 12.1.2.2. Products
- 12.1.2.3. Company Financials
- 12.1.2.4. SWOT Analysis
- 12.1.3 Marriott International
- 12.1.3.1. Company Overview
- 12.1.3.2. Products
- 12.1.3.3. Company Financials
- 12.1.3.4. SWOT Analysis
- 12.1.4 Four Seasons Hotels and Resorts**List Not Exhaustive
- 12.1.4.1. Company Overview
- 12.1.4.2. Products
- 12.1.4.3. Company Financials
- 12.1.4.4. SWOT Analysis
- 12.1.5 AccorHotels
- 12.1.5.1. Company Overview
- 12.1.5.2. Products
- 12.1.5.3. Company Financials
- 12.1.5.4. SWOT Analysis
- 12.1.6 Hilton Worldwide Holdings
- 12.1.6.1. Company Overview
- 12.1.6.2. Products
- 12.1.6.3. Company Financials
- 12.1.6.4. SWOT Analysis
- 12.1.7 MGM Resorts International
- 12.1.7.1. Company Overview
- 12.1.7.2. Products
- 12.1.7.3. Company Financials
- 12.1.7.4. SWOT Analysis
- 12.1.8 Starwood Hotels
- 12.1.8.1. Company Overview
- 12.1.8.2. Products
- 12.1.8.3. Company Financials
- 12.1.8.4. SWOT Analysis
- 12.1.9 Ctrip Com International Ltd
- 12.1.9.1. Company Overview
- 12.1.9.2. Products
- 12.1.9.3. Company Financials
- 12.1.9.4. SWOT Analysis
- 12.1.10 Rewe Group
- 12.1.10.1. Company Overview
- 12.1.10.2. Products
- 12.1.10.3. Company Financials
- 12.1.10.4. SWOT Analysis
- 12.1.1 InterContinental Hotels Group
- 12.2. Market Entropy
- 12.2.1 Company's Key Areas Served
- 12.2.2 Recent Developments
- 12.3. Company Market Share Analysis 2025
- 12.3.1 Top 5 Companies Market Share Analysis
- 12.3.2 Top 3 Companies Market Share Analysis
- 12.4. List of Potential Customers
- 13. Research Methodology
List of Figures
- Figure 1: Global Non-Residential Accommodation Market Revenue Breakdown (Million, %) by Region 2025 & 2033
- Figure 2: North America Non-Residential Accommodation Market Revenue (Million), by Type 2025 & 2033
- Figure 3: North America Non-Residential Accommodation Market Revenue Share (%), by Type 2025 & 2033
- Figure 4: North America Non-Residential Accommodation Market Revenue (Million), by End User 2025 & 2033
- Figure 5: North America Non-Residential Accommodation Market Revenue Share (%), by End User 2025 & 2033
- Figure 6: North America Non-Residential Accommodation Market Revenue (Million), by Distribution Channels 2025 & 2033
- Figure 7: North America Non-Residential Accommodation Market Revenue Share (%), by Distribution Channels 2025 & 2033
- Figure 8: North America Non-Residential Accommodation Market Revenue (Million), by Country 2025 & 2033
- Figure 9: North America Non-Residential Accommodation Market Revenue Share (%), by Country 2025 & 2033
- Figure 10: Europe Non-Residential Accommodation Market Revenue (Million), by Type 2025 & 2033
- Figure 11: Europe Non-Residential Accommodation Market Revenue Share (%), by Type 2025 & 2033
- Figure 12: Europe Non-Residential Accommodation Market Revenue (Million), by End User 2025 & 2033
- Figure 13: Europe Non-Residential Accommodation Market Revenue Share (%), by End User 2025 & 2033
- Figure 14: Europe Non-Residential Accommodation Market Revenue (Million), by Distribution Channels 2025 & 2033
- Figure 15: Europe Non-Residential Accommodation Market Revenue Share (%), by Distribution Channels 2025 & 2033
- Figure 16: Europe Non-Residential Accommodation Market Revenue (Million), by Country 2025 & 2033
- Figure 17: Europe Non-Residential Accommodation Market Revenue Share (%), by Country 2025 & 2033
- Figure 18: Asia Pacific Non-Residential Accommodation Market Revenue (Million), by Type 2025 & 2033
- Figure 19: Asia Pacific Non-Residential Accommodation Market Revenue Share (%), by Type 2025 & 2033
- Figure 20: Asia Pacific Non-Residential Accommodation Market Revenue (Million), by End User 2025 & 2033
- Figure 21: Asia Pacific Non-Residential Accommodation Market Revenue Share (%), by End User 2025 & 2033
- Figure 22: Asia Pacific Non-Residential Accommodation Market Revenue (Million), by Distribution Channels 2025 & 2033
- Figure 23: Asia Pacific Non-Residential Accommodation Market Revenue Share (%), by Distribution Channels 2025 & 2033
- Figure 24: Asia Pacific Non-Residential Accommodation Market Revenue (Million), by Country 2025 & 2033
- Figure 25: Asia Pacific Non-Residential Accommodation Market Revenue Share (%), by Country 2025 & 2033
- Figure 26: South America Non-Residential Accommodation Market Revenue (Million), by Type 2025 & 2033
- Figure 27: South America Non-Residential Accommodation Market Revenue Share (%), by Type 2025 & 2033
- Figure 28: South America Non-Residential Accommodation Market Revenue (Million), by End User 2025 & 2033
- Figure 29: South America Non-Residential Accommodation Market Revenue Share (%), by End User 2025 & 2033
- Figure 30: South America Non-Residential Accommodation Market Revenue (Million), by Distribution Channels 2025 & 2033
- Figure 31: South America Non-Residential Accommodation Market Revenue Share (%), by Distribution Channels 2025 & 2033
- Figure 32: South America Non-Residential Accommodation Market Revenue (Million), by Country 2025 & 2033
- Figure 33: South America Non-Residential Accommodation Market Revenue Share (%), by Country 2025 & 2033
- Figure 34: Middle East Non-Residential Accommodation Market Revenue (Million), by Type 2025 & 2033
- Figure 35: Middle East Non-Residential Accommodation Market Revenue Share (%), by Type 2025 & 2033
- Figure 36: Middle East Non-Residential Accommodation Market Revenue (Million), by End User 2025 & 2033
- Figure 37: Middle East Non-Residential Accommodation Market Revenue Share (%), by End User 2025 & 2033
- Figure 38: Middle East Non-Residential Accommodation Market Revenue (Million), by Distribution Channels 2025 & 2033
- Figure 39: Middle East Non-Residential Accommodation Market Revenue Share (%), by Distribution Channels 2025 & 2033
- Figure 40: Middle East Non-Residential Accommodation Market Revenue (Million), by Country 2025 & 2033
- Figure 41: Middle East Non-Residential Accommodation Market Revenue Share (%), by Country 2025 & 2033
List of Tables
- Table 1: Global Non-Residential Accommodation Market Revenue Million Forecast, by Type 2020 & 2033
- Table 2: Global Non-Residential Accommodation Market Revenue Million Forecast, by End User 2020 & 2033
- Table 3: Global Non-Residential Accommodation Market Revenue Million Forecast, by Distribution Channels 2020 & 2033
- Table 4: Global Non-Residential Accommodation Market Revenue Million Forecast, by Region 2020 & 2033
- Table 5: Global Non-Residential Accommodation Market Revenue Million Forecast, by Type 2020 & 2033
- Table 6: Global Non-Residential Accommodation Market Revenue Million Forecast, by End User 2020 & 2033
- Table 7: Global Non-Residential Accommodation Market Revenue Million Forecast, by Distribution Channels 2020 & 2033
- Table 8: Global Non-Residential Accommodation Market Revenue Million Forecast, by Country 2020 & 2033
- Table 9: Global Non-Residential Accommodation Market Revenue Million Forecast, by Type 2020 & 2033
- Table 10: Global Non-Residential Accommodation Market Revenue Million Forecast, by End User 2020 & 2033
- Table 11: Global Non-Residential Accommodation Market Revenue Million Forecast, by Distribution Channels 2020 & 2033
- Table 12: Global Non-Residential Accommodation Market Revenue Million Forecast, by Country 2020 & 2033
- Table 13: Global Non-Residential Accommodation Market Revenue Million Forecast, by Type 2020 & 2033
- Table 14: Global Non-Residential Accommodation Market Revenue Million Forecast, by End User 2020 & 2033
- Table 15: Global Non-Residential Accommodation Market Revenue Million Forecast, by Distribution Channels 2020 & 2033
- Table 16: Global Non-Residential Accommodation Market Revenue Million Forecast, by Country 2020 & 2033
- Table 17: Global Non-Residential Accommodation Market Revenue Million Forecast, by Type 2020 & 2033
- Table 18: Global Non-Residential Accommodation Market Revenue Million Forecast, by End User 2020 & 2033
- Table 19: Global Non-Residential Accommodation Market Revenue Million Forecast, by Distribution Channels 2020 & 2033
- Table 20: Global Non-Residential Accommodation Market Revenue Million Forecast, by Country 2020 & 2033
- Table 21: Global Non-Residential Accommodation Market Revenue Million Forecast, by Type 2020 & 2033
- Table 22: Global Non-Residential Accommodation Market Revenue Million Forecast, by End User 2020 & 2033
- Table 23: Global Non-Residential Accommodation Market Revenue Million Forecast, by Distribution Channels 2020 & 2033
- Table 24: Global Non-Residential Accommodation Market Revenue Million Forecast, by Country 2020 & 2033
Frequently Asked Questions
1. What is the projected Compound Annual Growth Rate (CAGR) of the Non-Residential Accommodation Market?
The projected CAGR is approximately > 12.00%.
2. Which companies are prominent players in the Non-Residential Accommodation Market?
Key companies in the market include InterContinental Hotels Group, Hyatt Hotels Corporation, Marriott International, Four Seasons Hotels and Resorts**List Not Exhaustive, AccorHotels, Hilton Worldwide Holdings, MGM Resorts International, Starwood Hotels, Ctrip Com International Ltd, Rewe Group.
3. What are the main segments of the Non-Residential Accommodation Market?
The market segments include Type, End User, Distribution Channels.
4. Can you provide details about the market size?
The market size is estimated to be USD XX Million as of 2022.
5. What are some drivers contributing to market growth?
Increased Demand for Unique and Personalized Travel Experiences; Rising Trend of Online Booking and Mobile Applications.
6. What are the notable trends driving market growth?
Technology Driven Services is Driving the Market.
7. Are there any restraints impacting market growth?
Competition from Other Alternative Accommodation Options Such as Vacation Rentals and Homestays; Seasonal Demand Fluctuations and Dependence on Tourism Industry.
8. Can you provide examples of recent developments in the market?
December 2022: Hilton Announced Continued Expansion of Waldorf Astoria Hotels & Resorts in the Caribbean and Latin America by signing a new hotel in San Miguel de Allende, Mexico.
9. What pricing options are available for accessing the report?
Pricing options include single-user, multi-user, and enterprise licenses priced at USD 4750, USD 5250, and USD 8750 respectively.
10. Is the market size provided in terms of value or volume?
The market size is provided in terms of value, measured in Million.
11. Are there any specific market keywords associated with the report?
Yes, the market keyword associated with the report is "Non-Residential Accommodation Market," which aids in identifying and referencing the specific market segment covered.
12. How do I determine which pricing option suits my needs best?
The pricing options vary based on user requirements and access needs. Individual users may opt for single-user licenses, while businesses requiring broader access may choose multi-user or enterprise licenses for cost-effective access to the report.
13. Are there any additional resources or data provided in the Non-Residential Accommodation Market report?
While the report offers comprehensive insights, it's advisable to review the specific contents or supplementary materials provided to ascertain if additional resources or data are available.
14. How can I stay updated on further developments or reports in the Non-Residential Accommodation Market?
To stay informed about further developments, trends, and reports in the Non-Residential Accommodation Market, consider subscribing to industry newsletters, following relevant companies and organizations, or regularly checking reputable industry news sources and publications.
Methodology
Step 1 - Identification of Relevant Samples Size from Population Database


Step 2 - Approaches for Defining Global Market Size (Value, Volume* & Price*)

Note*: In applicable scenarios
Step 3 - Data Sources
Primary Research
- Web Analytics
- Survey Reports
- Research Institute
- Latest Research Reports
- Opinion Leaders
Secondary Research
- Annual Reports
- White Paper
- Latest Press Release
- Industry Association
- Paid Database
- Investor Presentations

Step 4 - Data Triangulation
Involves using different sources of information in order to increase the validity of a study
These sources are likely to be stakeholders in a program - participants, other researchers, program staff, other community members, and so on.
Then we put all data in single framework & apply various statistical tools to find out the dynamic on the market.
During the analysis stage, feedback from the stakeholder groups would be compared to determine areas of agreement as well as areas of divergence