

Key Insights
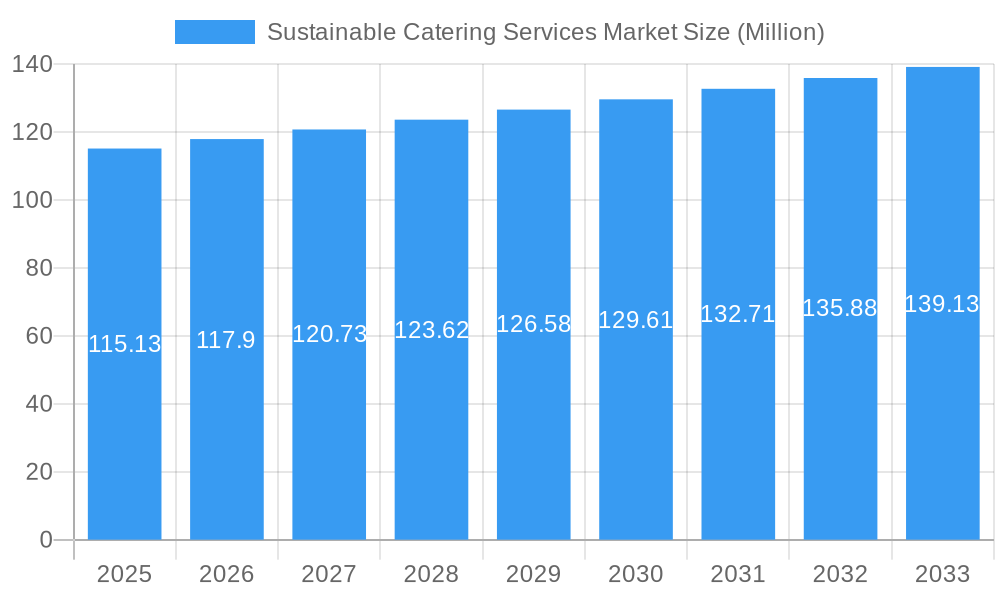
The global sustainable catering services market, valued at $115.13 million in 2025, is projected to experience steady growth, driven by increasing consumer awareness of environmental and social responsibility, coupled with rising demand for healthier and ethically sourced food. The market's Compound Annual Growth Rate (CAGR) of 2.33% from 2019-2024 indicates a consistent, albeit moderate, expansion. Key growth drivers include the burgeoning hospitality sector, particularly in hotels and corporate events, a growing preference for plant-based and locally sourced ingredients, and a heightened focus on reducing food waste throughout the supply chain. The segment breakdown reveals significant contributions from contractual catering services, driven by large-scale contracts with corporations and institutions. Corporate events consistently command a large share of the event-type segment, reflecting the importance of sustainable practices in business settings. While the individual end-user segment holds a sizeable portion, the hospitality and healthcare sectors demonstrate significant potential for future growth as sustainability initiatives gain traction within these industries. The geographical distribution shows robust growth in North America and Europe, followed by the Asia-Pacific region, indicating strong opportunities for market expansion in developing economies. However, challenges such as higher initial investment costs associated with sustainable practices and potential fluctuations in the prices of organic and locally sourced ingredients may act as restraints.
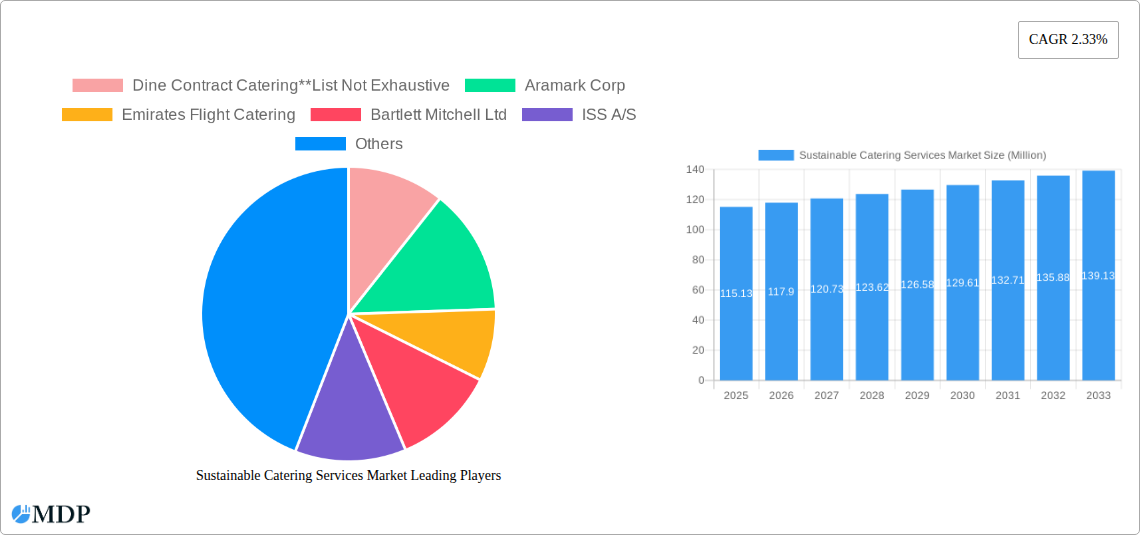
Sustainable Catering Services Market Market Size (In Million)
Despite these restraints, the market’s trajectory reflects a positive outlook. The increasing regulatory pressure on businesses to adopt sustainable practices, along with consumer demand for transparency and ethical sourcing, fuels market growth. Further innovation in sustainable packaging, waste reduction technologies, and the development of more efficient supply chains will likely accelerate this positive trend. Companies are increasingly adopting certifications and adopting responsible sourcing strategies to differentiate themselves and attract environmentally conscious customers. This trend towards greater accountability will significantly impact the market's future development, fostering a shift towards more comprehensive and integrated sustainable practices within the catering industry. The market's growth will be further shaped by the evolving consumer preferences, technological advancements, and policy changes related to sustainability in the food sector.
Sustainable Catering Services Market Company Market Share
Sustainable Catering Services Market: A Comprehensive Report (2019-2033)
This in-depth report provides a comprehensive analysis of the Sustainable Catering Services Market, offering invaluable insights for industry stakeholders, investors, and businesses seeking to capitalize on this rapidly evolving sector. With a study period spanning 2019-2033, a base year of 2025, and a forecast period of 2025-2033, this report leverages extensive data analysis and expert insights to illuminate key market trends, opportunities, and challenges. The report covers various segments including service type, event type, and end-user, providing a granular understanding of the market landscape. Key players like Aramark Corp, Compass Group PLC, and many others are analyzed to offer a competitive overview.
Sustainable Catering Services Market Dynamics & Concentration
The sustainable catering services market is characterized by a moderate level of concentration, with a handful of large multinational corporations holding significant market share. However, the market also features a considerable number of smaller, specialized caterers focusing on niche segments. The market share of the top 5 players is estimated at xx%, indicating room for both consolidation and growth for smaller players. Innovation is a key driver, with companies continuously seeking to offer more sustainable sourcing practices, reduce waste, and enhance the overall customer experience. Stringent environmental regulations are increasingly shaping the market, pushing companies to adopt eco-friendly practices. Product substitutes, like home-cooked meals and meal delivery services, exist, but the convenience and professionalism of sustainable catering continue to drive demand.
End-user trends are heavily influencing market dynamics, with a growing focus on health-conscious choices, ethical sourcing, and minimizing environmental impact. Mergers and acquisitions (M&A) activity is significant, indicating consolidation and expansion efforts within the sector. For example:
- M&A Activity: The acquisition of CH&CO by Compass Group PLC in January 2024 for USD 600 Million signifies a major consolidation move in the premium contract catering segment. The overall number of M&A deals in the sustainable catering sector between 2019 and 2024 is estimated to be xx.
Sustainable Catering Services Market Industry Trends & Analysis
The sustainable catering services market is experiencing robust growth, fueled by increasing consumer awareness of environmental and social responsibility, alongside rising demand for convenient and healthy food options. The market is projected to exhibit a Compound Annual Growth Rate (CAGR) of xx% during the forecast period (2025-2033). This growth is driven by several factors, including:
- Technological Disruptions: Advancements in food technology, such as precision fermentation and alternative proteins, are opening new avenues for sustainable food sourcing and preparation.
- Consumer Preferences: A rising consumer base actively seeks sustainable and ethically produced food, significantly driving demand for services that align with these values.
- Competitive Dynamics: Intense competition is fostering innovation and driving the adoption of sustainable practices to gain a competitive edge. The market penetration of sustainable catering services is estimated to reach xx% by 2033.
Leading Markets & Segments in Sustainable Catering Services Market
The North American region currently dominates the sustainable catering services market, driven by strong consumer demand for sustainable options and a robust hospitality sector. Within this region, the United States holds the largest market share, followed by Canada.
By Service Type: Contractual catering services constitute the largest segment, due to consistent demand from corporations and institutions.
By Event Type: Corporate events lead the market, reflecting the significant spending on corporate catering.
By End-User: The hospitality industry and corporate sectors are the primary drivers of market growth, with a rising demand for sustainable catering solutions in hotels, restaurants, and businesses. Key drivers across segments include:
- Economic Policies: Government initiatives promoting sustainable businesses influence industry growth.
- Infrastructure: The availability of robust supply chains for sustainable food products plays a vital role.
Sustainable Catering Services Market Product Developments
Recent product innovations focus on locally sourced ingredients, plant-based options, reduced packaging, and compostable or recyclable materials. Companies are leveraging technology to optimize food waste management and improve supply chain transparency, thereby enhancing their sustainability credentials and gaining a competitive advantage in the market. These developments align well with the increasing consumer demand for environmentally responsible and ethical food services.
Key Drivers of Sustainable Catering Services Market Growth
Several factors are driving the growth of the sustainable catering services market:
- Technological Advancements: Innovations in food production, packaging, and waste management are creating more sustainable options.
- Economic Growth: Increased disposable incomes contribute to higher spending on premium and sustainable catering services.
- Stringent Regulations: Government regulations promoting sustainability are driving adoption of eco-friendly practices within the industry.
Challenges in the Sustainable Catering Services Market
The sustainable catering services market faces several challenges:
- High Costs: Sourcing sustainable ingredients and implementing eco-friendly practices can be more expensive, affecting affordability.
- Supply Chain Disruptions: Reliance on specific sustainable suppliers can create vulnerability to supply chain disruptions.
- Competition: The market is becoming increasingly competitive, demanding innovation and efficiency.
Emerging Opportunities in Sustainable Catering Services Market
The market presents significant opportunities for growth through:
- Technological Breakthroughs: Advancements in alternative proteins and food waste reduction technologies will create new avenues for innovation.
- Strategic Partnerships: Collaborations with sustainable food producers and technology providers can enhance offerings and efficiency.
- Market Expansion: Expansion into new geographic regions and untapped market segments presents significant potential.
Leading Players in the Sustainable Catering Services Market Sector
- Dine Contract Catering
- Aramark Corp
- Emirates Flight Catering
- Bartlett Mitchell Ltd
- ISS A/S
- Elior Group
- Entier Limited
- Compass Group PLC
- DO & CO Aktiengesellschaft
- CH and Co Catering Group Ltd
Key Milestones in Sustainable Catering Services Market Industry
- January 2024: Compass Group PLC acquires CH&CO for USD 600 Million, significantly impacting the market share of premium contract catering.
- May 2023: Aramark partners with Bean Sprouts, expanding its offerings in healthy and sustainable children's food.
Strategic Outlook for Sustainable Catering Services Market
The sustainable catering services market holds immense potential for future growth, driven by increasing consumer awareness, technological advancements, and supportive government policies. Strategic opportunities include expanding into new markets, developing innovative product offerings, and enhancing operational efficiency to optimize profitability and sustainability. The market is poised for continued expansion as companies strive to meet the evolving demands of environmentally conscious consumers.
Sustainable Catering Services Market Segmentation
-
1. Service Type
- 1.1. Contractual Catering Services
- 1.2. Non-Contractual Catering Services
- 1.3. Other Catering Services
-
2. Event Type
- 2.1. Corporate
- 2.2. Wedding
- 2.3. Social Events
- 2.4. Others
-
3. End-User
- 3.1. Individuals
- 3.2. Hospitality
- 3.3. Educational
- 3.4. Healthcare
- 3.5. In-Flight
- 3.6. Other End Users
- 4. Geography
-
5. North America
- 5.1. United States
- 5.2. Canada
- 5.3. Mexico
- 5.4. Rest of North America
-
6. Europe
- 6.1. United Kingdom
- 6.2. Germany
- 6.3. France
- 6.4. Russia
- 6.5. Italy
- 6.6. Spain
- 6.7. Rest of Europe
-
7. Asia-Pacific
- 7.1. India
- 7.2. China
- 7.3. Japan
- 7.4. Australia
- 7.5. Rest of Asia-Pacific
-
8. South America
- 8.1. Brazil
- 8.2. Argentina
- 8.3. Rest of South America
-
9. Middle-East and Africa
- 9.1. United Arab Emirates
- 9.2. South Africa
- 9.3. Rest of Middle-East and Africa
Sustainable Catering Services Market Segmentation By Geography
-
1. North America
- 1.1. United States
- 1.2. Canada
- 1.3. Mexico
-
2. South America
- 2.1. Brazil
- 2.2. Argentina
- 2.3. Rest of South America
-
3. Europe
- 3.1. United Kingdom
- 3.2. Germany
- 3.3. France
- 3.4. Italy
- 3.5. Spain
- 3.6. Russia
- 3.7. Benelux
- 3.8. Nordics
- 3.9. Rest of Europe
-
4. Middle East & Africa
- 4.1. Turkey
- 4.2. Israel
- 4.3. GCC
- 4.4. North Africa
- 4.5. South Africa
- 4.6. Rest of Middle East & Africa
-
5. Asia Pacific
- 5.1. China
- 5.2. India
- 5.3. Japan
- 5.4. South Korea
- 5.5. ASEAN
- 5.6. Oceania
- 5.7. Rest of Asia Pacific
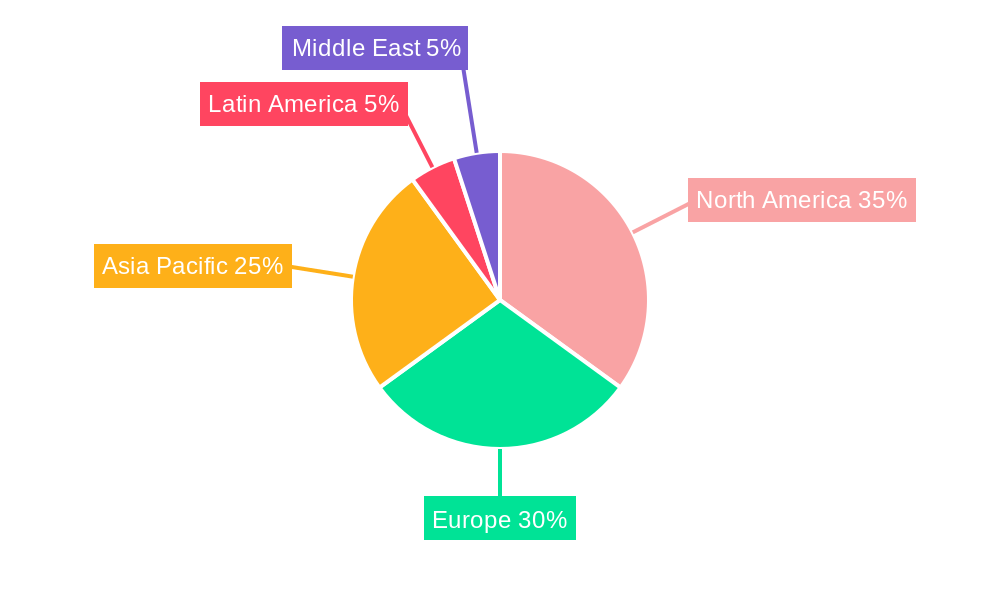
Sustainable Catering Services Market Regional Market Share
Geographic Coverage of Sustainable Catering Services Market
Sustainable Catering Services Market REPORT HIGHLIGHTS
| Aspects | Details |
|---|---|
| Study Period | 2020-2034 |
| Base Year | 2025 |
| Estimated Year | 2026 |
| Forecast Period | 2026-2034 |
| Historical Period | 2020-2025 |
| Growth Rate | CAGR of 2.33% from 2020-2034 |
| Segmentation |
|
Table of Contents
- 1. Introduction
- 1.1. Research Scope
- 1.2. Market Segmentation
- 1.3. Research Objective
- 1.4. Definitions and Assumptions
- 2. Executive Summary
- 2.1. Market Snapshot
- 3. Market Dynamics
- 3.1. Market Drivers
- 3.2. Market Restrains
- 3.3. Market Trends
- 3.4. Market Opportunities
- 4. Market Factor Analysis
- 4.1. Porters Five Forces
- 4.1.1. Bargaining Power of Suppliers
- 4.1.2. Bargaining Power of Buyers
- 4.1.3. Threat of New Entrants
- 4.1.4. Threat of Substitutes
- 4.1.5. Competitive Rivalry
- 4.2. PESTEL analysis
- 4.3. BCG Analysis
- 4.3.1. Stars (High Growth, High Market Share)
- 4.3.2. Cash Cows (Low Growth, High Market Share)
- 4.3.3. Question Mark (High Growth, Low Market Share)
- 4.3.4. Dogs (Low Growth, Low Market Share)
- 4.4. Ansoff Matrix Analysis
- 4.5. Supply Chain Analysis
- 4.6. Regulatory Landscape
- 4.7. Current Market Potential and Opportunity Assessment (TAM–SAM–SOM Framework)
- 4.8. MDP Analyst Note
- 4.1. Porters Five Forces
- 5. Market Analysis, Insights and Forecast 2021-2033
- 5.1. Market Analysis, Insights and Forecast - by Service Type
- 5.1.1. Contractual Catering Services
- 5.1.2. Non-Contractual Catering Services
- 5.1.3. Other Catering Services
- 5.2. Market Analysis, Insights and Forecast - by Event Type
- 5.2.1. Corporate
- 5.2.2. Wedding
- 5.2.3. Social Events
- 5.2.4. Others
- 5.3. Market Analysis, Insights and Forecast - by End-User
- 5.3.1. Individuals
- 5.3.2. Hospitality
- 5.3.3. Educational
- 5.3.4. Healthcare
- 5.3.5. In-Flight
- 5.3.6. Other End Users
- 5.4. Market Analysis, Insights and Forecast - by Geography
- 5.5. Market Analysis, Insights and Forecast - by North America
- 5.5.1. United States
- 5.5.2. Canada
- 5.5.3. Mexico
- 5.5.4. Rest of North America
- 5.6. Market Analysis, Insights and Forecast - by Europe
- 5.6.1. United Kingdom
- 5.6.2. Germany
- 5.6.3. France
- 5.6.4. Russia
- 5.6.5. Italy
- 5.6.6. Spain
- 5.6.7. Rest of Europe
- 5.7. Market Analysis, Insights and Forecast - by Asia-Pacific
- 5.7.1. India
- 5.7.2. China
- 5.7.3. Japan
- 5.7.4. Australia
- 5.7.5. Rest of Asia-Pacific
- 5.8. Market Analysis, Insights and Forecast - by South America
- 5.8.1. Brazil
- 5.8.2. Argentina
- 5.8.3. Rest of South America
- 5.9. Market Analysis, Insights and Forecast - by Middle-East and Africa
- 5.9.1. United Arab Emirates
- 5.9.2. South Africa
- 5.9.3. Rest of Middle-East and Africa
- 5.10. Market Analysis, Insights and Forecast - by Region
- 5.10.1. North America
- 5.10.2. South America
- 5.10.3. Europe
- 5.10.4. Middle East & Africa
- 5.10.5. Asia Pacific
- 5.1. Market Analysis, Insights and Forecast - by Service Type
- 6. Global Sustainable Catering Services Market Analysis, Insights and Forecast, 2021-2033
- 6.1. Market Analysis, Insights and Forecast - by Service Type
- 6.1.1. Contractual Catering Services
- 6.1.2. Non-Contractual Catering Services
- 6.1.3. Other Catering Services
- 6.2. Market Analysis, Insights and Forecast - by Event Type
- 6.2.1. Corporate
- 6.2.2. Wedding
- 6.2.3. Social Events
- 6.2.4. Others
- 6.3. Market Analysis, Insights and Forecast - by End-User
- 6.3.1. Individuals
- 6.3.2. Hospitality
- 6.3.3. Educational
- 6.3.4. Healthcare
- 6.3.5. In-Flight
- 6.3.6. Other End Users
- 6.4. Market Analysis, Insights and Forecast - by Geography
- 6.5. Market Analysis, Insights and Forecast - by North America
- 6.5.1. United States
- 6.5.2. Canada
- 6.5.3. Mexico
- 6.5.4. Rest of North America
- 6.6. Market Analysis, Insights and Forecast - by Europe
- 6.6.1. United Kingdom
- 6.6.2. Germany
- 6.6.3. France
- 6.6.4. Russia
- 6.6.5. Italy
- 6.6.6. Spain
- 6.6.7. Rest of Europe
- 6.7. Market Analysis, Insights and Forecast - by Asia-Pacific
- 6.7.1. India
- 6.7.2. China
- 6.7.3. Japan
- 6.7.4. Australia
- 6.7.5. Rest of Asia-Pacific
- 6.8. Market Analysis, Insights and Forecast - by South America
- 6.8.1. Brazil
- 6.8.2. Argentina
- 6.8.3. Rest of South America
- 6.9. Market Analysis, Insights and Forecast - by Middle-East and Africa
- 6.9.1. United Arab Emirates
- 6.9.2. South Africa
- 6.9.3. Rest of Middle-East and Africa
- 6.1. Market Analysis, Insights and Forecast - by Service Type
- 7. North America Sustainable Catering Services Market Analysis, Insights and Forecast, 2020-2032
- 7.1. Market Analysis, Insights and Forecast - by Service Type
- 7.1.1. Contractual Catering Services
- 7.1.2. Non-Contractual Catering Services
- 7.1.3. Other Catering Services
- 7.2. Market Analysis, Insights and Forecast - by Event Type
- 7.2.1. Corporate
- 7.2.2. Wedding
- 7.2.3. Social Events
- 7.2.4. Others
- 7.3. Market Analysis, Insights and Forecast - by End-User
- 7.3.1. Individuals
- 7.3.2. Hospitality
- 7.3.3. Educational
- 7.3.4. Healthcare
- 7.3.5. In-Flight
- 7.3.6. Other End Users
- 7.4. Market Analysis, Insights and Forecast - by Geography
- 7.5. Market Analysis, Insights and Forecast - by North America
- 7.5.1. United States
- 7.5.2. Canada
- 7.5.3. Mexico
- 7.5.4. Rest of North America
- 7.6. Market Analysis, Insights and Forecast - by Europe
- 7.6.1. United Kingdom
- 7.6.2. Germany
- 7.6.3. France
- 7.6.4. Russia
- 7.6.5. Italy
- 7.6.6. Spain
- 7.6.7. Rest of Europe
- 7.7. Market Analysis, Insights and Forecast - by Asia-Pacific
- 7.7.1. India
- 7.7.2. China
- 7.7.3. Japan
- 7.7.4. Australia
- 7.7.5. Rest of Asia-Pacific
- 7.8. Market Analysis, Insights and Forecast - by South America
- 7.8.1. Brazil
- 7.8.2. Argentina
- 7.8.3. Rest of South America
- 7.9. Market Analysis, Insights and Forecast - by Middle-East and Africa
- 7.9.1. United Arab Emirates
- 7.9.2. South Africa
- 7.9.3. Rest of Middle-East and Africa
- 7.1. Market Analysis, Insights and Forecast - by Service Type
- 8. South America Sustainable Catering Services Market Analysis, Insights and Forecast, 2020-2032
- 8.1. Market Analysis, Insights and Forecast - by Service Type
- 8.1.1. Contractual Catering Services
- 8.1.2. Non-Contractual Catering Services
- 8.1.3. Other Catering Services
- 8.2. Market Analysis, Insights and Forecast - by Event Type
- 8.2.1. Corporate
- 8.2.2. Wedding
- 8.2.3. Social Events
- 8.2.4. Others
- 8.3. Market Analysis, Insights and Forecast - by End-User
- 8.3.1. Individuals
- 8.3.2. Hospitality
- 8.3.3. Educational
- 8.3.4. Healthcare
- 8.3.5. In-Flight
- 8.3.6. Other End Users
- 8.4. Market Analysis, Insights and Forecast - by Geography
- 8.5. Market Analysis, Insights and Forecast - by North America
- 8.5.1. United States
- 8.5.2. Canada
- 8.5.3. Mexico
- 8.5.4. Rest of North America
- 8.6. Market Analysis, Insights and Forecast - by Europe
- 8.6.1. United Kingdom
- 8.6.2. Germany
- 8.6.3. France
- 8.6.4. Russia
- 8.6.5. Italy
- 8.6.6. Spain
- 8.6.7. Rest of Europe
- 8.7. Market Analysis, Insights and Forecast - by Asia-Pacific
- 8.7.1. India
- 8.7.2. China
- 8.7.3. Japan
- 8.7.4. Australia
- 8.7.5. Rest of Asia-Pacific
- 8.8. Market Analysis, Insights and Forecast - by South America
- 8.8.1. Brazil
- 8.8.2. Argentina
- 8.8.3. Rest of South America
- 8.9. Market Analysis, Insights and Forecast - by Middle-East and Africa
- 8.9.1. United Arab Emirates
- 8.9.2. South Africa
- 8.9.3. Rest of Middle-East and Africa
- 8.1. Market Analysis, Insights and Forecast - by Service Type
- 9. Europe Sustainable Catering Services Market Analysis, Insights and Forecast, 2020-2032
- 9.1. Market Analysis, Insights and Forecast - by Service Type
- 9.1.1. Contractual Catering Services
- 9.1.2. Non-Contractual Catering Services
- 9.1.3. Other Catering Services
- 9.2. Market Analysis, Insights and Forecast - by Event Type
- 9.2.1. Corporate
- 9.2.2. Wedding
- 9.2.3. Social Events
- 9.2.4. Others
- 9.3. Market Analysis, Insights and Forecast - by End-User
- 9.3.1. Individuals
- 9.3.2. Hospitality
- 9.3.3. Educational
- 9.3.4. Healthcare
- 9.3.5. In-Flight
- 9.3.6. Other End Users
- 9.4. Market Analysis, Insights and Forecast - by Geography
- 9.5. Market Analysis, Insights and Forecast - by North America
- 9.5.1. United States
- 9.5.2. Canada
- 9.5.3. Mexico
- 9.5.4. Rest of North America
- 9.6. Market Analysis, Insights and Forecast - by Europe
- 9.6.1. United Kingdom
- 9.6.2. Germany
- 9.6.3. France
- 9.6.4. Russia
- 9.6.5. Italy
- 9.6.6. Spain
- 9.6.7. Rest of Europe
- 9.7. Market Analysis, Insights and Forecast - by Asia-Pacific
- 9.7.1. India
- 9.7.2. China
- 9.7.3. Japan
- 9.7.4. Australia
- 9.7.5. Rest of Asia-Pacific
- 9.8. Market Analysis, Insights and Forecast - by South America
- 9.8.1. Brazil
- 9.8.2. Argentina
- 9.8.3. Rest of South America
- 9.9. Market Analysis, Insights and Forecast - by Middle-East and Africa
- 9.9.1. United Arab Emirates
- 9.9.2. South Africa
- 9.9.3. Rest of Middle-East and Africa
- 9.1. Market Analysis, Insights and Forecast - by Service Type
- 10. Middle East & Africa Sustainable Catering Services Market Analysis, Insights and Forecast, 2020-2032
- 10.1. Market Analysis, Insights and Forecast - by Service Type
- 10.1.1. Contractual Catering Services
- 10.1.2. Non-Contractual Catering Services
- 10.1.3. Other Catering Services
- 10.2. Market Analysis, Insights and Forecast - by Event Type
- 10.2.1. Corporate
- 10.2.2. Wedding
- 10.2.3. Social Events
- 10.2.4. Others
- 10.3. Market Analysis, Insights and Forecast - by End-User
- 10.3.1. Individuals
- 10.3.2. Hospitality
- 10.3.3. Educational
- 10.3.4. Healthcare
- 10.3.5. In-Flight
- 10.3.6. Other End Users
- 10.4. Market Analysis, Insights and Forecast - by Geography
- 10.5. Market Analysis, Insights and Forecast - by North America
- 10.5.1. United States
- 10.5.2. Canada
- 10.5.3. Mexico
- 10.5.4. Rest of North America
- 10.6. Market Analysis, Insights and Forecast - by Europe
- 10.6.1. United Kingdom
- 10.6.2. Germany
- 10.6.3. France
- 10.6.4. Russia
- 10.6.5. Italy
- 10.6.6. Spain
- 10.6.7. Rest of Europe
- 10.7. Market Analysis, Insights and Forecast - by Asia-Pacific
- 10.7.1. India
- 10.7.2. China
- 10.7.3. Japan
- 10.7.4. Australia
- 10.7.5. Rest of Asia-Pacific
- 10.8. Market Analysis, Insights and Forecast - by South America
- 10.8.1. Brazil
- 10.8.2. Argentina
- 10.8.3. Rest of South America
- 10.9. Market Analysis, Insights and Forecast - by Middle-East and Africa
- 10.9.1. United Arab Emirates
- 10.9.2. South Africa
- 10.9.3. Rest of Middle-East and Africa
- 10.1. Market Analysis, Insights and Forecast - by Service Type
- 11. Asia Pacific Sustainable Catering Services Market Analysis, Insights and Forecast, 2020-2032
- 11.1. Market Analysis, Insights and Forecast - by Service Type
- 11.1.1. Contractual Catering Services
- 11.1.2. Non-Contractual Catering Services
- 11.1.3. Other Catering Services
- 11.2. Market Analysis, Insights and Forecast - by Event Type
- 11.2.1. Corporate
- 11.2.2. Wedding
- 11.2.3. Social Events
- 11.2.4. Others
- 11.3. Market Analysis, Insights and Forecast - by End-User
- 11.3.1. Individuals
- 11.3.2. Hospitality
- 11.3.3. Educational
- 11.3.4. Healthcare
- 11.3.5. In-Flight
- 11.3.6. Other End Users
- 11.4. Market Analysis, Insights and Forecast - by Geography
- 11.5. Market Analysis, Insights and Forecast - by North America
- 11.5.1. United States
- 11.5.2. Canada
- 11.5.3. Mexico
- 11.5.4. Rest of North America
- 11.6. Market Analysis, Insights and Forecast - by Europe
- 11.6.1. United Kingdom
- 11.6.2. Germany
- 11.6.3. France
- 11.6.4. Russia
- 11.6.5. Italy
- 11.6.6. Spain
- 11.6.7. Rest of Europe
- 11.7. Market Analysis, Insights and Forecast - by Asia-Pacific
- 11.7.1. India
- 11.7.2. China
- 11.7.3. Japan
- 11.7.4. Australia
- 11.7.5. Rest of Asia-Pacific
- 11.8. Market Analysis, Insights and Forecast - by South America
- 11.8.1. Brazil
- 11.8.2. Argentina
- 11.8.3. Rest of South America
- 11.9. Market Analysis, Insights and Forecast - by Middle-East and Africa
- 11.9.1. United Arab Emirates
- 11.9.2. South Africa
- 11.9.3. Rest of Middle-East and Africa
- 11.1. Market Analysis, Insights and Forecast - by Service Type
- 12. Competitive Analysis
- 12.1. Company Profiles
- 12.1.1 Dine Contract Catering**List Not Exhaustive
- 12.1.1.1. Company Overview
- 12.1.1.2. Products
- 12.1.1.3. Company Financials
- 12.1.1.4. SWOT Analysis
- 12.1.2 Aramark Corp
- 12.1.2.1. Company Overview
- 12.1.2.2. Products
- 12.1.2.3. Company Financials
- 12.1.2.4. SWOT Analysis
- 12.1.3 Emirates Flight Catering
- 12.1.3.1. Company Overview
- 12.1.3.2. Products
- 12.1.3.3. Company Financials
- 12.1.3.4. SWOT Analysis
- 12.1.4 Bartlett Mitchell Ltd
- 12.1.4.1. Company Overview
- 12.1.4.2. Products
- 12.1.4.3. Company Financials
- 12.1.4.4. SWOT Analysis
- 12.1.5 ISS A/S
- 12.1.5.1. Company Overview
- 12.1.5.2. Products
- 12.1.5.3. Company Financials
- 12.1.5.4. SWOT Analysis
- 12.1.6 Elior Group
- 12.1.6.1. Company Overview
- 12.1.6.2. Products
- 12.1.6.3. Company Financials
- 12.1.6.4. SWOT Analysis
- 12.1.7 Entier Limited
- 12.1.7.1. Company Overview
- 12.1.7.2. Products
- 12.1.7.3. Company Financials
- 12.1.7.4. SWOT Analysis
- 12.1.8 Compass Group PLC
- 12.1.8.1. Company Overview
- 12.1.8.2. Products
- 12.1.8.3. Company Financials
- 12.1.8.4. SWOT Analysis
- 12.1.9 DO & CO Aktiengesellschaft
- 12.1.9.1. Company Overview
- 12.1.9.2. Products
- 12.1.9.3. Company Financials
- 12.1.9.4. SWOT Analysis
- 12.1.10 CH and Co Catering Group Ltd
- 12.1.10.1. Company Overview
- 12.1.10.2. Products
- 12.1.10.3. Company Financials
- 12.1.10.4. SWOT Analysis
- 12.1.1 Dine Contract Catering**List Not Exhaustive
- 12.2. Market Entropy
- 12.2.1 Company's Key Areas Served
- 12.2.2 Recent Developments
- 12.3. Company Market Share Analysis 2025
- 12.3.1 Top 5 Companies Market Share Analysis
- 12.3.2 Top 3 Companies Market Share Analysis
- 12.4. List of Potential Customers
- 13. Research Methodology
List of Figures
- Figure 1: Global Sustainable Catering Services Market Revenue Breakdown (Million, %) by Region 2025 & 2033
- Figure 2: North America Sustainable Catering Services Market Revenue (Million), by Service Type 2025 & 2033
- Figure 3: North America Sustainable Catering Services Market Revenue Share (%), by Service Type 2025 & 2033
- Figure 4: North America Sustainable Catering Services Market Revenue (Million), by Event Type 2025 & 2033
- Figure 5: North America Sustainable Catering Services Market Revenue Share (%), by Event Type 2025 & 2033
- Figure 6: North America Sustainable Catering Services Market Revenue (Million), by End-User 2025 & 2033
- Figure 7: North America Sustainable Catering Services Market Revenue Share (%), by End-User 2025 & 2033
- Figure 8: North America Sustainable Catering Services Market Revenue (Million), by Geography 2025 & 2033
- Figure 9: North America Sustainable Catering Services Market Revenue Share (%), by Geography 2025 & 2033
- Figure 10: North America Sustainable Catering Services Market Revenue (Million), by North America 2025 & 2033
- Figure 11: North America Sustainable Catering Services Market Revenue Share (%), by North America 2025 & 2033
- Figure 12: North America Sustainable Catering Services Market Revenue (Million), by Europe 2025 & 2033
- Figure 13: North America Sustainable Catering Services Market Revenue Share (%), by Europe 2025 & 2033
- Figure 14: North America Sustainable Catering Services Market Revenue (Million), by Asia-Pacific 2025 & 2033
- Figure 15: North America Sustainable Catering Services Market Revenue Share (%), by Asia-Pacific 2025 & 2033
- Figure 16: North America Sustainable Catering Services Market Revenue (Million), by South America 2025 & 2033
- Figure 17: North America Sustainable Catering Services Market Revenue Share (%), by South America 2025 & 2033
- Figure 18: North America Sustainable Catering Services Market Revenue (Million), by Middle-East and Africa 2025 & 2033
- Figure 19: North America Sustainable Catering Services Market Revenue Share (%), by Middle-East and Africa 2025 & 2033
- Figure 20: North America Sustainable Catering Services Market Revenue (Million), by Country 2025 & 2033
- Figure 21: North America Sustainable Catering Services Market Revenue Share (%), by Country 2025 & 2033
- Figure 22: South America Sustainable Catering Services Market Revenue (Million), by Service Type 2025 & 2033
- Figure 23: South America Sustainable Catering Services Market Revenue Share (%), by Service Type 2025 & 2033
- Figure 24: South America Sustainable Catering Services Market Revenue (Million), by Event Type 2025 & 2033
- Figure 25: South America Sustainable Catering Services Market Revenue Share (%), by Event Type 2025 & 2033
- Figure 26: South America Sustainable Catering Services Market Revenue (Million), by End-User 2025 & 2033
- Figure 27: South America Sustainable Catering Services Market Revenue Share (%), by End-User 2025 & 2033
- Figure 28: South America Sustainable Catering Services Market Revenue (Million), by Geography 2025 & 2033
- Figure 29: South America Sustainable Catering Services Market Revenue Share (%), by Geography 2025 & 2033
- Figure 30: South America Sustainable Catering Services Market Revenue (Million), by North America 2025 & 2033
- Figure 31: South America Sustainable Catering Services Market Revenue Share (%), by North America 2025 & 2033
- Figure 32: South America Sustainable Catering Services Market Revenue (Million), by Europe 2025 & 2033
- Figure 33: South America Sustainable Catering Services Market Revenue Share (%), by Europe 2025 & 2033
- Figure 34: South America Sustainable Catering Services Market Revenue (Million), by Asia-Pacific 2025 & 2033
- Figure 35: South America Sustainable Catering Services Market Revenue Share (%), by Asia-Pacific 2025 & 2033
- Figure 36: South America Sustainable Catering Services Market Revenue (Million), by South America 2025 & 2033
- Figure 37: South America Sustainable Catering Services Market Revenue Share (%), by South America 2025 & 2033
- Figure 38: South America Sustainable Catering Services Market Revenue (Million), by Middle-East and Africa 2025 & 2033
- Figure 39: South America Sustainable Catering Services Market Revenue Share (%), by Middle-East and Africa 2025 & 2033
- Figure 40: South America Sustainable Catering Services Market Revenue (Million), by Country 2025 & 2033
- Figure 41: South America Sustainable Catering Services Market Revenue Share (%), by Country 2025 & 2033
- Figure 42: Europe Sustainable Catering Services Market Revenue (Million), by Service Type 2025 & 2033
- Figure 43: Europe Sustainable Catering Services Market Revenue Share (%), by Service Type 2025 & 2033
- Figure 44: Europe Sustainable Catering Services Market Revenue (Million), by Event Type 2025 & 2033
- Figure 45: Europe Sustainable Catering Services Market Revenue Share (%), by Event Type 2025 & 2033
- Figure 46: Europe Sustainable Catering Services Market Revenue (Million), by End-User 2025 & 2033
- Figure 47: Europe Sustainable Catering Services Market Revenue Share (%), by End-User 2025 & 2033
- Figure 48: Europe Sustainable Catering Services Market Revenue (Million), by Geography 2025 & 2033
- Figure 49: Europe Sustainable Catering Services Market Revenue Share (%), by Geography 2025 & 2033
- Figure 50: Europe Sustainable Catering Services Market Revenue (Million), by North America 2025 & 2033
- Figure 51: Europe Sustainable Catering Services Market Revenue Share (%), by North America 2025 & 2033
- Figure 52: Europe Sustainable Catering Services Market Revenue (Million), by Europe 2025 & 2033
- Figure 53: Europe Sustainable Catering Services Market Revenue Share (%), by Europe 2025 & 2033
- Figure 54: Europe Sustainable Catering Services Market Revenue (Million), by Asia-Pacific 2025 & 2033
- Figure 55: Europe Sustainable Catering Services Market Revenue Share (%), by Asia-Pacific 2025 & 2033
- Figure 56: Europe Sustainable Catering Services Market Revenue (Million), by South America 2025 & 2033
- Figure 57: Europe Sustainable Catering Services Market Revenue Share (%), by South America 2025 & 2033
- Figure 58: Europe Sustainable Catering Services Market Revenue (Million), by Middle-East and Africa 2025 & 2033
- Figure 59: Europe Sustainable Catering Services Market Revenue Share (%), by Middle-East and Africa 2025 & 2033
- Figure 60: Europe Sustainable Catering Services Market Revenue (Million), by Country 2025 & 2033
- Figure 61: Europe Sustainable Catering Services Market Revenue Share (%), by Country 2025 & 2033
- Figure 62: Middle East & Africa Sustainable Catering Services Market Revenue (Million), by Service Type 2025 & 2033
- Figure 63: Middle East & Africa Sustainable Catering Services Market Revenue Share (%), by Service Type 2025 & 2033
- Figure 64: Middle East & Africa Sustainable Catering Services Market Revenue (Million), by Event Type 2025 & 2033
- Figure 65: Middle East & Africa Sustainable Catering Services Market Revenue Share (%), by Event Type 2025 & 2033
- Figure 66: Middle East & Africa Sustainable Catering Services Market Revenue (Million), by End-User 2025 & 2033
- Figure 67: Middle East & Africa Sustainable Catering Services Market Revenue Share (%), by End-User 2025 & 2033
- Figure 68: Middle East & Africa Sustainable Catering Services Market Revenue (Million), by Geography 2025 & 2033
- Figure 69: Middle East & Africa Sustainable Catering Services Market Revenue Share (%), by Geography 2025 & 2033
- Figure 70: Middle East & Africa Sustainable Catering Services Market Revenue (Million), by North America 2025 & 2033
- Figure 71: Middle East & Africa Sustainable Catering Services Market Revenue Share (%), by North America 2025 & 2033
- Figure 72: Middle East & Africa Sustainable Catering Services Market Revenue (Million), by Europe 2025 & 2033
- Figure 73: Middle East & Africa Sustainable Catering Services Market Revenue Share (%), by Europe 2025 & 2033
- Figure 74: Middle East & Africa Sustainable Catering Services Market Revenue (Million), by Asia-Pacific 2025 & 2033
- Figure 75: Middle East & Africa Sustainable Catering Services Market Revenue Share (%), by Asia-Pacific 2025 & 2033
- Figure 76: Middle East & Africa Sustainable Catering Services Market Revenue (Million), by South America 2025 & 2033
- Figure 77: Middle East & Africa Sustainable Catering Services Market Revenue Share (%), by South America 2025 & 2033
- Figure 78: Middle East & Africa Sustainable Catering Services Market Revenue (Million), by Middle-East and Africa 2025 & 2033
- Figure 79: Middle East & Africa Sustainable Catering Services Market Revenue Share (%), by Middle-East and Africa 2025 & 2033
- Figure 80: Middle East & Africa Sustainable Catering Services Market Revenue (Million), by Country 2025 & 2033
- Figure 81: Middle East & Africa Sustainable Catering Services Market Revenue Share (%), by Country 2025 & 2033
- Figure 82: Asia Pacific Sustainable Catering Services Market Revenue (Million), by Service Type 2025 & 2033
- Figure 83: Asia Pacific Sustainable Catering Services Market Revenue Share (%), by Service Type 2025 & 2033
- Figure 84: Asia Pacific Sustainable Catering Services Market Revenue (Million), by Event Type 2025 & 2033
- Figure 85: Asia Pacific Sustainable Catering Services Market Revenue Share (%), by Event Type 2025 & 2033
- Figure 86: Asia Pacific Sustainable Catering Services Market Revenue (Million), by End-User 2025 & 2033
- Figure 87: Asia Pacific Sustainable Catering Services Market Revenue Share (%), by End-User 2025 & 2033
- Figure 88: Asia Pacific Sustainable Catering Services Market Revenue (Million), by Geography 2025 & 2033
- Figure 89: Asia Pacific Sustainable Catering Services Market Revenue Share (%), by Geography 2025 & 2033
- Figure 90: Asia Pacific Sustainable Catering Services Market Revenue (Million), by North America 2025 & 2033
- Figure 91: Asia Pacific Sustainable Catering Services Market Revenue Share (%), by North America 2025 & 2033
- Figure 92: Asia Pacific Sustainable Catering Services Market Revenue (Million), by Europe 2025 & 2033
- Figure 93: Asia Pacific Sustainable Catering Services Market Revenue Share (%), by Europe 2025 & 2033
- Figure 94: Asia Pacific Sustainable Catering Services Market Revenue (Million), by Asia-Pacific 2025 & 2033
- Figure 95: Asia Pacific Sustainable Catering Services Market Revenue Share (%), by Asia-Pacific 2025 & 2033
- Figure 96: Asia Pacific Sustainable Catering Services Market Revenue (Million), by South America 2025 & 2033
- Figure 97: Asia Pacific Sustainable Catering Services Market Revenue Share (%), by South America 2025 & 2033
- Figure 98: Asia Pacific Sustainable Catering Services Market Revenue (Million), by Middle-East and Africa 2025 & 2033
- Figure 99: Asia Pacific Sustainable Catering Services Market Revenue Share (%), by Middle-East and Africa 2025 & 2033
- Figure 100: Asia Pacific Sustainable Catering Services Market Revenue (Million), by Country 2025 & 2033
- Figure 101: Asia Pacific Sustainable Catering Services Market Revenue Share (%), by Country 2025 & 2033
List of Tables
- Table 1: Global Sustainable Catering Services Market Revenue Million Forecast, by Service Type 2020 & 2033
- Table 2: Global Sustainable Catering Services Market Revenue Million Forecast, by Event Type 2020 & 2033
- Table 3: Global Sustainable Catering Services Market Revenue Million Forecast, by End-User 2020 & 2033
- Table 4: Global Sustainable Catering Services Market Revenue Million Forecast, by Geography 2020 & 2033
- Table 5: Global Sustainable Catering Services Market Revenue Million Forecast, by North America 2020 & 2033
- Table 6: Global Sustainable Catering Services Market Revenue Million Forecast, by Europe 2020 & 2033
- Table 7: Global Sustainable Catering Services Market Revenue Million Forecast, by Asia-Pacific 2020 & 2033
- Table 8: Global Sustainable Catering Services Market Revenue Million Forecast, by South America 2020 & 2033
- Table 9: Global Sustainable Catering Services Market Revenue Million Forecast, by Middle-East and Africa 2020 & 2033
- Table 10: Global Sustainable Catering Services Market Revenue Million Forecast, by Region 2020 & 2033
- Table 11: Global Sustainable Catering Services Market Revenue Million Forecast, by Service Type 2020 & 2033
- Table 12: Global Sustainable Catering Services Market Revenue Million Forecast, by Event Type 2020 & 2033
- Table 13: Global Sustainable Catering Services Market Revenue Million Forecast, by End-User 2020 & 2033
- Table 14: Global Sustainable Catering Services Market Revenue Million Forecast, by Geography 2020 & 2033
- Table 15: Global Sustainable Catering Services Market Revenue Million Forecast, by North America 2020 & 2033
- Table 16: Global Sustainable Catering Services Market Revenue Million Forecast, by Europe 2020 & 2033
- Table 17: Global Sustainable Catering Services Market Revenue Million Forecast, by Asia-Pacific 2020 & 2033
- Table 18: Global Sustainable Catering Services Market Revenue Million Forecast, by South America 2020 & 2033
- Table 19: Global Sustainable Catering Services Market Revenue Million Forecast, by Middle-East and Africa 2020 & 2033
- Table 20: Global Sustainable Catering Services Market Revenue Million Forecast, by Country 2020 & 2033
- Table 21: United States Sustainable Catering Services Market Revenue (Million) Forecast, by Application 2020 & 2033
- Table 22: Canada Sustainable Catering Services Market Revenue (Million) Forecast, by Application 2020 & 2033
- Table 23: Mexico Sustainable Catering Services Market Revenue (Million) Forecast, by Application 2020 & 2033
- Table 24: Global Sustainable Catering Services Market Revenue Million Forecast, by Service Type 2020 & 2033
- Table 25: Global Sustainable Catering Services Market Revenue Million Forecast, by Event Type 2020 & 2033
- Table 26: Global Sustainable Catering Services Market Revenue Million Forecast, by End-User 2020 & 2033
- Table 27: Global Sustainable Catering Services Market Revenue Million Forecast, by Geography 2020 & 2033
- Table 28: Global Sustainable Catering Services Market Revenue Million Forecast, by North America 2020 & 2033
- Table 29: Global Sustainable Catering Services Market Revenue Million Forecast, by Europe 2020 & 2033
- Table 30: Global Sustainable Catering Services Market Revenue Million Forecast, by Asia-Pacific 2020 & 2033
- Table 31: Global Sustainable Catering Services Market Revenue Million Forecast, by South America 2020 & 2033
- Table 32: Global Sustainable Catering Services Market Revenue Million Forecast, by Middle-East and Africa 2020 & 2033
- Table 33: Global Sustainable Catering Services Market Revenue Million Forecast, by Country 2020 & 2033
- Table 34: Brazil Sustainable Catering Services Market Revenue (Million) Forecast, by Application 2020 & 2033
- Table 35: Argentina Sustainable Catering Services Market Revenue (Million) Forecast, by Application 2020 & 2033
- Table 36: Rest of South America Sustainable Catering Services Market Revenue (Million) Forecast, by Application 2020 & 2033
- Table 37: Global Sustainable Catering Services Market Revenue Million Forecast, by Service Type 2020 & 2033
- Table 38: Global Sustainable Catering Services Market Revenue Million Forecast, by Event Type 2020 & 2033
- Table 39: Global Sustainable Catering Services Market Revenue Million Forecast, by End-User 2020 & 2033
- Table 40: Global Sustainable Catering Services Market Revenue Million Forecast, by Geography 2020 & 2033
- Table 41: Global Sustainable Catering Services Market Revenue Million Forecast, by North America 2020 & 2033
- Table 42: Global Sustainable Catering Services Market Revenue Million Forecast, by Europe 2020 & 2033
- Table 43: Global Sustainable Catering Services Market Revenue Million Forecast, by Asia-Pacific 2020 & 2033
- Table 44: Global Sustainable Catering Services Market Revenue Million Forecast, by South America 2020 & 2033
- Table 45: Global Sustainable Catering Services Market Revenue Million Forecast, by Middle-East and Africa 2020 & 2033
- Table 46: Global Sustainable Catering Services Market Revenue Million Forecast, by Country 2020 & 2033
- Table 47: United Kingdom Sustainable Catering Services Market Revenue (Million) Forecast, by Application 2020 & 2033
- Table 48: Germany Sustainable Catering Services Market Revenue (Million) Forecast, by Application 2020 & 2033
- Table 49: France Sustainable Catering Services Market Revenue (Million) Forecast, by Application 2020 & 2033
- Table 50: Italy Sustainable Catering Services Market Revenue (Million) Forecast, by Application 2020 & 2033
- Table 51: Spain Sustainable Catering Services Market Revenue (Million) Forecast, by Application 2020 & 2033
- Table 52: Russia Sustainable Catering Services Market Revenue (Million) Forecast, by Application 2020 & 2033
- Table 53: Benelux Sustainable Catering Services Market Revenue (Million) Forecast, by Application 2020 & 2033
- Table 54: Nordics Sustainable Catering Services Market Revenue (Million) Forecast, by Application 2020 & 2033
- Table 55: Rest of Europe Sustainable Catering Services Market Revenue (Million) Forecast, by Application 2020 & 2033
- Table 56: Global Sustainable Catering Services Market Revenue Million Forecast, by Service Type 2020 & 2033
- Table 57: Global Sustainable Catering Services Market Revenue Million Forecast, by Event Type 2020 & 2033
- Table 58: Global Sustainable Catering Services Market Revenue Million Forecast, by End-User 2020 & 2033
- Table 59: Global Sustainable Catering Services Market Revenue Million Forecast, by Geography 2020 & 2033
- Table 60: Global Sustainable Catering Services Market Revenue Million Forecast, by North America 2020 & 2033
- Table 61: Global Sustainable Catering Services Market Revenue Million Forecast, by Europe 2020 & 2033
- Table 62: Global Sustainable Catering Services Market Revenue Million Forecast, by Asia-Pacific 2020 & 2033
- Table 63: Global Sustainable Catering Services Market Revenue Million Forecast, by South America 2020 & 2033
- Table 64: Global Sustainable Catering Services Market Revenue Million Forecast, by Middle-East and Africa 2020 & 2033
- Table 65: Global Sustainable Catering Services Market Revenue Million Forecast, by Country 2020 & 2033
- Table 66: Turkey Sustainable Catering Services Market Revenue (Million) Forecast, by Application 2020 & 2033
- Table 67: Israel Sustainable Catering Services Market Revenue (Million) Forecast, by Application 2020 & 2033
- Table 68: GCC Sustainable Catering Services Market Revenue (Million) Forecast, by Application 2020 & 2033
- Table 69: North Africa Sustainable Catering Services Market Revenue (Million) Forecast, by Application 2020 & 2033
- Table 70: South Africa Sustainable Catering Services Market Revenue (Million) Forecast, by Application 2020 & 2033
- Table 71: Rest of Middle East & Africa Sustainable Catering Services Market Revenue (Million) Forecast, by Application 2020 & 2033
- Table 72: Global Sustainable Catering Services Market Revenue Million Forecast, by Service Type 2020 & 2033
- Table 73: Global Sustainable Catering Services Market Revenue Million Forecast, by Event Type 2020 & 2033
- Table 74: Global Sustainable Catering Services Market Revenue Million Forecast, by End-User 2020 & 2033
- Table 75: Global Sustainable Catering Services Market Revenue Million Forecast, by Geography 2020 & 2033
- Table 76: Global Sustainable Catering Services Market Revenue Million Forecast, by North America 2020 & 2033
- Table 77: Global Sustainable Catering Services Market Revenue Million Forecast, by Europe 2020 & 2033
- Table 78: Global Sustainable Catering Services Market Revenue Million Forecast, by Asia-Pacific 2020 & 2033
- Table 79: Global Sustainable Catering Services Market Revenue Million Forecast, by South America 2020 & 2033
- Table 80: Global Sustainable Catering Services Market Revenue Million Forecast, by Middle-East and Africa 2020 & 2033
- Table 81: Global Sustainable Catering Services Market Revenue Million Forecast, by Country 2020 & 2033
- Table 82: China Sustainable Catering Services Market Revenue (Million) Forecast, by Application 2020 & 2033
- Table 83: India Sustainable Catering Services Market Revenue (Million) Forecast, by Application 2020 & 2033
- Table 84: Japan Sustainable Catering Services Market Revenue (Million) Forecast, by Application 2020 & 2033
- Table 85: South Korea Sustainable Catering Services Market Revenue (Million) Forecast, by Application 2020 & 2033
- Table 86: ASEAN Sustainable Catering Services Market Revenue (Million) Forecast, by Application 2020 & 2033
- Table 87: Oceania Sustainable Catering Services Market Revenue (Million) Forecast, by Application 2020 & 2033
- Table 88: Rest of Asia Pacific Sustainable Catering Services Market Revenue (Million) Forecast, by Application 2020 & 2033
Frequently Asked Questions
1. What is the projected Compound Annual Growth Rate (CAGR) of the Sustainable Catering Services Market?
The projected CAGR is approximately 2.33%.
2. Which companies are prominent players in the Sustainable Catering Services Market?
Key companies in the market include Dine Contract Catering**List Not Exhaustive, Aramark Corp, Emirates Flight Catering, Bartlett Mitchell Ltd, ISS A/S, Elior Group, Entier Limited, Compass Group PLC, DO & CO Aktiengesellschaft, CH and Co Catering Group Ltd.
3. What are the main segments of the Sustainable Catering Services Market?
The market segments include Service Type, Event Type, End-User, Geography, North America, Europe, Asia-Pacific, South America, Middle-East and Africa.
4. Can you provide details about the market size?
The market size is estimated to be USD 115.13 Million as of 2022.
5. What are some drivers contributing to market growth?
Increasing Trend of Outsourcing Food Services; Growing Popularity of Social Events.
6. What are the notable trends driving market growth?
Rise in Demand for Organic Food.
7. Are there any restraints impacting market growth?
Challenges in Sourcing Organic and Local Ingredients; Limited Consumer Awareness and Understanding of Sustainable Catering Practices.
8. Can you provide examples of recent developments in the market?
In January 2024, Compass Group PLC, a leading global food service company, acquired CH&CO, a premium contract and hospitality service provider in the UK and Ireland, for an initial enterprise value of GBP 475 Million (USD 600 Million).
9. What pricing options are available for accessing the report?
Pricing options include single-user, multi-user, and enterprise licenses priced at USD 3800, USD 4500, and USD 5800 respectively.
10. Is the market size provided in terms of value or volume?
The market size is provided in terms of value, measured in Million.
11. Are there any specific market keywords associated with the report?
Yes, the market keyword associated with the report is "Sustainable Catering Services Market," which aids in identifying and referencing the specific market segment covered.
12. How do I determine which pricing option suits my needs best?
The pricing options vary based on user requirements and access needs. Individual users may opt for single-user licenses, while businesses requiring broader access may choose multi-user or enterprise licenses for cost-effective access to the report.
13. Are there any additional resources or data provided in the Sustainable Catering Services Market report?
While the report offers comprehensive insights, it's advisable to review the specific contents or supplementary materials provided to ascertain if additional resources or data are available.
14. How can I stay updated on further developments or reports in the Sustainable Catering Services Market?
To stay informed about further developments, trends, and reports in the Sustainable Catering Services Market, consider subscribing to industry newsletters, following relevant companies and organizations, or regularly checking reputable industry news sources and publications.
Methodology
Step 1 - Identification of Relevant Samples Size from Population Database


Step 2 - Approaches for Defining Global Market Size (Value, Volume* & Price*)

Note*: In applicable scenarios
Step 3 - Data Sources
Primary Research
- Web Analytics
- Survey Reports
- Research Institute
- Latest Research Reports
- Opinion Leaders
Secondary Research
- Annual Reports
- White Paper
- Latest Press Release
- Industry Association
- Paid Database
- Investor Presentations

Step 4 - Data Triangulation
Involves using different sources of information in order to increase the validity of a study
These sources are likely to be stakeholders in a program - participants, other researchers, program staff, other community members, and so on.
Then we put all data in single framework & apply various statistical tools to find out the dynamic on the market.
During the analysis stage, feedback from the stakeholder groups would be compared to determine areas of agreement as well as areas of divergence