

Key Insights
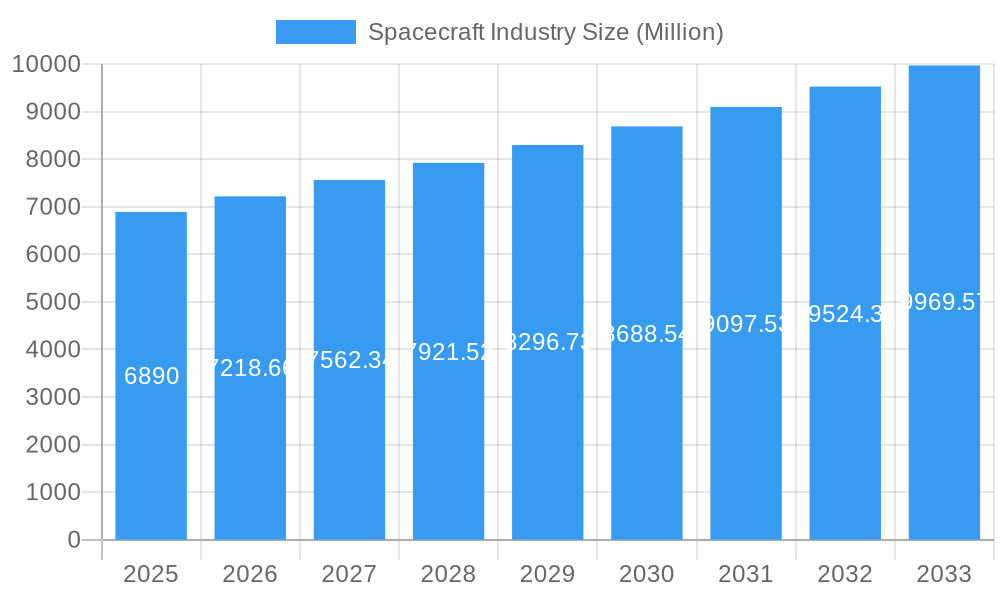
The global spacecraft industry, valued at $6.89 billion in 2025, is projected to experience robust growth, driven by increasing government and private investments in space exploration and related technologies. A Compound Annual Growth Rate (CAGR) of 4.74% from 2025 to 2033 indicates a significant expansion of the market over the forecast period. Key drivers include the growing demand for Earth observation satellites for various applications such as environmental monitoring, disaster management, and agriculture; the increasing need for communication satellites to support global connectivity; and the rising popularity of space tourism. Furthermore, advancements in launch vehicle technologies, miniaturization of spacecraft components, and the emergence of new space technologies, such as reusable rockets and CubeSats, are fueling market growth. The market is segmented by type into manned and unmanned spacecraft, with the unmanned segment expected to dominate due to its cost-effectiveness and suitability for various applications. North America currently holds a significant market share, driven by substantial investments from the US government and the presence of major aerospace companies. However, the Asia-Pacific region is anticipated to witness rapid growth due to increasing space exploration initiatives from nations like China and India.
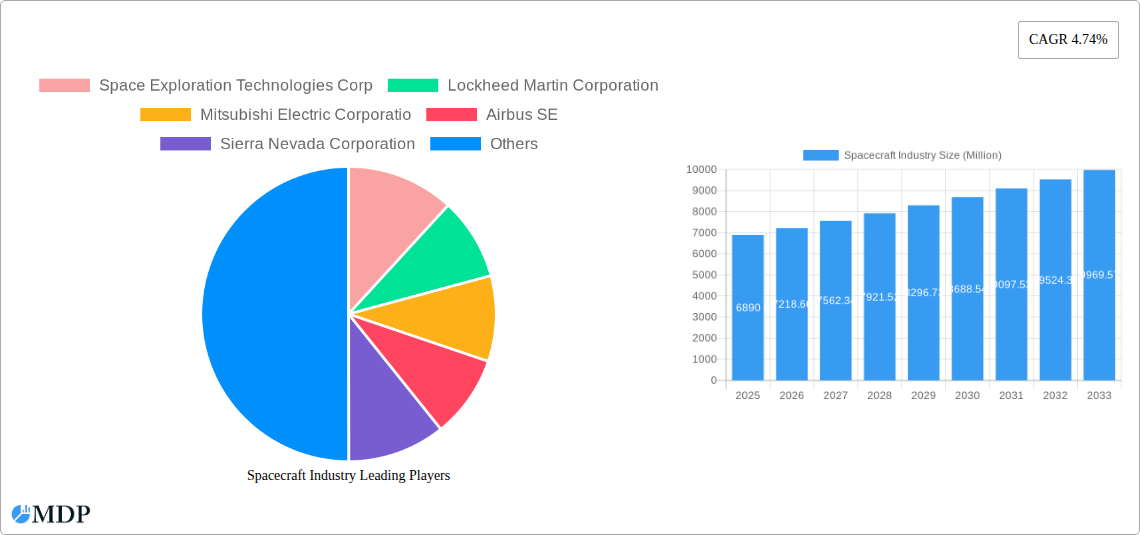
Spacecraft Industry Market Size (In Billion)
Competition in the spacecraft industry is intense, with major players including Space Exploration Technologies Corp (SpaceX), Lockheed Martin, Boeing, Airbus, and several others constantly innovating and expanding their capabilities. This competitive landscape is characterized by mergers and acquisitions, strategic partnerships, and continuous research and development efforts to improve spacecraft technology and reduce launch costs. While the industry faces challenges such as high development and launch costs, regulatory hurdles, and geopolitical factors, the long-term growth prospects remain positive. The increasing accessibility of space through private initiatives and reduced launch costs are anticipated to further stimulate market growth, leading to a wider range of applications and a more diversified industry. Future growth will hinge upon successful technological advancements and the ability of companies to adapt to evolving market demands and government regulations.
Spacecraft Industry Company Market Share
Spacecraft Industry Market Report: 2019-2033
This comprehensive report provides an in-depth analysis of the global spacecraft industry, projecting a market value of $XX Million by 2033. It covers market dynamics, leading players, key trends, and future opportunities, offering crucial insights for stakeholders across the aerospace sector. The report utilizes data from the historical period (2019-2024), the base year (2025), and forecasts from 2025 to 2033.
Spacecraft Industry Market Dynamics & Concentration
The spacecraft industry is characterized by a moderately concentrated market with key players commanding significant shares. Market concentration is influenced by high barriers to entry, including substantial R&D investment, stringent regulatory approvals, and specialized manufacturing capabilities. Innovation drivers such as advancements in propulsion systems, lightweight materials, and autonomous navigation technologies are continuously reshaping the competitive landscape. Regulatory frameworks, varying across nations, significantly impact operational costs and market access. While traditional spacecraft designs dominate, the emergence of reusable spacecraft and smaller, more agile platforms is challenging the status quo. Consolidation through mergers and acquisitions (M&A) is also a prevalent trend, with approximately XX M&A deals recorded in the 2019-2024 period.
- Market Share (2024 Estimate): SpaceX: 25%; Lockheed Martin: 18%; Boeing: 15%; Airbus: 12%; Others: 30%
- Innovation Drivers: Reusable launch vehicles, advanced propulsion, AI-powered navigation.
- Regulatory Frameworks: Varying international space laws, licensing, and safety regulations.
- M&A Activity (2019-2024): XX deals, indicating industry consolidation.
Spacecraft Industry Industry Trends & Analysis
The global spacecraft market is experiencing robust growth, driven by increasing demand for satellite-based services (communication, navigation, Earth observation), governmental investments in space exploration, and the rise of commercial space activities. The Compound Annual Growth Rate (CAGR) is estimated at XX% during the forecast period (2025-2033). Technological advancements, like miniaturization of satellites and improved launch capabilities, are lowering the cost of access to space, further accelerating market expansion. Consumer preferences are shifting towards reliable, cost-effective, and versatile spacecraft solutions. Intense competition among established players and new entrants is driving innovation and efficiency. Market penetration of reusable spacecraft is expected to increase from XX% in 2025 to XX% by 2033.
Leading Markets & Segments in Spacecraft Industry
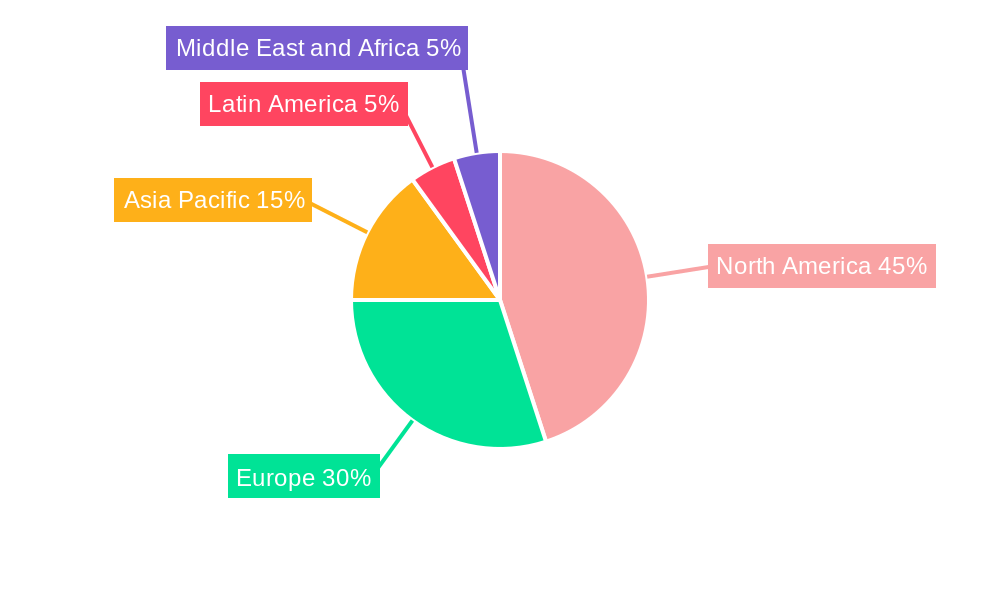
The North American market currently dominates the spacecraft industry, owing to substantial governmental funding for space exploration and a robust private sector presence. However, significant growth is anticipated from Asia-Pacific regions driven by increasing investments in space infrastructure and burgeoning commercial activities.
By Type:
- Manned Spacecraft: This segment is experiencing moderate growth driven by government space programs and commercial space tourism initiatives. Key drivers include advancements in life support systems and improved crew safety protocols.
- Unmanned Spacecraft: This segment is experiencing rapid growth, fueled by the increasing demand for Earth observation, communication, and scientific research missions. The cost-effectiveness and versatility of unmanned spacecraft make them a more attractive option for various applications.
Key Drivers of Regional Dominance:
- North America: Strong government support, advanced technological capabilities, substantial private investment.
- Europe: Well-established aerospace industry, collaborative government-industry partnerships.
- Asia-Pacific: Increasing governmental investment, growing commercial space sector.
Spacecraft Industry Product Developments
Recent years have witnessed significant advancements in spacecraft technology, including the development of reusable launch vehicles, miniaturized satellites, and advanced propulsion systems. These innovations offer improved cost efficiency, higher payload capacity, and enhanced mission flexibility. The market is seeing a shift towards modular and adaptable spacecraft designs, enabling customization for diverse applications. This trend is enhancing market accessibility and encouraging wider adoption across various sectors.
Key Drivers of Spacecraft Industry Growth
Several factors are driving growth in the spacecraft industry. Firstly, technological advancements continuously improve spacecraft performance, reliability, and affordability. Secondly, increased government spending on space exploration and defense programs fuels demand. Thirdly, the expanding commercial space sector, encompassing satellite constellations and space tourism, is creating significant opportunities. Finally, supportive government policies and regulations facilitate innovation and market growth.
Challenges in the Spacecraft Industry Market
The spacecraft industry faces several challenges. High development and manufacturing costs present a significant barrier to entry for smaller companies. Supply chain disruptions can impact production timelines and costs. Stringent safety regulations and licensing procedures increase operational complexity. Finally, intense competition from established players and new entrants creates pressure on pricing and margins. These factors can collectively reduce profitability in this competitive sector.
Emerging Opportunities in Spacecraft Industry
Long-term growth opportunities stem from ongoing technological breakthroughs in areas such as in-space manufacturing, advanced materials, and propulsion systems. Strategic partnerships between government agencies, private companies, and research institutions are paving the way for innovative collaborations. The expansion of space-based services, such as broadband internet and Earth observation, presents lucrative avenues for market expansion. The increasing focus on space sustainability and debris mitigation further presents growth possibilities in this space.
Leading Players in the Spacecraft Industry Sector
Key Milestones in Spacecraft Industry Industry
- November 2023: Sierra Space unveils the “Dream Chaser” space shuttle, capable of carrying seven astronauts and contracted for seven cargo missions to the ISS. This signifies a significant step towards reusable spacecraft and increased commercial space activity.
- January 2024: Japan's SLIM lunar lander successfully lands and re-establishes communication, demonstrating advanced precision landing technology and furthering its ambitions in space exploration. This event highlights advancements in landing technologies and increasing global participation in space missions.
Strategic Outlook for Spacecraft Industry Market
The future of the spacecraft industry is bright, with continued growth driven by technological advancements, increased commercial activity, and government investment. Strategic partnerships, focusing on developing sustainable and cost-effective space technologies, will be critical. The market is poised for expansion into new sectors, driven by the increasing demand for space-based services and exploration initiatives, promising significant growth and diverse opportunities for stakeholders.
Spacecraft Industry Segmentation
- 1. Production Analysis
- 2. Consumption Analysis
- 3. Import Market Analysis (Value & Volume)
- 4. Export Market Analysis (Value & Volume)
- 5. Price Trend Analysis
Spacecraft Industry Segmentation By Geography
-
1. North America
- 1.1. United States
- 1.2. Canada
- 1.3. Mexico
-
2. South America
- 2.1. Brazil
- 2.2. Argentina
- 2.3. Rest of South America
-
3. Europe
- 3.1. United Kingdom
- 3.2. Germany
- 3.3. France
- 3.4. Italy
- 3.5. Spain
- 3.6. Russia
- 3.7. Benelux
- 3.8. Nordics
- 3.9. Rest of Europe
-
4. Middle East & Africa
- 4.1. Turkey
- 4.2. Israel
- 4.3. GCC
- 4.4. North Africa
- 4.5. South Africa
- 4.6. Rest of Middle East & Africa
-
5. Asia Pacific
- 5.1. China
- 5.2. India
- 5.3. Japan
- 5.4. South Korea
- 5.5. ASEAN
- 5.6. Oceania
- 5.7. Rest of Asia Pacific
Spacecraft Industry Regional Market Share
Geographic Coverage of Spacecraft Industry
Spacecraft Industry REPORT HIGHLIGHTS
| Aspects | Details |
|---|---|
| Study Period | 2020-2034 |
| Base Year | 2025 |
| Estimated Year | 2026 |
| Forecast Period | 2026-2034 |
| Historical Period | 2020-2025 |
| Growth Rate | CAGR of 4.74% from 2020-2034 |
| Segmentation |
|
Table of Contents
- 1. Introduction
- 1.1. Research Scope
- 1.2. Market Segmentation
- 1.3. Research Objective
- 1.4. Definitions and Assumptions
- 2. Executive Summary
- 2.1. Market Snapshot
- 3. Market Dynamics
- 3.1. Market Drivers
- 3.2. Market Restrains
- 3.3. Market Trends
- 3.4. Market Opportunities
- 4. Market Factor Analysis
- 4.1. Porters Five Forces
- 4.1.1. Bargaining Power of Suppliers
- 4.1.2. Bargaining Power of Buyers
- 4.1.3. Threat of New Entrants
- 4.1.4. Threat of Substitutes
- 4.1.5. Competitive Rivalry
- 4.2. PESTEL analysis
- 4.3. BCG Analysis
- 4.3.1. Stars (High Growth, High Market Share)
- 4.3.2. Cash Cows (Low Growth, High Market Share)
- 4.3.3. Question Mark (High Growth, Low Market Share)
- 4.3.4. Dogs (Low Growth, Low Market Share)
- 4.4. Ansoff Matrix Analysis
- 4.5. Supply Chain Analysis
- 4.6. Regulatory Landscape
- 4.7. Current Market Potential and Opportunity Assessment (TAM–SAM–SOM Framework)
- 4.8. MDP Analyst Note
- 4.1. Porters Five Forces
- 5. Market Analysis, Insights and Forecast 2021-2033
- 5.1. Market Analysis, Insights and Forecast - by Production Analysis
- 5.2. Market Analysis, Insights and Forecast - by Consumption Analysis
- 5.3. Market Analysis, Insights and Forecast - by Import Market Analysis (Value & Volume)
- 5.4. Market Analysis, Insights and Forecast - by Export Market Analysis (Value & Volume)
- 5.5. Market Analysis, Insights and Forecast - by Price Trend Analysis
- 5.6. Market Analysis, Insights and Forecast - by Region
- 5.6.1. North America
- 5.6.2. South America
- 5.6.3. Europe
- 5.6.4. Middle East & Africa
- 5.6.5. Asia Pacific
- 6. Global Spacecraft Industry Analysis, Insights and Forecast, 2021-2033
- 6.1. Market Analysis, Insights and Forecast - by Production Analysis
- 6.2. Market Analysis, Insights and Forecast - by Consumption Analysis
- 6.3. Market Analysis, Insights and Forecast - by Import Market Analysis (Value & Volume)
- 6.4. Market Analysis, Insights and Forecast - by Export Market Analysis (Value & Volume)
- 6.5. Market Analysis, Insights and Forecast - by Price Trend Analysis
- 7. North America Spacecraft Industry Analysis, Insights and Forecast, 2020-2032
- 7.1. Market Analysis, Insights and Forecast - by Production Analysis
- 7.2. Market Analysis, Insights and Forecast - by Consumption Analysis
- 7.3. Market Analysis, Insights and Forecast - by Import Market Analysis (Value & Volume)
- 7.4. Market Analysis, Insights and Forecast - by Export Market Analysis (Value & Volume)
- 7.5. Market Analysis, Insights and Forecast - by Price Trend Analysis
- 8. South America Spacecraft Industry Analysis, Insights and Forecast, 2020-2032
- 8.1. Market Analysis, Insights and Forecast - by Production Analysis
- 8.2. Market Analysis, Insights and Forecast - by Consumption Analysis
- 8.3. Market Analysis, Insights and Forecast - by Import Market Analysis (Value & Volume)
- 8.4. Market Analysis, Insights and Forecast - by Export Market Analysis (Value & Volume)
- 8.5. Market Analysis, Insights and Forecast - by Price Trend Analysis
- 9. Europe Spacecraft Industry Analysis, Insights and Forecast, 2020-2032
- 9.1. Market Analysis, Insights and Forecast - by Production Analysis
- 9.2. Market Analysis, Insights and Forecast - by Consumption Analysis
- 9.3. Market Analysis, Insights and Forecast - by Import Market Analysis (Value & Volume)
- 9.4. Market Analysis, Insights and Forecast - by Export Market Analysis (Value & Volume)
- 9.5. Market Analysis, Insights and Forecast - by Price Trend Analysis
- 10. Middle East & Africa Spacecraft Industry Analysis, Insights and Forecast, 2020-2032
- 10.1. Market Analysis, Insights and Forecast - by Production Analysis
- 10.2. Market Analysis, Insights and Forecast - by Consumption Analysis
- 10.3. Market Analysis, Insights and Forecast - by Import Market Analysis (Value & Volume)
- 10.4. Market Analysis, Insights and Forecast - by Export Market Analysis (Value & Volume)
- 10.5. Market Analysis, Insights and Forecast - by Price Trend Analysis
- 11. Asia Pacific Spacecraft Industry Analysis, Insights and Forecast, 2020-2032
- 11.1. Market Analysis, Insights and Forecast - by Production Analysis
- 11.2. Market Analysis, Insights and Forecast - by Consumption Analysis
- 11.3. Market Analysis, Insights and Forecast - by Import Market Analysis (Value & Volume)
- 11.4. Market Analysis, Insights and Forecast - by Export Market Analysis (Value & Volume)
- 11.5. Market Analysis, Insights and Forecast - by Price Trend Analysis
- 12. Competitive Analysis
- 12.1. Company Profiles
- 12.1.1 Space Exploration Technologies Corp
- 12.1.1.1. Company Overview
- 12.1.1.2. Products
- 12.1.1.3. Company Financials
- 12.1.1.4. SWOT Analysis
- 12.1.2 Lockheed Martin Corporation
- 12.1.2.1. Company Overview
- 12.1.2.2. Products
- 12.1.2.3. Company Financials
- 12.1.2.4. SWOT Analysis
- 12.1.3 Mitsubishi Electric Corporatio
- 12.1.3.1. Company Overview
- 12.1.3.2. Products
- 12.1.3.3. Company Financials
- 12.1.3.4. SWOT Analysis
- 12.1.4 Airbus SE
- 12.1.4.1. Company Overview
- 12.1.4.2. Products
- 12.1.4.3. Company Financials
- 12.1.4.4. SWOT Analysis
- 12.1.5 Sierra Nevada Corporation
- 12.1.5.1. Company Overview
- 12.1.5.2. Products
- 12.1.5.3. Company Financials
- 12.1.5.4. SWOT Analysis
- 12.1.6 QinetiQ Group
- 12.1.6.1. Company Overview
- 12.1.6.2. Products
- 12.1.6.3. Company Financials
- 12.1.6.4. SWOT Analysis
- 12.1.7 OHB SE
- 12.1.7.1. Company Overview
- 12.1.7.2. Products
- 12.1.7.3. Company Financials
- 12.1.7.4. SWOT Analysis
- 12.1.8 Maxar Technologies Inc
- 12.1.8.1. Company Overview
- 12.1.8.2. Products
- 12.1.8.3. Company Financials
- 12.1.8.4. SWOT Analysis
- 12.1.9 Blue Origin LLC
- 12.1.9.1. Company Overview
- 12.1.9.2. Products
- 12.1.9.3. Company Financials
- 12.1.9.4. SWOT Analysis
- 12.1.10 Berlin Space Technologies GmbH
- 12.1.10.1. Company Overview
- 12.1.10.2. Products
- 12.1.10.3. Company Financials
- 12.1.10.4. SWOT Analysis
- 12.1.11 Northrop Grumman Corporation
- 12.1.11.1. Company Overview
- 12.1.11.2. Products
- 12.1.11.3. Company Financials
- 12.1.11.4. SWOT Analysis
- 12.1.12 The Boeing Company
- 12.1.12.1. Company Overview
- 12.1.12.2. Products
- 12.1.12.3. Company Financials
- 12.1.12.4. SWOT Analysis
- 12.1.1 Space Exploration Technologies Corp
- 12.2. Market Entropy
- 12.2.1 Company's Key Areas Served
- 12.2.2 Recent Developments
- 12.3. Company Market Share Analysis 2025
- 12.3.1 Top 5 Companies Market Share Analysis
- 12.3.2 Top 3 Companies Market Share Analysis
- 12.4. List of Potential Customers
- 13. Research Methodology
List of Figures
- Figure 1: Global Spacecraft Industry Revenue Breakdown (Million, %) by Region 2025 & 2033
- Figure 2: North America Spacecraft Industry Revenue (Million), by Production Analysis 2025 & 2033
- Figure 3: North America Spacecraft Industry Revenue Share (%), by Production Analysis 2025 & 2033
- Figure 4: North America Spacecraft Industry Revenue (Million), by Consumption Analysis 2025 & 2033
- Figure 5: North America Spacecraft Industry Revenue Share (%), by Consumption Analysis 2025 & 2033
- Figure 6: North America Spacecraft Industry Revenue (Million), by Import Market Analysis (Value & Volume) 2025 & 2033
- Figure 7: North America Spacecraft Industry Revenue Share (%), by Import Market Analysis (Value & Volume) 2025 & 2033
- Figure 8: North America Spacecraft Industry Revenue (Million), by Export Market Analysis (Value & Volume) 2025 & 2033
- Figure 9: North America Spacecraft Industry Revenue Share (%), by Export Market Analysis (Value & Volume) 2025 & 2033
- Figure 10: North America Spacecraft Industry Revenue (Million), by Price Trend Analysis 2025 & 2033
- Figure 11: North America Spacecraft Industry Revenue Share (%), by Price Trend Analysis 2025 & 2033
- Figure 12: North America Spacecraft Industry Revenue (Million), by Country 2025 & 2033
- Figure 13: North America Spacecraft Industry Revenue Share (%), by Country 2025 & 2033
- Figure 14: South America Spacecraft Industry Revenue (Million), by Production Analysis 2025 & 2033
- Figure 15: South America Spacecraft Industry Revenue Share (%), by Production Analysis 2025 & 2033
- Figure 16: South America Spacecraft Industry Revenue (Million), by Consumption Analysis 2025 & 2033
- Figure 17: South America Spacecraft Industry Revenue Share (%), by Consumption Analysis 2025 & 2033
- Figure 18: South America Spacecraft Industry Revenue (Million), by Import Market Analysis (Value & Volume) 2025 & 2033
- Figure 19: South America Spacecraft Industry Revenue Share (%), by Import Market Analysis (Value & Volume) 2025 & 2033
- Figure 20: South America Spacecraft Industry Revenue (Million), by Export Market Analysis (Value & Volume) 2025 & 2033
- Figure 21: South America Spacecraft Industry Revenue Share (%), by Export Market Analysis (Value & Volume) 2025 & 2033
- Figure 22: South America Spacecraft Industry Revenue (Million), by Price Trend Analysis 2025 & 2033
- Figure 23: South America Spacecraft Industry Revenue Share (%), by Price Trend Analysis 2025 & 2033
- Figure 24: South America Spacecraft Industry Revenue (Million), by Country 2025 & 2033
- Figure 25: South America Spacecraft Industry Revenue Share (%), by Country 2025 & 2033
- Figure 26: Europe Spacecraft Industry Revenue (Million), by Production Analysis 2025 & 2033
- Figure 27: Europe Spacecraft Industry Revenue Share (%), by Production Analysis 2025 & 2033
- Figure 28: Europe Spacecraft Industry Revenue (Million), by Consumption Analysis 2025 & 2033
- Figure 29: Europe Spacecraft Industry Revenue Share (%), by Consumption Analysis 2025 & 2033
- Figure 30: Europe Spacecraft Industry Revenue (Million), by Import Market Analysis (Value & Volume) 2025 & 2033
- Figure 31: Europe Spacecraft Industry Revenue Share (%), by Import Market Analysis (Value & Volume) 2025 & 2033
- Figure 32: Europe Spacecraft Industry Revenue (Million), by Export Market Analysis (Value & Volume) 2025 & 2033
- Figure 33: Europe Spacecraft Industry Revenue Share (%), by Export Market Analysis (Value & Volume) 2025 & 2033
- Figure 34: Europe Spacecraft Industry Revenue (Million), by Price Trend Analysis 2025 & 2033
- Figure 35: Europe Spacecraft Industry Revenue Share (%), by Price Trend Analysis 2025 & 2033
- Figure 36: Europe Spacecraft Industry Revenue (Million), by Country 2025 & 2033
- Figure 37: Europe Spacecraft Industry Revenue Share (%), by Country 2025 & 2033
- Figure 38: Middle East & Africa Spacecraft Industry Revenue (Million), by Production Analysis 2025 & 2033
- Figure 39: Middle East & Africa Spacecraft Industry Revenue Share (%), by Production Analysis 2025 & 2033
- Figure 40: Middle East & Africa Spacecraft Industry Revenue (Million), by Consumption Analysis 2025 & 2033
- Figure 41: Middle East & Africa Spacecraft Industry Revenue Share (%), by Consumption Analysis 2025 & 2033
- Figure 42: Middle East & Africa Spacecraft Industry Revenue (Million), by Import Market Analysis (Value & Volume) 2025 & 2033
- Figure 43: Middle East & Africa Spacecraft Industry Revenue Share (%), by Import Market Analysis (Value & Volume) 2025 & 2033
- Figure 44: Middle East & Africa Spacecraft Industry Revenue (Million), by Export Market Analysis (Value & Volume) 2025 & 2033
- Figure 45: Middle East & Africa Spacecraft Industry Revenue Share (%), by Export Market Analysis (Value & Volume) 2025 & 2033
- Figure 46: Middle East & Africa Spacecraft Industry Revenue (Million), by Price Trend Analysis 2025 & 2033
- Figure 47: Middle East & Africa Spacecraft Industry Revenue Share (%), by Price Trend Analysis 2025 & 2033
- Figure 48: Middle East & Africa Spacecraft Industry Revenue (Million), by Country 2025 & 2033
- Figure 49: Middle East & Africa Spacecraft Industry Revenue Share (%), by Country 2025 & 2033
- Figure 50: Asia Pacific Spacecraft Industry Revenue (Million), by Production Analysis 2025 & 2033
- Figure 51: Asia Pacific Spacecraft Industry Revenue Share (%), by Production Analysis 2025 & 2033
- Figure 52: Asia Pacific Spacecraft Industry Revenue (Million), by Consumption Analysis 2025 & 2033
- Figure 53: Asia Pacific Spacecraft Industry Revenue Share (%), by Consumption Analysis 2025 & 2033
- Figure 54: Asia Pacific Spacecraft Industry Revenue (Million), by Import Market Analysis (Value & Volume) 2025 & 2033
- Figure 55: Asia Pacific Spacecraft Industry Revenue Share (%), by Import Market Analysis (Value & Volume) 2025 & 2033
- Figure 56: Asia Pacific Spacecraft Industry Revenue (Million), by Export Market Analysis (Value & Volume) 2025 & 2033
- Figure 57: Asia Pacific Spacecraft Industry Revenue Share (%), by Export Market Analysis (Value & Volume) 2025 & 2033
- Figure 58: Asia Pacific Spacecraft Industry Revenue (Million), by Price Trend Analysis 2025 & 2033
- Figure 59: Asia Pacific Spacecraft Industry Revenue Share (%), by Price Trend Analysis 2025 & 2033
- Figure 60: Asia Pacific Spacecraft Industry Revenue (Million), by Country 2025 & 2033
- Figure 61: Asia Pacific Spacecraft Industry Revenue Share (%), by Country 2025 & 2033
List of Tables
- Table 1: Global Spacecraft Industry Revenue Million Forecast, by Production Analysis 2020 & 2033
- Table 2: Global Spacecraft Industry Revenue Million Forecast, by Consumption Analysis 2020 & 2033
- Table 3: Global Spacecraft Industry Revenue Million Forecast, by Import Market Analysis (Value & Volume) 2020 & 2033
- Table 4: Global Spacecraft Industry Revenue Million Forecast, by Export Market Analysis (Value & Volume) 2020 & 2033
- Table 5: Global Spacecraft Industry Revenue Million Forecast, by Price Trend Analysis 2020 & 2033
- Table 6: Global Spacecraft Industry Revenue Million Forecast, by Region 2020 & 2033
- Table 7: Global Spacecraft Industry Revenue Million Forecast, by Production Analysis 2020 & 2033
- Table 8: Global Spacecraft Industry Revenue Million Forecast, by Consumption Analysis 2020 & 2033
- Table 9: Global Spacecraft Industry Revenue Million Forecast, by Import Market Analysis (Value & Volume) 2020 & 2033
- Table 10: Global Spacecraft Industry Revenue Million Forecast, by Export Market Analysis (Value & Volume) 2020 & 2033
- Table 11: Global Spacecraft Industry Revenue Million Forecast, by Price Trend Analysis 2020 & 2033
- Table 12: Global Spacecraft Industry Revenue Million Forecast, by Country 2020 & 2033
- Table 13: United States Spacecraft Industry Revenue (Million) Forecast, by Application 2020 & 2033
- Table 14: Canada Spacecraft Industry Revenue (Million) Forecast, by Application 2020 & 2033
- Table 15: Mexico Spacecraft Industry Revenue (Million) Forecast, by Application 2020 & 2033
- Table 16: Global Spacecraft Industry Revenue Million Forecast, by Production Analysis 2020 & 2033
- Table 17: Global Spacecraft Industry Revenue Million Forecast, by Consumption Analysis 2020 & 2033
- Table 18: Global Spacecraft Industry Revenue Million Forecast, by Import Market Analysis (Value & Volume) 2020 & 2033
- Table 19: Global Spacecraft Industry Revenue Million Forecast, by Export Market Analysis (Value & Volume) 2020 & 2033
- Table 20: Global Spacecraft Industry Revenue Million Forecast, by Price Trend Analysis 2020 & 2033
- Table 21: Global Spacecraft Industry Revenue Million Forecast, by Country 2020 & 2033
- Table 22: Brazil Spacecraft Industry Revenue (Million) Forecast, by Application 2020 & 2033
- Table 23: Argentina Spacecraft Industry Revenue (Million) Forecast, by Application 2020 & 2033
- Table 24: Rest of South America Spacecraft Industry Revenue (Million) Forecast, by Application 2020 & 2033
- Table 25: Global Spacecraft Industry Revenue Million Forecast, by Production Analysis 2020 & 2033
- Table 26: Global Spacecraft Industry Revenue Million Forecast, by Consumption Analysis 2020 & 2033
- Table 27: Global Spacecraft Industry Revenue Million Forecast, by Import Market Analysis (Value & Volume) 2020 & 2033
- Table 28: Global Spacecraft Industry Revenue Million Forecast, by Export Market Analysis (Value & Volume) 2020 & 2033
- Table 29: Global Spacecraft Industry Revenue Million Forecast, by Price Trend Analysis 2020 & 2033
- Table 30: Global Spacecraft Industry Revenue Million Forecast, by Country 2020 & 2033
- Table 31: United Kingdom Spacecraft Industry Revenue (Million) Forecast, by Application 2020 & 2033
- Table 32: Germany Spacecraft Industry Revenue (Million) Forecast, by Application 2020 & 2033
- Table 33: France Spacecraft Industry Revenue (Million) Forecast, by Application 2020 & 2033
- Table 34: Italy Spacecraft Industry Revenue (Million) Forecast, by Application 2020 & 2033
- Table 35: Spain Spacecraft Industry Revenue (Million) Forecast, by Application 2020 & 2033
- Table 36: Russia Spacecraft Industry Revenue (Million) Forecast, by Application 2020 & 2033
- Table 37: Benelux Spacecraft Industry Revenue (Million) Forecast, by Application 2020 & 2033
- Table 38: Nordics Spacecraft Industry Revenue (Million) Forecast, by Application 2020 & 2033
- Table 39: Rest of Europe Spacecraft Industry Revenue (Million) Forecast, by Application 2020 & 2033
- Table 40: Global Spacecraft Industry Revenue Million Forecast, by Production Analysis 2020 & 2033
- Table 41: Global Spacecraft Industry Revenue Million Forecast, by Consumption Analysis 2020 & 2033
- Table 42: Global Spacecraft Industry Revenue Million Forecast, by Import Market Analysis (Value & Volume) 2020 & 2033
- Table 43: Global Spacecraft Industry Revenue Million Forecast, by Export Market Analysis (Value & Volume) 2020 & 2033
- Table 44: Global Spacecraft Industry Revenue Million Forecast, by Price Trend Analysis 2020 & 2033
- Table 45: Global Spacecraft Industry Revenue Million Forecast, by Country 2020 & 2033
- Table 46: Turkey Spacecraft Industry Revenue (Million) Forecast, by Application 2020 & 2033
- Table 47: Israel Spacecraft Industry Revenue (Million) Forecast, by Application 2020 & 2033
- Table 48: GCC Spacecraft Industry Revenue (Million) Forecast, by Application 2020 & 2033
- Table 49: North Africa Spacecraft Industry Revenue (Million) Forecast, by Application 2020 & 2033
- Table 50: South Africa Spacecraft Industry Revenue (Million) Forecast, by Application 2020 & 2033
- Table 51: Rest of Middle East & Africa Spacecraft Industry Revenue (Million) Forecast, by Application 2020 & 2033
- Table 52: Global Spacecraft Industry Revenue Million Forecast, by Production Analysis 2020 & 2033
- Table 53: Global Spacecraft Industry Revenue Million Forecast, by Consumption Analysis 2020 & 2033
- Table 54: Global Spacecraft Industry Revenue Million Forecast, by Import Market Analysis (Value & Volume) 2020 & 2033
- Table 55: Global Spacecraft Industry Revenue Million Forecast, by Export Market Analysis (Value & Volume) 2020 & 2033
- Table 56: Global Spacecraft Industry Revenue Million Forecast, by Price Trend Analysis 2020 & 2033
- Table 57: Global Spacecraft Industry Revenue Million Forecast, by Country 2020 & 2033
- Table 58: China Spacecraft Industry Revenue (Million) Forecast, by Application 2020 & 2033
- Table 59: India Spacecraft Industry Revenue (Million) Forecast, by Application 2020 & 2033
- Table 60: Japan Spacecraft Industry Revenue (Million) Forecast, by Application 2020 & 2033
- Table 61: South Korea Spacecraft Industry Revenue (Million) Forecast, by Application 2020 & 2033
- Table 62: ASEAN Spacecraft Industry Revenue (Million) Forecast, by Application 2020 & 2033
- Table 63: Oceania Spacecraft Industry Revenue (Million) Forecast, by Application 2020 & 2033
- Table 64: Rest of Asia Pacific Spacecraft Industry Revenue (Million) Forecast, by Application 2020 & 2033
Frequently Asked Questions
1. What is the projected Compound Annual Growth Rate (CAGR) of the Spacecraft Industry?
The projected CAGR is approximately 4.74%.
2. Which companies are prominent players in the Spacecraft Industry?
Key companies in the market include Space Exploration Technologies Corp, Lockheed Martin Corporation, Mitsubishi Electric Corporatio, Airbus SE, Sierra Nevada Corporation, QinetiQ Group, OHB SE, Maxar Technologies Inc, Blue Origin LLC, Berlin Space Technologies GmbH, Northrop Grumman Corporation, The Boeing Company.
3. What are the main segments of the Spacecraft Industry?
The market segments include Production Analysis, Consumption Analysis, Import Market Analysis (Value & Volume), Export Market Analysis (Value & Volume), Price Trend Analysis.
4. Can you provide details about the market size?
The market size is estimated to be USD 6.89 Million as of 2022.
5. What are some drivers contributing to market growth?
Increase in Internet of Things (IoT) and Autonomous Systems; Rise in Demand for Military and Defense Satellite Communication Solutions.
6. What are the notable trends driving market growth?
Unmanned Spacecraft to Dominate Market Share During the Forecast Period.
7. Are there any restraints impacting market growth?
Cybersecurity Threats to Satellite Communication; Interference in Transmission of Data.
8. Can you provide examples of recent developments in the market?
January 2024: Japan launched a spacecraft on the Moon to demonstrate precision landing technology and reinvigorate its space program. The Japan Aerospace Exploration Agency's (JAXA) Smart Lander for Investigating Moon (SLIM) landed on the Moon's surface and re-established communication with Earth. By reducing the cost of launching, Japan aims to carry out more frequent missions in the future.
9. What pricing options are available for accessing the report?
Pricing options include single-user, multi-user, and enterprise licenses priced at USD 4750, USD 5250, and USD 8750 respectively.
10. Is the market size provided in terms of value or volume?
The market size is provided in terms of value, measured in Million.
11. Are there any specific market keywords associated with the report?
Yes, the market keyword associated with the report is "Spacecraft Industry," which aids in identifying and referencing the specific market segment covered.
12. How do I determine which pricing option suits my needs best?
The pricing options vary based on user requirements and access needs. Individual users may opt for single-user licenses, while businesses requiring broader access may choose multi-user or enterprise licenses for cost-effective access to the report.
13. Are there any additional resources or data provided in the Spacecraft Industry report?
While the report offers comprehensive insights, it's advisable to review the specific contents or supplementary materials provided to ascertain if additional resources or data are available.
14. How can I stay updated on further developments or reports in the Spacecraft Industry?
To stay informed about further developments, trends, and reports in the Spacecraft Industry, consider subscribing to industry newsletters, following relevant companies and organizations, or regularly checking reputable industry news sources and publications.
Methodology
Step 1 - Identification of Relevant Samples Size from Population Database


Step 2 - Approaches for Defining Global Market Size (Value, Volume* & Price*)

Note*: In applicable scenarios
Step 3 - Data Sources
Primary Research
- Web Analytics
- Survey Reports
- Research Institute
- Latest Research Reports
- Opinion Leaders
Secondary Research
- Annual Reports
- White Paper
- Latest Press Release
- Industry Association
- Paid Database
- Investor Presentations

Step 4 - Data Triangulation
Involves using different sources of information in order to increase the validity of a study
These sources are likely to be stakeholders in a program - participants, other researchers, program staff, other community members, and so on.
Then we put all data in single framework & apply various statistical tools to find out the dynamic on the market.
During the analysis stage, feedback from the stakeholder groups would be compared to determine areas of agreement as well as areas of divergence