

Key Insights
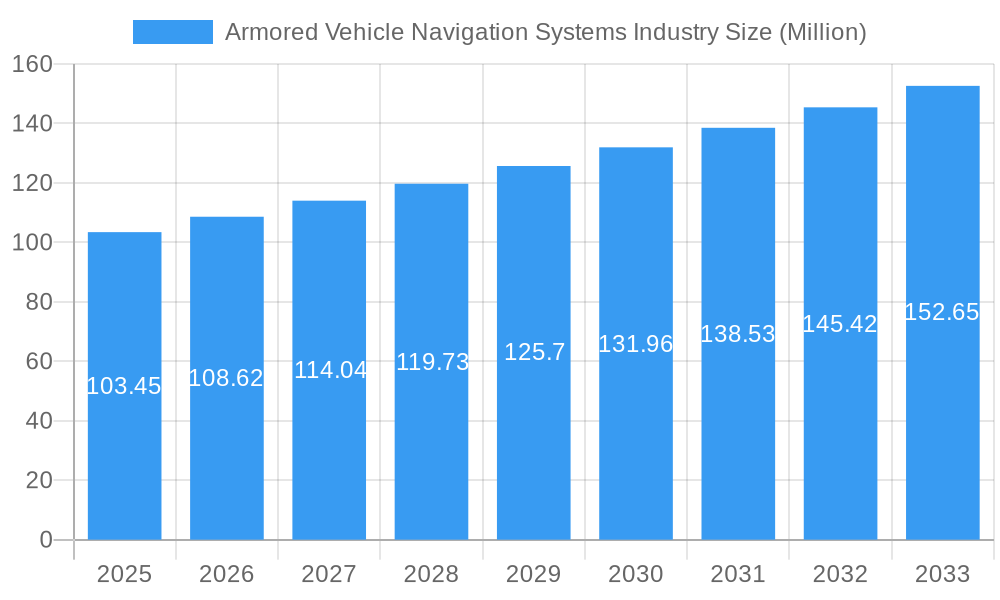
The Armored Vehicle Navigation Systems market, valued at $103.45 million in 2025, is projected to experience robust growth, driven by increasing demand for enhanced situational awareness and precision navigation in military operations. A compound annual growth rate (CAGR) of 4.92% from 2025 to 2033 indicates a significant market expansion. Key growth drivers include the modernization of existing armored vehicle fleets, the integration of advanced technologies such as GPS and inertial navigation systems, and the rising geopolitical instability leading to increased defense spending globally. The market is segmented by navigation system type (Inertial Navigation Systems and Satellite Navigation Systems) and armored vehicle type (Main Battle Tanks, Infantry Fighting Vehicles, Armored Personnel Carriers, and others), with satellite navigation systems expected to hold a larger market share due to their superior accuracy and reliability. Technological advancements, such as the integration of artificial intelligence and improved mapping capabilities, are key trends shaping the market. However, factors like the high initial investment costs of advanced navigation systems and potential cyber security vulnerabilities pose challenges to market growth. Regional analysis suggests that North America and Europe will remain dominant markets due to their substantial defense budgets and technological advancements; however, the Asia-Pacific region is poised for significant growth fueled by increasing defense modernization initiatives in countries like India and China. The competitive landscape is characterized by major players such as Honeywell International Inc., Thales, and BAE Systems, among others, constantly innovating and vying for market share through product development and strategic partnerships.
Armored Vehicle Navigation Systems Industry Market Size (In Million)
The forecast period of 2025-2033 shows a continuous upward trend in the market value, largely driven by the factors mentioned above. The increasing sophistication of military tactics, requiring precise navigation and coordination, fuels the demand for advanced navigation systems. Furthermore, the ongoing development of more resilient and secure navigation technologies will contribute to the sustained growth. Competition among key players will likely intensify, driving innovation and potentially lowering prices in the long term. However, careful consideration of cybersecurity threats and the implementation of robust security protocols will be crucial for long-term market stability. The continuous evolution of navigation technology and its integration with other armored vehicle systems will be paramount in maintaining the market’s upward trajectory.
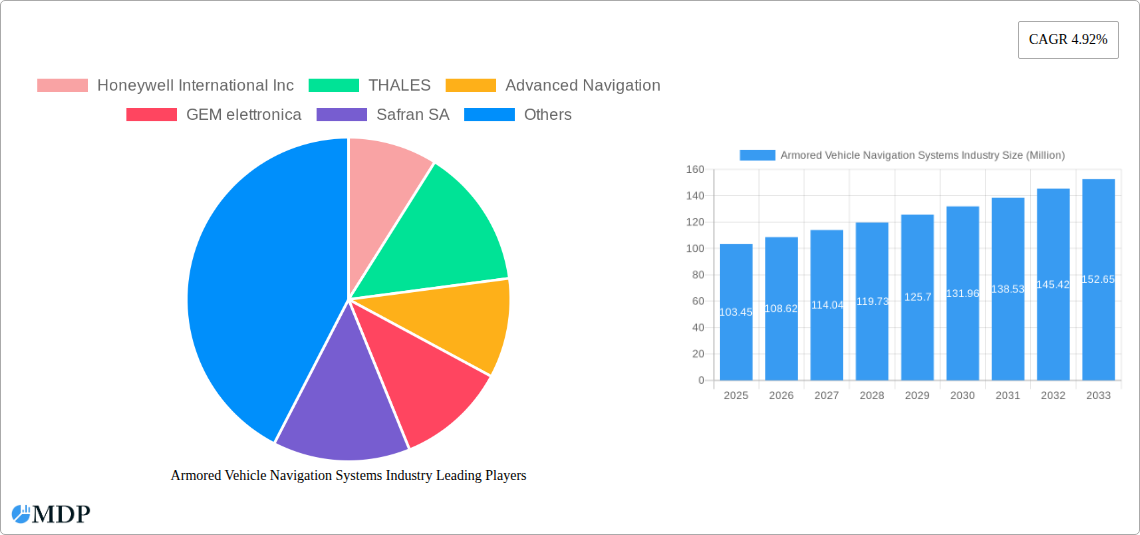
Armored Vehicle Navigation Systems Industry Company Market Share
Armored Vehicle Navigation Systems Industry: Market Analysis & Forecast 2019-2033
A comprehensive report analyzing market dynamics, trends, leading players, and future growth potential in the Armored Vehicle Navigation Systems industry. This in-depth study covers the period 2019-2033, with a focus on the 2025-2033 forecast period and base year of 2025. The report provides actionable insights for industry stakeholders, including manufacturers, suppliers, government agencies, and investors. The global market size is expected to reach xx Million by 2033, exhibiting a CAGR of xx% during the forecast period.
Armored Vehicle Navigation Systems Industry Market Dynamics & Concentration
The Armored Vehicle Navigation Systems market is characterized by a moderately concentrated landscape, with key players like Honeywell International Inc, Thales, and RTX Corporation holding significant market share. Market concentration is further influenced by factors such as technological advancements, stringent regulatory frameworks, and the increasing demand for sophisticated navigation systems in various armored vehicle types. The historical period (2019-2024) witnessed xx M&A deals, reflecting the consolidation efforts within the industry. Innovation is driven by the need for improved accuracy, reliability, and integration with other vehicle systems. Product substitutes, such as traditional map-based navigation, are gradually being replaced by advanced solutions. End-user trends reveal a strong preference for systems offering enhanced situational awareness, improved route planning capabilities, and seamless integration with communication networks.
- Market Share: Honeywell International Inc (xx%), Thales (xx%), RTX Corporation (xx%), Others (xx%).
- M&A Activity: xx deals between 2019-2024, with a projected xx deals during 2025-2033.
- Key Innovation Drivers: Enhanced accuracy, improved reliability, integration with communication systems, miniaturization, and cost reduction.
- Regulatory Framework: Compliance with military standards and cybersecurity regulations.
Armored Vehicle Navigation Systems Industry Industry Trends & Analysis
The Armored Vehicle Navigation Systems market is experiencing robust growth, driven by increasing defense budgets globally, modernization of armored vehicle fleets, and the growing adoption of advanced navigation technologies. Technological disruptions, such as the integration of AI and machine learning, are enhancing the capabilities of navigation systems. Consumer preferences are shifting towards systems offering greater precision, enhanced situational awareness, and improved user interfaces. Competitive dynamics are intense, with companies focusing on product differentiation, strategic partnerships, and technological innovation to gain market share. The market is expected to grow from xx Million in 2025 to xx Million by 2033, exhibiting a robust CAGR of xx%. Market penetration for advanced navigation systems in armored vehicles is projected to reach xx% by 2033, driven by factors such as improved accuracy, reliability, and reduced reliance on traditional methods.
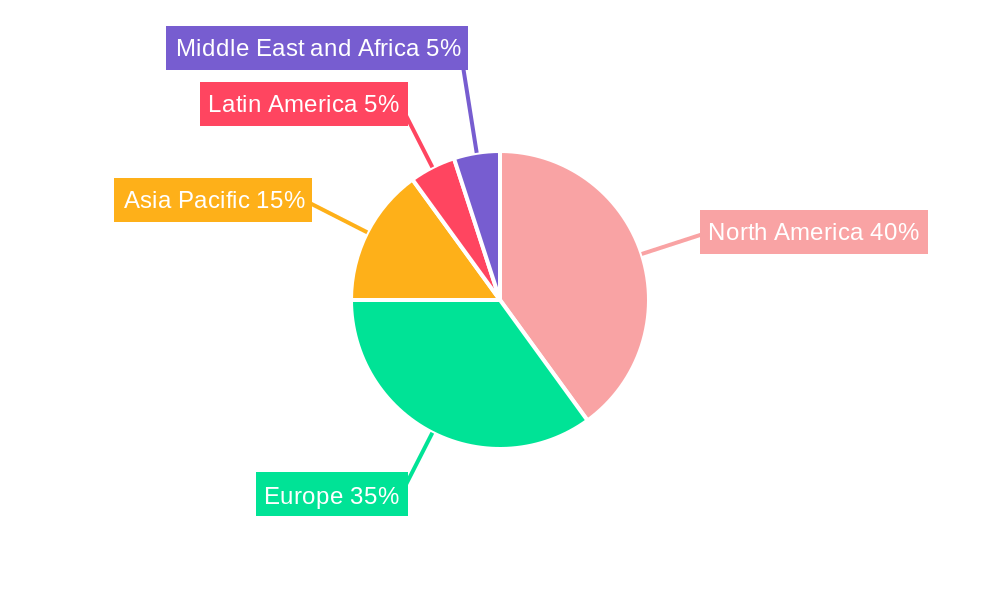
Leading Markets & Segments in Armored Vehicle Navigation Systems Industry
The North American region currently dominates the Armored Vehicle Navigation Systems market, driven by strong defense spending and a large fleet of armored vehicles. Within segments, Main Battle Tanks and Infantry Fighting Vehicles account for a significant share of the market due to their higher technological sophistication and demand for precise navigation. Satellite Navigation Systems are experiencing rapid growth owing to their improved accuracy and coverage compared to inertial navigation systems.
Key Drivers:
- North America: High defense budgets, technological advancements, and strong demand from military and law enforcement agencies.
- Europe: Modernization of armored vehicle fleets, increased defense spending, and robust technological capabilities.
- Asia-Pacific: Growing defense budgets, modernization of armed forces, and rising demand for advanced navigation systems.
Segment Dominance:
- Armored Vehicle Type: Main Battle Tanks (xx Million), Infantry Fighting Vehicles (xx Million), Armored Personnel Carriers (xx Million), Other Armored Vehicle Types (xx Million).
- Navigation System: Satellite Navigation Systems (xx Million), Inertial Navigation Systems (xx Million).
Armored Vehicle Navigation Systems Industry Product Developments
Recent product innovations focus on enhanced accuracy, improved reliability, and integration with other vehicle systems. The adoption of advanced technologies such as AI, machine learning, and improved sensor fusion is enhancing the capabilities of navigation systems. These advancements provide armored vehicles with enhanced situational awareness, improved route planning capabilities, and improved survivability. The market is also witnessing the development of more compact and lightweight navigation systems, suitable for various armored vehicle types. The market fit for these innovations is strong, driven by the demand for advanced navigation systems in modern warfare.
Key Drivers of Armored Vehicle Navigation Systems Industry Growth
The growth of the Armored Vehicle Navigation Systems market is propelled by several factors. Increased defense spending globally fuels demand for advanced navigation systems. Technological advancements, such as the integration of AI and improved sensor fusion, enhance system capabilities. Stringent regulatory requirements mandating the use of advanced navigation systems in armored vehicles further contribute to market growth. Finally, the modernization of armored vehicle fleets and replacement of older systems are contributing significantly to market expansion.
Challenges in the Armored Vehicle Navigation Systems Industry Market
The Armored Vehicle Navigation Systems market faces challenges such as stringent regulatory compliance requirements, leading to higher development costs and time-to-market. Supply chain disruptions and component shortages can impact production and delivery schedules. Intense competition among established players and emerging companies puts pressure on pricing and profitability. Cybersecurity threats necessitate robust security measures, adding complexity and cost to system development. These factors collectively impact market growth and profitability.
Emerging Opportunities in Armored Vehicle Navigation Systems Industry
Significant opportunities exist for growth in the Armored Vehicle Navigation Systems market. Technological breakthroughs, like the integration of augmented reality and improved sensor fusion, offer enhanced capabilities. Strategic partnerships between navigation system manufacturers and armored vehicle producers can facilitate seamless system integration and faster market adoption. Market expansion into emerging regions, such as Africa and South America, presents significant growth potential. These factors indicate a robust long-term outlook for this industry.
Leading Players in the Armored Vehicle Navigation Systems Industry Sector
- Honeywell International Inc
- THALES
- Advanced Navigation
- GEM elettronica
- Safran SA
- Israel Aerospace Industries Ltd
- KVH Industries Inc
- RTX Corporation
- BAE Systems plc
- Northrop Grumman Corporation
- Bharat Electronics Limited (BEL)
- Hertz Systems
Key Milestones in Armored Vehicle Navigation Systems Industry Industry
- 2020: Introduction of AI-powered navigation system by Honeywell International Inc.
- 2021: Thales launched a new satellite navigation system with improved accuracy.
- 2022: RTX Corporation acquired a smaller navigation system company, expanding its product portfolio.
- 2023: Several key players announced partnerships to develop integrated navigation and communication systems.
- 2024: Increased adoption of advanced navigation systems by several armed forces.
Strategic Outlook for Armored Vehicle Navigation Systems Market
The Armored Vehicle Navigation Systems market is poised for continued growth, driven by technological advancements, increasing defense budgets, and modernization efforts. Strategic partnerships and collaborations will play a crucial role in fostering innovation and accelerating market penetration. Focus on developing cost-effective and highly reliable systems will be vital for sustained growth. Expanding into emerging markets and catering to the evolving needs of diverse customer segments will be key to unlocking the full market potential.
Armored Vehicle Navigation Systems Industry Segmentation
- 1. Production Analysis
- 2. Consumption Analysis
- 3. Import Market Analysis (Value & Volume)
- 4. Export Market Analysis (Value & Volume)
- 5. Price Trend Analysis
Armored Vehicle Navigation Systems Industry Segmentation By Geography
-
1. North America
- 1.1. United States
- 1.2. Canada
- 1.3. Mexico
-
2. South America
- 2.1. Brazil
- 2.2. Argentina
- 2.3. Rest of South America
-
3. Europe
- 3.1. United Kingdom
- 3.2. Germany
- 3.3. France
- 3.4. Italy
- 3.5. Spain
- 3.6. Russia
- 3.7. Benelux
- 3.8. Nordics
- 3.9. Rest of Europe
-
4. Middle East & Africa
- 4.1. Turkey
- 4.2. Israel
- 4.3. GCC
- 4.4. North Africa
- 4.5. South Africa
- 4.6. Rest of Middle East & Africa
-
5. Asia Pacific
- 5.1. China
- 5.2. India
- 5.3. Japan
- 5.4. South Korea
- 5.5. ASEAN
- 5.6. Oceania
- 5.7. Rest of Asia Pacific
Armored Vehicle Navigation Systems Industry Regional Market Share
Geographic Coverage of Armored Vehicle Navigation Systems Industry
Armored Vehicle Navigation Systems Industry REPORT HIGHLIGHTS
| Aspects | Details |
|---|---|
| Study Period | 2020-2034 |
| Base Year | 2025 |
| Estimated Year | 2026 |
| Forecast Period | 2026-2034 |
| Historical Period | 2020-2025 |
| Growth Rate | CAGR of 4.92% from 2020-2034 |
| Segmentation |
|
Table of Contents
- 1. Introduction
- 1.1. Research Scope
- 1.2. Market Segmentation
- 1.3. Research Objective
- 1.4. Definitions and Assumptions
- 2. Executive Summary
- 2.1. Market Snapshot
- 3. Market Dynamics
- 3.1. Market Drivers
- 3.2. Market Restrains
- 3.3. Market Trends
- 3.4. Market Opportunities
- 4. Market Factor Analysis
- 4.1. Porters Five Forces
- 4.1.1. Bargaining Power of Suppliers
- 4.1.2. Bargaining Power of Buyers
- 4.1.3. Threat of New Entrants
- 4.1.4. Threat of Substitutes
- 4.1.5. Competitive Rivalry
- 4.2. PESTEL analysis
- 4.3. BCG Analysis
- 4.3.1. Stars (High Growth, High Market Share)
- 4.3.2. Cash Cows (Low Growth, High Market Share)
- 4.3.3. Question Mark (High Growth, Low Market Share)
- 4.3.4. Dogs (Low Growth, Low Market Share)
- 4.4. Ansoff Matrix Analysis
- 4.5. Supply Chain Analysis
- 4.6. Regulatory Landscape
- 4.7. Current Market Potential and Opportunity Assessment (TAM–SAM–SOM Framework)
- 4.8. MDP Analyst Note
- 4.1. Porters Five Forces
- 5. Market Analysis, Insights and Forecast 2021-2033
- 5.1. Market Analysis, Insights and Forecast - by Production Analysis
- 5.2. Market Analysis, Insights and Forecast - by Consumption Analysis
- 5.3. Market Analysis, Insights and Forecast - by Import Market Analysis (Value & Volume)
- 5.4. Market Analysis, Insights and Forecast - by Export Market Analysis (Value & Volume)
- 5.5. Market Analysis, Insights and Forecast - by Price Trend Analysis
- 5.6. Market Analysis, Insights and Forecast - by Region
- 5.6.1. North America
- 5.6.2. South America
- 5.6.3. Europe
- 5.6.4. Middle East & Africa
- 5.6.5. Asia Pacific
- 6. Global Armored Vehicle Navigation Systems Industry Analysis, Insights and Forecast, 2021-2033
- 6.1. Market Analysis, Insights and Forecast - by Production Analysis
- 6.2. Market Analysis, Insights and Forecast - by Consumption Analysis
- 6.3. Market Analysis, Insights and Forecast - by Import Market Analysis (Value & Volume)
- 6.4. Market Analysis, Insights and Forecast - by Export Market Analysis (Value & Volume)
- 6.5. Market Analysis, Insights and Forecast - by Price Trend Analysis
- 7. North America Armored Vehicle Navigation Systems Industry Analysis, Insights and Forecast, 2020-2032
- 7.1. Market Analysis, Insights and Forecast - by Production Analysis
- 7.2. Market Analysis, Insights and Forecast - by Consumption Analysis
- 7.3. Market Analysis, Insights and Forecast - by Import Market Analysis (Value & Volume)
- 7.4. Market Analysis, Insights and Forecast - by Export Market Analysis (Value & Volume)
- 7.5. Market Analysis, Insights and Forecast - by Price Trend Analysis
- 8. South America Armored Vehicle Navigation Systems Industry Analysis, Insights and Forecast, 2020-2032
- 8.1. Market Analysis, Insights and Forecast - by Production Analysis
- 8.2. Market Analysis, Insights and Forecast - by Consumption Analysis
- 8.3. Market Analysis, Insights and Forecast - by Import Market Analysis (Value & Volume)
- 8.4. Market Analysis, Insights and Forecast - by Export Market Analysis (Value & Volume)
- 8.5. Market Analysis, Insights and Forecast - by Price Trend Analysis
- 9. Europe Armored Vehicle Navigation Systems Industry Analysis, Insights and Forecast, 2020-2032
- 9.1. Market Analysis, Insights and Forecast - by Production Analysis
- 9.2. Market Analysis, Insights and Forecast - by Consumption Analysis
- 9.3. Market Analysis, Insights and Forecast - by Import Market Analysis (Value & Volume)
- 9.4. Market Analysis, Insights and Forecast - by Export Market Analysis (Value & Volume)
- 9.5. Market Analysis, Insights and Forecast - by Price Trend Analysis
- 10. Middle East & Africa Armored Vehicle Navigation Systems Industry Analysis, Insights and Forecast, 2020-2032
- 10.1. Market Analysis, Insights and Forecast - by Production Analysis
- 10.2. Market Analysis, Insights and Forecast - by Consumption Analysis
- 10.3. Market Analysis, Insights and Forecast - by Import Market Analysis (Value & Volume)
- 10.4. Market Analysis, Insights and Forecast - by Export Market Analysis (Value & Volume)
- 10.5. Market Analysis, Insights and Forecast - by Price Trend Analysis
- 11. Asia Pacific Armored Vehicle Navigation Systems Industry Analysis, Insights and Forecast, 2020-2032
- 11.1. Market Analysis, Insights and Forecast - by Production Analysis
- 11.2. Market Analysis, Insights and Forecast - by Consumption Analysis
- 11.3. Market Analysis, Insights and Forecast - by Import Market Analysis (Value & Volume)
- 11.4. Market Analysis, Insights and Forecast - by Export Market Analysis (Value & Volume)
- 11.5. Market Analysis, Insights and Forecast - by Price Trend Analysis
- 12. Competitive Analysis
- 12.1. Company Profiles
- 12.1.1 Honeywell International Inc
- 12.1.1.1. Company Overview
- 12.1.1.2. Products
- 12.1.1.3. Company Financials
- 12.1.1.4. SWOT Analysis
- 12.1.2 THALES
- 12.1.2.1. Company Overview
- 12.1.2.2. Products
- 12.1.2.3. Company Financials
- 12.1.2.4. SWOT Analysis
- 12.1.3 Advanced Navigation
- 12.1.3.1. Company Overview
- 12.1.3.2. Products
- 12.1.3.3. Company Financials
- 12.1.3.4. SWOT Analysis
- 12.1.4 GEM elettronica
- 12.1.4.1. Company Overview
- 12.1.4.2. Products
- 12.1.4.3. Company Financials
- 12.1.4.4. SWOT Analysis
- 12.1.5 Safran SA
- 12.1.5.1. Company Overview
- 12.1.5.2. Products
- 12.1.5.3. Company Financials
- 12.1.5.4. SWOT Analysis
- 12.1.6 Israel Aerospace Industries Ltd
- 12.1.6.1. Company Overview
- 12.1.6.2. Products
- 12.1.6.3. Company Financials
- 12.1.6.4. SWOT Analysis
- 12.1.7 KVH Industries Inc
- 12.1.7.1. Company Overview
- 12.1.7.2. Products
- 12.1.7.3. Company Financials
- 12.1.7.4. SWOT Analysis
- 12.1.8 RTX Corporatio
- 12.1.8.1. Company Overview
- 12.1.8.2. Products
- 12.1.8.3. Company Financials
- 12.1.8.4. SWOT Analysis
- 12.1.9 BAE Systems plc
- 12.1.9.1. Company Overview
- 12.1.9.2. Products
- 12.1.9.3. Company Financials
- 12.1.9.4. SWOT Analysis
- 12.1.10 Northrop Grumman Corporation
- 12.1.10.1. Company Overview
- 12.1.10.2. Products
- 12.1.10.3. Company Financials
- 12.1.10.4. SWOT Analysis
- 12.1.11 Bharat Electronics Limited (BEL)
- 12.1.11.1. Company Overview
- 12.1.11.2. Products
- 12.1.11.3. Company Financials
- 12.1.11.4. SWOT Analysis
- 12.1.12 Hertz Systems
- 12.1.12.1. Company Overview
- 12.1.12.2. Products
- 12.1.12.3. Company Financials
- 12.1.12.4. SWOT Analysis
- 12.1.1 Honeywell International Inc
- 12.2. Market Entropy
- 12.2.1 Company's Key Areas Served
- 12.2.2 Recent Developments
- 12.3. Company Market Share Analysis 2025
- 12.3.1 Top 5 Companies Market Share Analysis
- 12.3.2 Top 3 Companies Market Share Analysis
- 12.4. List of Potential Customers
- 13. Research Methodology
List of Figures
- Figure 1: Global Armored Vehicle Navigation Systems Industry Revenue Breakdown (Million, %) by Region 2025 & 2033
- Figure 2: North America Armored Vehicle Navigation Systems Industry Revenue (Million), by Production Analysis 2025 & 2033
- Figure 3: North America Armored Vehicle Navigation Systems Industry Revenue Share (%), by Production Analysis 2025 & 2033
- Figure 4: North America Armored Vehicle Navigation Systems Industry Revenue (Million), by Consumption Analysis 2025 & 2033
- Figure 5: North America Armored Vehicle Navigation Systems Industry Revenue Share (%), by Consumption Analysis 2025 & 2033
- Figure 6: North America Armored Vehicle Navigation Systems Industry Revenue (Million), by Import Market Analysis (Value & Volume) 2025 & 2033
- Figure 7: North America Armored Vehicle Navigation Systems Industry Revenue Share (%), by Import Market Analysis (Value & Volume) 2025 & 2033
- Figure 8: North America Armored Vehicle Navigation Systems Industry Revenue (Million), by Export Market Analysis (Value & Volume) 2025 & 2033
- Figure 9: North America Armored Vehicle Navigation Systems Industry Revenue Share (%), by Export Market Analysis (Value & Volume) 2025 & 2033
- Figure 10: North America Armored Vehicle Navigation Systems Industry Revenue (Million), by Price Trend Analysis 2025 & 2033
- Figure 11: North America Armored Vehicle Navigation Systems Industry Revenue Share (%), by Price Trend Analysis 2025 & 2033
- Figure 12: North America Armored Vehicle Navigation Systems Industry Revenue (Million), by Country 2025 & 2033
- Figure 13: North America Armored Vehicle Navigation Systems Industry Revenue Share (%), by Country 2025 & 2033
- Figure 14: South America Armored Vehicle Navigation Systems Industry Revenue (Million), by Production Analysis 2025 & 2033
- Figure 15: South America Armored Vehicle Navigation Systems Industry Revenue Share (%), by Production Analysis 2025 & 2033
- Figure 16: South America Armored Vehicle Navigation Systems Industry Revenue (Million), by Consumption Analysis 2025 & 2033
- Figure 17: South America Armored Vehicle Navigation Systems Industry Revenue Share (%), by Consumption Analysis 2025 & 2033
- Figure 18: South America Armored Vehicle Navigation Systems Industry Revenue (Million), by Import Market Analysis (Value & Volume) 2025 & 2033
- Figure 19: South America Armored Vehicle Navigation Systems Industry Revenue Share (%), by Import Market Analysis (Value & Volume) 2025 & 2033
- Figure 20: South America Armored Vehicle Navigation Systems Industry Revenue (Million), by Export Market Analysis (Value & Volume) 2025 & 2033
- Figure 21: South America Armored Vehicle Navigation Systems Industry Revenue Share (%), by Export Market Analysis (Value & Volume) 2025 & 2033
- Figure 22: South America Armored Vehicle Navigation Systems Industry Revenue (Million), by Price Trend Analysis 2025 & 2033
- Figure 23: South America Armored Vehicle Navigation Systems Industry Revenue Share (%), by Price Trend Analysis 2025 & 2033
- Figure 24: South America Armored Vehicle Navigation Systems Industry Revenue (Million), by Country 2025 & 2033
- Figure 25: South America Armored Vehicle Navigation Systems Industry Revenue Share (%), by Country 2025 & 2033
- Figure 26: Europe Armored Vehicle Navigation Systems Industry Revenue (Million), by Production Analysis 2025 & 2033
- Figure 27: Europe Armored Vehicle Navigation Systems Industry Revenue Share (%), by Production Analysis 2025 & 2033
- Figure 28: Europe Armored Vehicle Navigation Systems Industry Revenue (Million), by Consumption Analysis 2025 & 2033
- Figure 29: Europe Armored Vehicle Navigation Systems Industry Revenue Share (%), by Consumption Analysis 2025 & 2033
- Figure 30: Europe Armored Vehicle Navigation Systems Industry Revenue (Million), by Import Market Analysis (Value & Volume) 2025 & 2033
- Figure 31: Europe Armored Vehicle Navigation Systems Industry Revenue Share (%), by Import Market Analysis (Value & Volume) 2025 & 2033
- Figure 32: Europe Armored Vehicle Navigation Systems Industry Revenue (Million), by Export Market Analysis (Value & Volume) 2025 & 2033
- Figure 33: Europe Armored Vehicle Navigation Systems Industry Revenue Share (%), by Export Market Analysis (Value & Volume) 2025 & 2033
- Figure 34: Europe Armored Vehicle Navigation Systems Industry Revenue (Million), by Price Trend Analysis 2025 & 2033
- Figure 35: Europe Armored Vehicle Navigation Systems Industry Revenue Share (%), by Price Trend Analysis 2025 & 2033
- Figure 36: Europe Armored Vehicle Navigation Systems Industry Revenue (Million), by Country 2025 & 2033
- Figure 37: Europe Armored Vehicle Navigation Systems Industry Revenue Share (%), by Country 2025 & 2033
- Figure 38: Middle East & Africa Armored Vehicle Navigation Systems Industry Revenue (Million), by Production Analysis 2025 & 2033
- Figure 39: Middle East & Africa Armored Vehicle Navigation Systems Industry Revenue Share (%), by Production Analysis 2025 & 2033
- Figure 40: Middle East & Africa Armored Vehicle Navigation Systems Industry Revenue (Million), by Consumption Analysis 2025 & 2033
- Figure 41: Middle East & Africa Armored Vehicle Navigation Systems Industry Revenue Share (%), by Consumption Analysis 2025 & 2033
- Figure 42: Middle East & Africa Armored Vehicle Navigation Systems Industry Revenue (Million), by Import Market Analysis (Value & Volume) 2025 & 2033
- Figure 43: Middle East & Africa Armored Vehicle Navigation Systems Industry Revenue Share (%), by Import Market Analysis (Value & Volume) 2025 & 2033
- Figure 44: Middle East & Africa Armored Vehicle Navigation Systems Industry Revenue (Million), by Export Market Analysis (Value & Volume) 2025 & 2033
- Figure 45: Middle East & Africa Armored Vehicle Navigation Systems Industry Revenue Share (%), by Export Market Analysis (Value & Volume) 2025 & 2033
- Figure 46: Middle East & Africa Armored Vehicle Navigation Systems Industry Revenue (Million), by Price Trend Analysis 2025 & 2033
- Figure 47: Middle East & Africa Armored Vehicle Navigation Systems Industry Revenue Share (%), by Price Trend Analysis 2025 & 2033
- Figure 48: Middle East & Africa Armored Vehicle Navigation Systems Industry Revenue (Million), by Country 2025 & 2033
- Figure 49: Middle East & Africa Armored Vehicle Navigation Systems Industry Revenue Share (%), by Country 2025 & 2033
- Figure 50: Asia Pacific Armored Vehicle Navigation Systems Industry Revenue (Million), by Production Analysis 2025 & 2033
- Figure 51: Asia Pacific Armored Vehicle Navigation Systems Industry Revenue Share (%), by Production Analysis 2025 & 2033
- Figure 52: Asia Pacific Armored Vehicle Navigation Systems Industry Revenue (Million), by Consumption Analysis 2025 & 2033
- Figure 53: Asia Pacific Armored Vehicle Navigation Systems Industry Revenue Share (%), by Consumption Analysis 2025 & 2033
- Figure 54: Asia Pacific Armored Vehicle Navigation Systems Industry Revenue (Million), by Import Market Analysis (Value & Volume) 2025 & 2033
- Figure 55: Asia Pacific Armored Vehicle Navigation Systems Industry Revenue Share (%), by Import Market Analysis (Value & Volume) 2025 & 2033
- Figure 56: Asia Pacific Armored Vehicle Navigation Systems Industry Revenue (Million), by Export Market Analysis (Value & Volume) 2025 & 2033
- Figure 57: Asia Pacific Armored Vehicle Navigation Systems Industry Revenue Share (%), by Export Market Analysis (Value & Volume) 2025 & 2033
- Figure 58: Asia Pacific Armored Vehicle Navigation Systems Industry Revenue (Million), by Price Trend Analysis 2025 & 2033
- Figure 59: Asia Pacific Armored Vehicle Navigation Systems Industry Revenue Share (%), by Price Trend Analysis 2025 & 2033
- Figure 60: Asia Pacific Armored Vehicle Navigation Systems Industry Revenue (Million), by Country 2025 & 2033
- Figure 61: Asia Pacific Armored Vehicle Navigation Systems Industry Revenue Share (%), by Country 2025 & 2033
List of Tables
- Table 1: Global Armored Vehicle Navigation Systems Industry Revenue Million Forecast, by Production Analysis 2020 & 2033
- Table 2: Global Armored Vehicle Navigation Systems Industry Revenue Million Forecast, by Consumption Analysis 2020 & 2033
- Table 3: Global Armored Vehicle Navigation Systems Industry Revenue Million Forecast, by Import Market Analysis (Value & Volume) 2020 & 2033
- Table 4: Global Armored Vehicle Navigation Systems Industry Revenue Million Forecast, by Export Market Analysis (Value & Volume) 2020 & 2033
- Table 5: Global Armored Vehicle Navigation Systems Industry Revenue Million Forecast, by Price Trend Analysis 2020 & 2033
- Table 6: Global Armored Vehicle Navigation Systems Industry Revenue Million Forecast, by Region 2020 & 2033
- Table 7: Global Armored Vehicle Navigation Systems Industry Revenue Million Forecast, by Production Analysis 2020 & 2033
- Table 8: Global Armored Vehicle Navigation Systems Industry Revenue Million Forecast, by Consumption Analysis 2020 & 2033
- Table 9: Global Armored Vehicle Navigation Systems Industry Revenue Million Forecast, by Import Market Analysis (Value & Volume) 2020 & 2033
- Table 10: Global Armored Vehicle Navigation Systems Industry Revenue Million Forecast, by Export Market Analysis (Value & Volume) 2020 & 2033
- Table 11: Global Armored Vehicle Navigation Systems Industry Revenue Million Forecast, by Price Trend Analysis 2020 & 2033
- Table 12: Global Armored Vehicle Navigation Systems Industry Revenue Million Forecast, by Country 2020 & 2033
- Table 13: United States Armored Vehicle Navigation Systems Industry Revenue (Million) Forecast, by Application 2020 & 2033
- Table 14: Canada Armored Vehicle Navigation Systems Industry Revenue (Million) Forecast, by Application 2020 & 2033
- Table 15: Mexico Armored Vehicle Navigation Systems Industry Revenue (Million) Forecast, by Application 2020 & 2033
- Table 16: Global Armored Vehicle Navigation Systems Industry Revenue Million Forecast, by Production Analysis 2020 & 2033
- Table 17: Global Armored Vehicle Navigation Systems Industry Revenue Million Forecast, by Consumption Analysis 2020 & 2033
- Table 18: Global Armored Vehicle Navigation Systems Industry Revenue Million Forecast, by Import Market Analysis (Value & Volume) 2020 & 2033
- Table 19: Global Armored Vehicle Navigation Systems Industry Revenue Million Forecast, by Export Market Analysis (Value & Volume) 2020 & 2033
- Table 20: Global Armored Vehicle Navigation Systems Industry Revenue Million Forecast, by Price Trend Analysis 2020 & 2033
- Table 21: Global Armored Vehicle Navigation Systems Industry Revenue Million Forecast, by Country 2020 & 2033
- Table 22: Brazil Armored Vehicle Navigation Systems Industry Revenue (Million) Forecast, by Application 2020 & 2033
- Table 23: Argentina Armored Vehicle Navigation Systems Industry Revenue (Million) Forecast, by Application 2020 & 2033
- Table 24: Rest of South America Armored Vehicle Navigation Systems Industry Revenue (Million) Forecast, by Application 2020 & 2033
- Table 25: Global Armored Vehicle Navigation Systems Industry Revenue Million Forecast, by Production Analysis 2020 & 2033
- Table 26: Global Armored Vehicle Navigation Systems Industry Revenue Million Forecast, by Consumption Analysis 2020 & 2033
- Table 27: Global Armored Vehicle Navigation Systems Industry Revenue Million Forecast, by Import Market Analysis (Value & Volume) 2020 & 2033
- Table 28: Global Armored Vehicle Navigation Systems Industry Revenue Million Forecast, by Export Market Analysis (Value & Volume) 2020 & 2033
- Table 29: Global Armored Vehicle Navigation Systems Industry Revenue Million Forecast, by Price Trend Analysis 2020 & 2033
- Table 30: Global Armored Vehicle Navigation Systems Industry Revenue Million Forecast, by Country 2020 & 2033
- Table 31: United Kingdom Armored Vehicle Navigation Systems Industry Revenue (Million) Forecast, by Application 2020 & 2033
- Table 32: Germany Armored Vehicle Navigation Systems Industry Revenue (Million) Forecast, by Application 2020 & 2033
- Table 33: France Armored Vehicle Navigation Systems Industry Revenue (Million) Forecast, by Application 2020 & 2033
- Table 34: Italy Armored Vehicle Navigation Systems Industry Revenue (Million) Forecast, by Application 2020 & 2033
- Table 35: Spain Armored Vehicle Navigation Systems Industry Revenue (Million) Forecast, by Application 2020 & 2033
- Table 36: Russia Armored Vehicle Navigation Systems Industry Revenue (Million) Forecast, by Application 2020 & 2033
- Table 37: Benelux Armored Vehicle Navigation Systems Industry Revenue (Million) Forecast, by Application 2020 & 2033
- Table 38: Nordics Armored Vehicle Navigation Systems Industry Revenue (Million) Forecast, by Application 2020 & 2033
- Table 39: Rest of Europe Armored Vehicle Navigation Systems Industry Revenue (Million) Forecast, by Application 2020 & 2033
- Table 40: Global Armored Vehicle Navigation Systems Industry Revenue Million Forecast, by Production Analysis 2020 & 2033
- Table 41: Global Armored Vehicle Navigation Systems Industry Revenue Million Forecast, by Consumption Analysis 2020 & 2033
- Table 42: Global Armored Vehicle Navigation Systems Industry Revenue Million Forecast, by Import Market Analysis (Value & Volume) 2020 & 2033
- Table 43: Global Armored Vehicle Navigation Systems Industry Revenue Million Forecast, by Export Market Analysis (Value & Volume) 2020 & 2033
- Table 44: Global Armored Vehicle Navigation Systems Industry Revenue Million Forecast, by Price Trend Analysis 2020 & 2033
- Table 45: Global Armored Vehicle Navigation Systems Industry Revenue Million Forecast, by Country 2020 & 2033
- Table 46: Turkey Armored Vehicle Navigation Systems Industry Revenue (Million) Forecast, by Application 2020 & 2033
- Table 47: Israel Armored Vehicle Navigation Systems Industry Revenue (Million) Forecast, by Application 2020 & 2033
- Table 48: GCC Armored Vehicle Navigation Systems Industry Revenue (Million) Forecast, by Application 2020 & 2033
- Table 49: North Africa Armored Vehicle Navigation Systems Industry Revenue (Million) Forecast, by Application 2020 & 2033
- Table 50: South Africa Armored Vehicle Navigation Systems Industry Revenue (Million) Forecast, by Application 2020 & 2033
- Table 51: Rest of Middle East & Africa Armored Vehicle Navigation Systems Industry Revenue (Million) Forecast, by Application 2020 & 2033
- Table 52: Global Armored Vehicle Navigation Systems Industry Revenue Million Forecast, by Production Analysis 2020 & 2033
- Table 53: Global Armored Vehicle Navigation Systems Industry Revenue Million Forecast, by Consumption Analysis 2020 & 2033
- Table 54: Global Armored Vehicle Navigation Systems Industry Revenue Million Forecast, by Import Market Analysis (Value & Volume) 2020 & 2033
- Table 55: Global Armored Vehicle Navigation Systems Industry Revenue Million Forecast, by Export Market Analysis (Value & Volume) 2020 & 2033
- Table 56: Global Armored Vehicle Navigation Systems Industry Revenue Million Forecast, by Price Trend Analysis 2020 & 2033
- Table 57: Global Armored Vehicle Navigation Systems Industry Revenue Million Forecast, by Country 2020 & 2033
- Table 58: China Armored Vehicle Navigation Systems Industry Revenue (Million) Forecast, by Application 2020 & 2033
- Table 59: India Armored Vehicle Navigation Systems Industry Revenue (Million) Forecast, by Application 2020 & 2033
- Table 60: Japan Armored Vehicle Navigation Systems Industry Revenue (Million) Forecast, by Application 2020 & 2033
- Table 61: South Korea Armored Vehicle Navigation Systems Industry Revenue (Million) Forecast, by Application 2020 & 2033
- Table 62: ASEAN Armored Vehicle Navigation Systems Industry Revenue (Million) Forecast, by Application 2020 & 2033
- Table 63: Oceania Armored Vehicle Navigation Systems Industry Revenue (Million) Forecast, by Application 2020 & 2033
- Table 64: Rest of Asia Pacific Armored Vehicle Navigation Systems Industry Revenue (Million) Forecast, by Application 2020 & 2033
Frequently Asked Questions
1. What is the projected Compound Annual Growth Rate (CAGR) of the Armored Vehicle Navigation Systems Industry?
The projected CAGR is approximately 4.92%.
2. Which companies are prominent players in the Armored Vehicle Navigation Systems Industry?
Key companies in the market include Honeywell International Inc, THALES, Advanced Navigation, GEM elettronica, Safran SA, Israel Aerospace Industries Ltd, KVH Industries Inc, RTX Corporatio, BAE Systems plc, Northrop Grumman Corporation, Bharat Electronics Limited (BEL), Hertz Systems.
3. What are the main segments of the Armored Vehicle Navigation Systems Industry?
The market segments include Production Analysis, Consumption Analysis, Import Market Analysis (Value & Volume), Export Market Analysis (Value & Volume), Price Trend Analysis.
4. Can you provide details about the market size?
The market size is estimated to be USD 103.45 Million as of 2022.
5. What are some drivers contributing to market growth?
; Increased Seaborne Threats And Ambiguous Maritime Security Policies; Increasing Adoption Of Security Technologies In Bric Countries.
6. What are the notable trends driving market growth?
Inertial Navigation Systems to Exhibit the Highest Growth Rate.
7. Are there any restraints impacting market growth?
; High Risk Rate In Ungoverned Zones; Unstructured Security Standards And Technologies.
8. Can you provide examples of recent developments in the market?
N/A
9. What pricing options are available for accessing the report?
Pricing options include single-user, multi-user, and enterprise licenses priced at USD 4750, USD 5250, and USD 8750 respectively.
10. Is the market size provided in terms of value or volume?
The market size is provided in terms of value, measured in Million.
11. Are there any specific market keywords associated with the report?
Yes, the market keyword associated with the report is "Armored Vehicle Navigation Systems Industry," which aids in identifying and referencing the specific market segment covered.
12. How do I determine which pricing option suits my needs best?
The pricing options vary based on user requirements and access needs. Individual users may opt for single-user licenses, while businesses requiring broader access may choose multi-user or enterprise licenses for cost-effective access to the report.
13. Are there any additional resources or data provided in the Armored Vehicle Navigation Systems Industry report?
While the report offers comprehensive insights, it's advisable to review the specific contents or supplementary materials provided to ascertain if additional resources or data are available.
14. How can I stay updated on further developments or reports in the Armored Vehicle Navigation Systems Industry?
To stay informed about further developments, trends, and reports in the Armored Vehicle Navigation Systems Industry, consider subscribing to industry newsletters, following relevant companies and organizations, or regularly checking reputable industry news sources and publications.
Methodology
Step 1 - Identification of Relevant Samples Size from Population Database


Step 2 - Approaches for Defining Global Market Size (Value, Volume* & Price*)

Note*: In applicable scenarios
Step 3 - Data Sources
Primary Research
- Web Analytics
- Survey Reports
- Research Institute
- Latest Research Reports
- Opinion Leaders
Secondary Research
- Annual Reports
- White Paper
- Latest Press Release
- Industry Association
- Paid Database
- Investor Presentations

Step 4 - Data Triangulation
Involves using different sources of information in order to increase the validity of a study
These sources are likely to be stakeholders in a program - participants, other researchers, program staff, other community members, and so on.
Then we put all data in single framework & apply various statistical tools to find out the dynamic on the market.
During the analysis stage, feedback from the stakeholder groups would be compared to determine areas of agreement as well as areas of divergence