

Key Insights
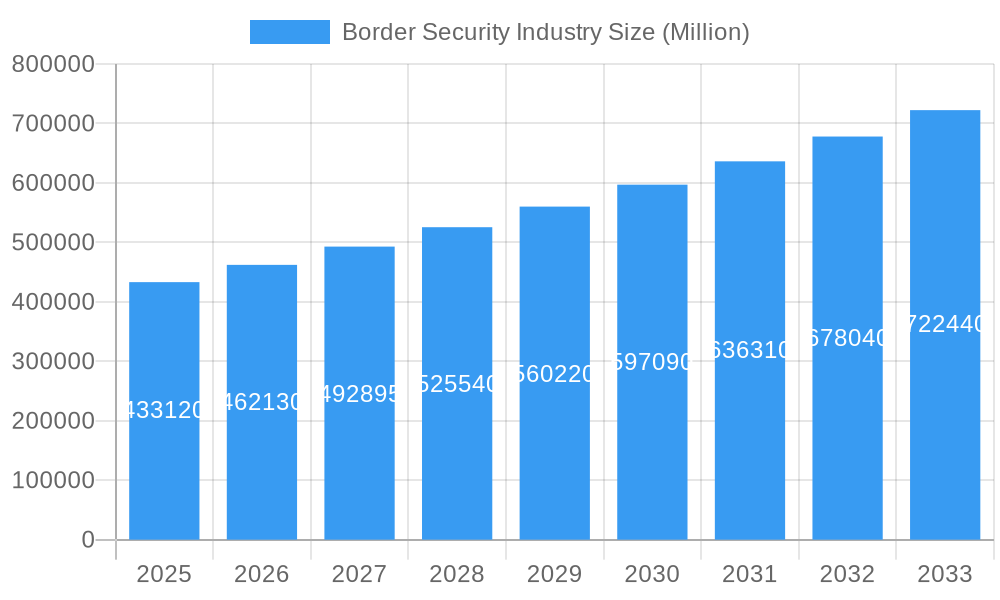
The global Border Security market is poised for significant expansion, projected to reach USD 433.12 billion in 2025 and exhibit a robust Compound Annual Growth Rate (CAGR) of 6.62% through 2033. This growth is primarily fueled by escalating geopolitical tensions, a persistent rise in illegal immigration, and the increasing threat of terrorism worldwide, compelling nations to invest heavily in advanced surveillance, detection, and control technologies. The demand for integrated border management solutions, encompassing sophisticated sensors, intelligent analytics, and secure communication systems, is at an all-time high. Furthermore, technological advancements, including the adoption of AI-powered analytics for real-time threat identification and predictive capabilities, drones for aerial surveillance, and biometric systems for enhanced identity verification, are acting as significant growth catalysts. Governments are prioritizing the modernization of their border infrastructure to create more resilient and effective security frameworks, thereby safeguarding national interests and ensuring public safety.
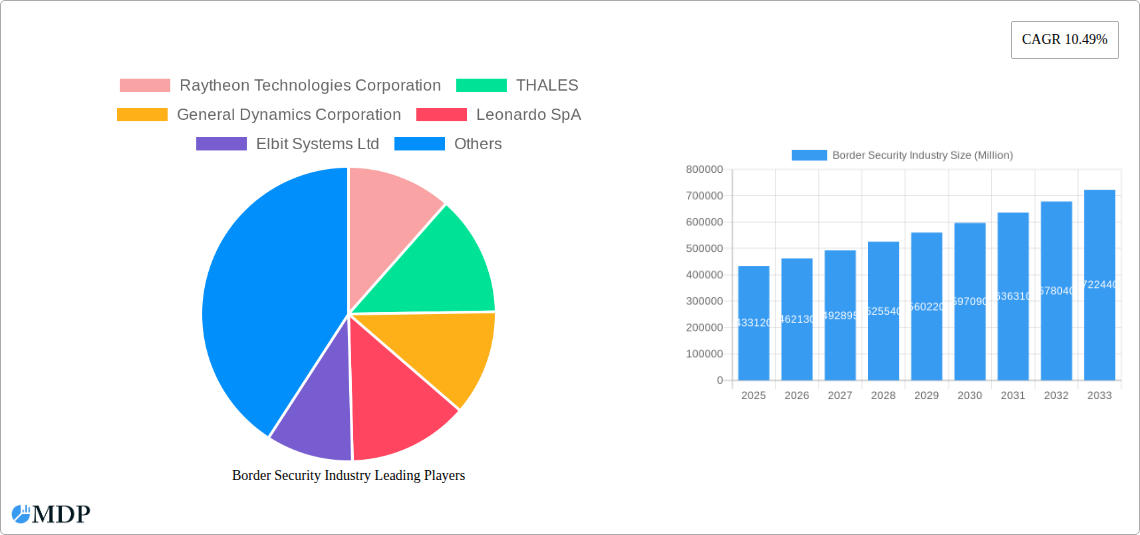
Border Security Industry Market Size (In Billion)
Key drivers shaping the market include the constant need to intercept drug trafficking, human smuggling, and the movement of illicit goods, alongside the imperative to manage refugee flows and protect critical infrastructure. Emerging trends indicate a strong shift towards networked security systems, enabling seamless information sharing and coordinated responses across different border points and agencies. The increasing adoption of IoT devices for remote monitoring and the development of unmanned ground and aerial vehicles for extended patrol capabilities are also notable. While the market shows immense promise, certain restraints such as the substantial initial investment required for advanced technologies and the complexities in cross-border data sharing regulations may pose challenges. However, the overarching commitment by governments to enhance national security and control their perimeters ensures sustained investment and innovation within the border security landscape.
Border Security Industry Company Market Share
Unlocking Global Security: The Comprehensive Border Security Industry Market Report (2019-2033)
This in-depth border security market report provides an unparalleled analysis of the global border protection industry, encompassing a study period from 2019 to 2033, with a base and estimated year of 2025, and a forecast period of 2025-2033. Delving into historical data from 2019-2024, this report offers critical insights into national security solutions, frontier surveillance technologies, and illegal immigration control systems. Examine the border control market size, threat detection systems market, and the burgeoning demand for perimeter security solutions. With a projected market value in the billions of USD, this report is essential for defense contractors, government agencies, security technology providers, and policy makers seeking to understand the dynamics of safeguarding international borders. Explore the competitive landscape featuring industry giants such as Raytheon Technologies Corporation, THALES, General Dynamics Corporation, Leonardo SpA, Elbit Systems Ltd, Airbus SE, Moog Inc, Rafael Advanced Defense Systems Ltd, IAI, BAE Systems plc, Northrop Grumman Corporation, Senstar Technologies Ltd, and The Boeing Company.
Border Security Industry Market Dynamics & Concentration
The global border security industry is characterized by a dynamic interplay of technological advancements, evolving geopolitical landscapes, and increasing national security imperatives. Market concentration is moderate, with a few major players holding significant market share, particularly in sophisticated surveillance and defense systems. However, a growing number of specialized firms are emerging, focusing on niche technologies like AI-powered threat detection and drone-based monitoring. Innovation drivers are predominantly fueled by the constant need to counter emerging threats, including sophisticated smuggling operations, cross-border terrorism, and mass migration. Regulatory frameworks play a pivotal role, often dictating the adoption of specific technologies and operational standards for border agencies worldwide. Product substitutes are limited in high-stakes security applications, but advancements in less intrusive technologies are continually being explored. End-user trends indicate a strong preference for integrated systems that offer comprehensive situational awareness, from sensors and cameras to data analytics and command-and-control platforms. Mergers and acquisitions (M&A) activities are significant, as larger corporations seek to expand their portfolios and acquire cutting-edge technologies. For instance, in the historical period, there have been numerous strategic acquisitions aimed at consolidating market position and enhancing technological capabilities. The market share of key players is estimated to be in the tens of billions, with M&A deal counts averaging several billion annually.
Border Security Industry Industry Trends & Analysis
The border security industry is experiencing robust growth, driven by escalating global security concerns and the continuous evolution of threats. This sector is projected to witness a Compound Annual Growth Rate (CAGR) of approximately 7.5% over the forecast period. Market penetration for advanced surveillance and defense technologies is rapidly increasing as nations prioritize the integrity of their borders. Key growth drivers include the rising incidence of illegal immigration, cross-border trafficking of illicit goods, and the persistent threat of terrorism, all of which necessitate enhanced border management capabilities. Technological disruptions are transforming the industry, with the integration of Artificial Intelligence (AI), machine learning, big data analytics, and advanced sensor technologies becoming paramount. Drones and unmanned aerial vehicles (UAVs) are increasingly deployed for aerial surveillance, offering cost-effective and flexible monitoring solutions. Biometric identification systems are also gaining traction, improving the accuracy and efficiency of traveler screening and suspect identification. Consumer preferences, or rather end-user demands from government agencies, are shifting towards intelligent, automated, and interconnected systems that provide real-time threat detection and rapid response capabilities. Competitive dynamics are intensifying, with companies investing heavily in research and development to stay ahead of technological curves and gain a competitive edge. The market penetration for AI-enabled threat detection systems is expected to exceed 60% by the end of the forecast period.
Leading Markets & Segments in Border Security Industry
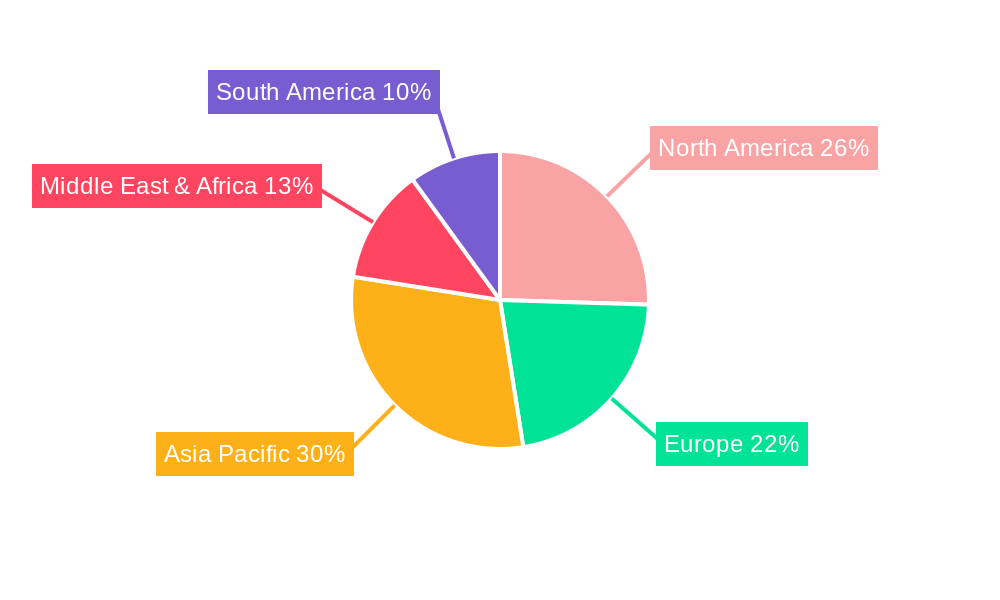
The North America region stands as a dominant force in the global border security market, primarily driven by the United States' extensive border infrastructure needs and significant investments in defense and homeland security. Within North America, the United States represents the largest single market due to its vast land and maritime borders and a proactive approach to national security.
Production Analysis:
The production of border security equipment is concentrated in regions with established defense industries, including North America, Europe, and select countries in Asia. Key drivers for production include government procurement contracts, technological innovation, and the availability of skilled labor and advanced manufacturing capabilities. The overall global production value is in the hundreds of billions.
Consumption Analysis:
Consumption of border security solutions is highest in regions facing significant security challenges, such as North America, the Middle East, and parts of Asia. Factors influencing consumption include geopolitical stability, the extent of border permeability, and the perceived threat landscape. The total global consumption value is estimated to be in the hundreds of billions.
Import Market Analysis (Value & Volume):
The import market for border security solutions is robust in countries that may lack domestic manufacturing capabilities or seek specialized technologies. Major importing regions include developing nations in Africa and South America, as well as countries in the Middle East looking to bolster their defenses. The global import value is in the tens of billions, with the volume varying significantly based on the type of equipment.
Export Market Analysis (Value & Volume):
Leading exporters of border security technologies are nations with advanced defense manufacturing sectors, such as the United States, European nations (e.g., France, Germany, the UK), and Israel. These countries export a wide range of products, from surveillance systems and patrol vehicles to advanced weaponry and IT infrastructure. The global export value is in the tens of billions, with significant volumes of sensor and communication equipment.
Price Trend Analysis:
Price trends in the border security industry are influenced by factors such as technological complexity, production volume, and competitive pressures. High-end, sophisticated systems like advanced radar and AI-powered analytics tend to command premium prices. However, increased competition and standardization in certain product categories, such as basic surveillance cameras, are leading to price stabilization or slight decreases. The overall price trend is upward due to continuous innovation and increasing demand for advanced capabilities, with an estimated average annual price increase of 3-5% for advanced systems.
Border Security Industry Product Developments
Recent product developments in the border security industry focus on enhancing real-time threat detection and autonomous operational capabilities. Innovations include AI-powered video analytics for anomaly detection, advanced sensor fusion for improved situational awareness, and the deployment of specialized drones for long-range surveillance and reconnaissance. These advancements offer significant competitive advantages by enabling faster response times, reducing human error, and providing more comprehensive data for decision-making. The market fit for these products is high, addressing the critical need for more effective and efficient border management in the face of evolving security challenges.
Key Drivers of Border Security Industry Growth
Several key drivers are propelling the growth of the border security industry. Firstly, the escalating geopolitical tensions and the rise of non-state actors necessitate more robust border control measures. Secondly, technological advancements, particularly in AI, IoT, and drone technology, are enabling more sophisticated and cost-effective surveillance and response systems. Thirdly, increasing global trade and lawful movement of people require efficient border management to facilitate legitimate activities while preventing illicit flows. Finally, government mandates and increased defense budgets worldwide are directly fueling investments in border security infrastructure and technologies, contributing to an estimated market growth of hundreds of billions.
Challenges in the Border Security Industry Market
Despite its growth, the border security industry faces several challenges. Regulatory hurdles can slow down the adoption of new technologies due to lengthy approval processes and differing international standards. Supply chain disruptions, exacerbated by global events, can impact the availability and cost of critical components. High initial investment costs for advanced systems can be a barrier for some nations, and privacy concerns associated with pervasive surveillance technologies require careful consideration. Furthermore, skilled personnel shortages for operating and maintaining complex systems pose a significant challenge, alongside the continuous evolution of threat tactics which demands ongoing adaptation of security measures.
Emerging Opportunities in Border Security Industry
Emerging opportunities in the border security industry are significant, driven by technological breakthroughs and evolving security needs. The increasing adoption of AI and machine learning for predictive analytics and threat identification presents a vast market for intelligent systems. Strategic partnerships between technology providers and government agencies are fostering the development of integrated, end-to-end solutions. Furthermore, the expansion of smart border initiatives, focusing on streamlining lawful trade and travel through technology, creates demand for seamless data integration and advanced screening technologies. The development of counter-drone systems and cybersecurity solutions tailored for border infrastructure also represents a burgeoning area of opportunity.
Leading Players in the Border Security Industry Sector
- Raytheon Technologies Corporation
- THALES
- General Dynamics Corporation
- Leonardo SpA
- Elbit Systems Ltd
- Airbus SE
- Moog Inc
- Rafael Advanced Defense Systems Ltd
- IAI
- BAE Systems plc
- Northrop Grumman Corporation
- Senstar Technologies Ltd
- The Boeing Company
Key Milestones in Border Security Industry Industry
- March 2023: Accenture Federal Services received a contract worth USD 380 million for IT infrastructure operations and modernization from US Customs and Border Protection (CBP). This contract is crucial for enhancing the operational efficiency and technological capabilities of the US border agency.
- October 2022: The Indian Army began the procurement process of 80 mini remotely piloted aircraft systems and 1,000 surveillance copters. This move significantly bolsters its overall surveillance apparatus along the Line of Actual Control (LAC) with China, highlighting the growing importance of aerial surveillance in border management.
Strategic Outlook for Border Security Industry Market
The strategic outlook for the border security industry market is overwhelmingly positive, fueled by sustained global security concerns and continuous technological innovation. Growth accelerators include the ongoing digital transformation of border management systems, the increasing demand for integrated multi-layered security solutions, and a projected rise in defense spending by governments worldwide. Strategic opportunities lie in the development and deployment of advanced AI-driven intelligence platforms, scalable and adaptable sensor networks, and comprehensive cybersecurity measures for critical border infrastructure. The market is poised for significant expansion, with a strong emphasis on collaborative efforts between nations and industry leaders to create more resilient and intelligent border security frameworks.
Border Security Industry Segmentation
- 1. Production Analysis
- 2. Consumption Analysis
- 3. Import Market Analysis (Value & Volume)
- 4. Export Market Analysis (Value & Volume)
- 5. Price Trend Analysis
Border Security Industry Segmentation By Geography
-
1. North America
- 1.1. United States
- 1.2. Canada
- 1.3. Mexico
-
2. South America
- 2.1. Brazil
- 2.2. Argentina
- 2.3. Rest of South America
-
3. Europe
- 3.1. United Kingdom
- 3.2. Germany
- 3.3. France
- 3.4. Italy
- 3.5. Spain
- 3.6. Russia
- 3.7. Benelux
- 3.8. Nordics
- 3.9. Rest of Europe
-
4. Middle East & Africa
- 4.1. Turkey
- 4.2. Israel
- 4.3. GCC
- 4.4. North Africa
- 4.5. South Africa
- 4.6. Rest of Middle East & Africa
-
5. Asia Pacific
- 5.1. China
- 5.2. India
- 5.3. Japan
- 5.4. South Korea
- 5.5. ASEAN
- 5.6. Oceania
- 5.7. Rest of Asia Pacific
Border Security Industry Regional Market Share
Geographic Coverage of Border Security Industry
Border Security Industry REPORT HIGHLIGHTS
| Aspects | Details |
|---|---|
| Study Period | 2020-2034 |
| Base Year | 2025 |
| Estimated Year | 2026 |
| Forecast Period | 2026-2034 |
| Historical Period | 2020-2025 |
| Growth Rate | CAGR of 6.62% from 2020-2034 |
| Segmentation |
|
Table of Contents
- 1. Introduction
- 1.1. Research Scope
- 1.2. Market Segmentation
- 1.3. Research Objective
- 1.4. Definitions and Assumptions
- 2. Executive Summary
- 2.1. Market Snapshot
- 3. Market Dynamics
- 3.1. Market Drivers
- 3.2. Market Restrains
- 3.3. Market Trends
- 3.4. Market Opportunities
- 4. Market Factor Analysis
- 4.1. Porters Five Forces
- 4.1.1. Bargaining Power of Suppliers
- 4.1.2. Bargaining Power of Buyers
- 4.1.3. Threat of New Entrants
- 4.1.4. Threat of Substitutes
- 4.1.5. Competitive Rivalry
- 4.2. PESTEL analysis
- 4.3. BCG Analysis
- 4.3.1. Stars (High Growth, High Market Share)
- 4.3.2. Cash Cows (Low Growth, High Market Share)
- 4.3.3. Question Mark (High Growth, Low Market Share)
- 4.3.4. Dogs (Low Growth, Low Market Share)
- 4.4. Ansoff Matrix Analysis
- 4.5. Supply Chain Analysis
- 4.6. Regulatory Landscape
- 4.7. Current Market Potential and Opportunity Assessment (TAM–SAM–SOM Framework)
- 4.8. MDP Analyst Note
- 4.1. Porters Five Forces
- 5. Market Analysis, Insights and Forecast 2021-2033
- 5.1. Market Analysis, Insights and Forecast - by Production Analysis
- 5.2. Market Analysis, Insights and Forecast - by Consumption Analysis
- 5.3. Market Analysis, Insights and Forecast - by Import Market Analysis (Value & Volume)
- 5.4. Market Analysis, Insights and Forecast - by Export Market Analysis (Value & Volume)
- 5.5. Market Analysis, Insights and Forecast - by Price Trend Analysis
- 5.6. Market Analysis, Insights and Forecast - by Region
- 5.6.1. North America
- 5.6.2. South America
- 5.6.3. Europe
- 5.6.4. Middle East & Africa
- 5.6.5. Asia Pacific
- 6. Global Border Security Industry Analysis, Insights and Forecast, 2021-2033
- 6.1. Market Analysis, Insights and Forecast - by Production Analysis
- 6.2. Market Analysis, Insights and Forecast - by Consumption Analysis
- 6.3. Market Analysis, Insights and Forecast - by Import Market Analysis (Value & Volume)
- 6.4. Market Analysis, Insights and Forecast - by Export Market Analysis (Value & Volume)
- 6.5. Market Analysis, Insights and Forecast - by Price Trend Analysis
- 7. North America Border Security Industry Analysis, Insights and Forecast, 2020-2032
- 7.1. Market Analysis, Insights and Forecast - by Production Analysis
- 7.2. Market Analysis, Insights and Forecast - by Consumption Analysis
- 7.3. Market Analysis, Insights and Forecast - by Import Market Analysis (Value & Volume)
- 7.4. Market Analysis, Insights and Forecast - by Export Market Analysis (Value & Volume)
- 7.5. Market Analysis, Insights and Forecast - by Price Trend Analysis
- 8. South America Border Security Industry Analysis, Insights and Forecast, 2020-2032
- 8.1. Market Analysis, Insights and Forecast - by Production Analysis
- 8.2. Market Analysis, Insights and Forecast - by Consumption Analysis
- 8.3. Market Analysis, Insights and Forecast - by Import Market Analysis (Value & Volume)
- 8.4. Market Analysis, Insights and Forecast - by Export Market Analysis (Value & Volume)
- 8.5. Market Analysis, Insights and Forecast - by Price Trend Analysis
- 9. Europe Border Security Industry Analysis, Insights and Forecast, 2020-2032
- 9.1. Market Analysis, Insights and Forecast - by Production Analysis
- 9.2. Market Analysis, Insights and Forecast - by Consumption Analysis
- 9.3. Market Analysis, Insights and Forecast - by Import Market Analysis (Value & Volume)
- 9.4. Market Analysis, Insights and Forecast - by Export Market Analysis (Value & Volume)
- 9.5. Market Analysis, Insights and Forecast - by Price Trend Analysis
- 10. Middle East & Africa Border Security Industry Analysis, Insights and Forecast, 2020-2032
- 10.1. Market Analysis, Insights and Forecast - by Production Analysis
- 10.2. Market Analysis, Insights and Forecast - by Consumption Analysis
- 10.3. Market Analysis, Insights and Forecast - by Import Market Analysis (Value & Volume)
- 10.4. Market Analysis, Insights and Forecast - by Export Market Analysis (Value & Volume)
- 10.5. Market Analysis, Insights and Forecast - by Price Trend Analysis
- 11. Asia Pacific Border Security Industry Analysis, Insights and Forecast, 2020-2032
- 11.1. Market Analysis, Insights and Forecast - by Production Analysis
- 11.2. Market Analysis, Insights and Forecast - by Consumption Analysis
- 11.3. Market Analysis, Insights and Forecast - by Import Market Analysis (Value & Volume)
- 11.4. Market Analysis, Insights and Forecast - by Export Market Analysis (Value & Volume)
- 11.5. Market Analysis, Insights and Forecast - by Price Trend Analysis
- 12. Competitive Analysis
- 12.1. Company Profiles
- 12.1.1 Raytheon Technologies Corporation
- 12.1.1.1. Company Overview
- 12.1.1.2. Products
- 12.1.1.3. Company Financials
- 12.1.1.4. SWOT Analysis
- 12.1.2 THALES
- 12.1.2.1. Company Overview
- 12.1.2.2. Products
- 12.1.2.3. Company Financials
- 12.1.2.4. SWOT Analysis
- 12.1.3 General Dynamics Corporation
- 12.1.3.1. Company Overview
- 12.1.3.2. Products
- 12.1.3.3. Company Financials
- 12.1.3.4. SWOT Analysis
- 12.1.4 Leonardo SpA
- 12.1.4.1. Company Overview
- 12.1.4.2. Products
- 12.1.4.3. Company Financials
- 12.1.4.4. SWOT Analysis
- 12.1.5 Elbit Systems Ltd
- 12.1.5.1. Company Overview
- 12.1.5.2. Products
- 12.1.5.3. Company Financials
- 12.1.5.4. SWOT Analysis
- 12.1.6 Airbus SE
- 12.1.6.1. Company Overview
- 12.1.6.2. Products
- 12.1.6.3. Company Financials
- 12.1.6.4. SWOT Analysis
- 12.1.7 Moog Inc
- 12.1.7.1. Company Overview
- 12.1.7.2. Products
- 12.1.7.3. Company Financials
- 12.1.7.4. SWOT Analysis
- 12.1.8 Rafael Advanced Defense Systems Ltd
- 12.1.8.1. Company Overview
- 12.1.8.2. Products
- 12.1.8.3. Company Financials
- 12.1.8.4. SWOT Analysis
- 12.1.9 IAI
- 12.1.9.1. Company Overview
- 12.1.9.2. Products
- 12.1.9.3. Company Financials
- 12.1.9.4. SWOT Analysis
- 12.1.10 BAE Systems plc
- 12.1.10.1. Company Overview
- 12.1.10.2. Products
- 12.1.10.3. Company Financials
- 12.1.10.4. SWOT Analysis
- 12.1.11 Northrop Grumman Corporation
- 12.1.11.1. Company Overview
- 12.1.11.2. Products
- 12.1.11.3. Company Financials
- 12.1.11.4. SWOT Analysis
- 12.1.12 Senstar Technologies Ltd
- 12.1.12.1. Company Overview
- 12.1.12.2. Products
- 12.1.12.3. Company Financials
- 12.1.12.4. SWOT Analysis
- 12.1.13 The Boeing Company
- 12.1.13.1. Company Overview
- 12.1.13.2. Products
- 12.1.13.3. Company Financials
- 12.1.13.4. SWOT Analysis
- 12.1.1 Raytheon Technologies Corporation
- 12.2. Market Entropy
- 12.2.1 Company's Key Areas Served
- 12.2.2 Recent Developments
- 12.3. Company Market Share Analysis 2025
- 12.3.1 Top 5 Companies Market Share Analysis
- 12.3.2 Top 3 Companies Market Share Analysis
- 12.4. List of Potential Customers
- 13. Research Methodology
List of Figures
- Figure 1: Global Border Security Industry Revenue Breakdown (undefined, %) by Region 2025 & 2033
- Figure 2: North America Border Security Industry Revenue (undefined), by Production Analysis 2025 & 2033
- Figure 3: North America Border Security Industry Revenue Share (%), by Production Analysis 2025 & 2033
- Figure 4: North America Border Security Industry Revenue (undefined), by Consumption Analysis 2025 & 2033
- Figure 5: North America Border Security Industry Revenue Share (%), by Consumption Analysis 2025 & 2033
- Figure 6: North America Border Security Industry Revenue (undefined), by Import Market Analysis (Value & Volume) 2025 & 2033
- Figure 7: North America Border Security Industry Revenue Share (%), by Import Market Analysis (Value & Volume) 2025 & 2033
- Figure 8: North America Border Security Industry Revenue (undefined), by Export Market Analysis (Value & Volume) 2025 & 2033
- Figure 9: North America Border Security Industry Revenue Share (%), by Export Market Analysis (Value & Volume) 2025 & 2033
- Figure 10: North America Border Security Industry Revenue (undefined), by Price Trend Analysis 2025 & 2033
- Figure 11: North America Border Security Industry Revenue Share (%), by Price Trend Analysis 2025 & 2033
- Figure 12: North America Border Security Industry Revenue (undefined), by Country 2025 & 2033
- Figure 13: North America Border Security Industry Revenue Share (%), by Country 2025 & 2033
- Figure 14: South America Border Security Industry Revenue (undefined), by Production Analysis 2025 & 2033
- Figure 15: South America Border Security Industry Revenue Share (%), by Production Analysis 2025 & 2033
- Figure 16: South America Border Security Industry Revenue (undefined), by Consumption Analysis 2025 & 2033
- Figure 17: South America Border Security Industry Revenue Share (%), by Consumption Analysis 2025 & 2033
- Figure 18: South America Border Security Industry Revenue (undefined), by Import Market Analysis (Value & Volume) 2025 & 2033
- Figure 19: South America Border Security Industry Revenue Share (%), by Import Market Analysis (Value & Volume) 2025 & 2033
- Figure 20: South America Border Security Industry Revenue (undefined), by Export Market Analysis (Value & Volume) 2025 & 2033
- Figure 21: South America Border Security Industry Revenue Share (%), by Export Market Analysis (Value & Volume) 2025 & 2033
- Figure 22: South America Border Security Industry Revenue (undefined), by Price Trend Analysis 2025 & 2033
- Figure 23: South America Border Security Industry Revenue Share (%), by Price Trend Analysis 2025 & 2033
- Figure 24: South America Border Security Industry Revenue (undefined), by Country 2025 & 2033
- Figure 25: South America Border Security Industry Revenue Share (%), by Country 2025 & 2033
- Figure 26: Europe Border Security Industry Revenue (undefined), by Production Analysis 2025 & 2033
- Figure 27: Europe Border Security Industry Revenue Share (%), by Production Analysis 2025 & 2033
- Figure 28: Europe Border Security Industry Revenue (undefined), by Consumption Analysis 2025 & 2033
- Figure 29: Europe Border Security Industry Revenue Share (%), by Consumption Analysis 2025 & 2033
- Figure 30: Europe Border Security Industry Revenue (undefined), by Import Market Analysis (Value & Volume) 2025 & 2033
- Figure 31: Europe Border Security Industry Revenue Share (%), by Import Market Analysis (Value & Volume) 2025 & 2033
- Figure 32: Europe Border Security Industry Revenue (undefined), by Export Market Analysis (Value & Volume) 2025 & 2033
- Figure 33: Europe Border Security Industry Revenue Share (%), by Export Market Analysis (Value & Volume) 2025 & 2033
- Figure 34: Europe Border Security Industry Revenue (undefined), by Price Trend Analysis 2025 & 2033
- Figure 35: Europe Border Security Industry Revenue Share (%), by Price Trend Analysis 2025 & 2033
- Figure 36: Europe Border Security Industry Revenue (undefined), by Country 2025 & 2033
- Figure 37: Europe Border Security Industry Revenue Share (%), by Country 2025 & 2033
- Figure 38: Middle East & Africa Border Security Industry Revenue (undefined), by Production Analysis 2025 & 2033
- Figure 39: Middle East & Africa Border Security Industry Revenue Share (%), by Production Analysis 2025 & 2033
- Figure 40: Middle East & Africa Border Security Industry Revenue (undefined), by Consumption Analysis 2025 & 2033
- Figure 41: Middle East & Africa Border Security Industry Revenue Share (%), by Consumption Analysis 2025 & 2033
- Figure 42: Middle East & Africa Border Security Industry Revenue (undefined), by Import Market Analysis (Value & Volume) 2025 & 2033
- Figure 43: Middle East & Africa Border Security Industry Revenue Share (%), by Import Market Analysis (Value & Volume) 2025 & 2033
- Figure 44: Middle East & Africa Border Security Industry Revenue (undefined), by Export Market Analysis (Value & Volume) 2025 & 2033
- Figure 45: Middle East & Africa Border Security Industry Revenue Share (%), by Export Market Analysis (Value & Volume) 2025 & 2033
- Figure 46: Middle East & Africa Border Security Industry Revenue (undefined), by Price Trend Analysis 2025 & 2033
- Figure 47: Middle East & Africa Border Security Industry Revenue Share (%), by Price Trend Analysis 2025 & 2033
- Figure 48: Middle East & Africa Border Security Industry Revenue (undefined), by Country 2025 & 2033
- Figure 49: Middle East & Africa Border Security Industry Revenue Share (%), by Country 2025 & 2033
- Figure 50: Asia Pacific Border Security Industry Revenue (undefined), by Production Analysis 2025 & 2033
- Figure 51: Asia Pacific Border Security Industry Revenue Share (%), by Production Analysis 2025 & 2033
- Figure 52: Asia Pacific Border Security Industry Revenue (undefined), by Consumption Analysis 2025 & 2033
- Figure 53: Asia Pacific Border Security Industry Revenue Share (%), by Consumption Analysis 2025 & 2033
- Figure 54: Asia Pacific Border Security Industry Revenue (undefined), by Import Market Analysis (Value & Volume) 2025 & 2033
- Figure 55: Asia Pacific Border Security Industry Revenue Share (%), by Import Market Analysis (Value & Volume) 2025 & 2033
- Figure 56: Asia Pacific Border Security Industry Revenue (undefined), by Export Market Analysis (Value & Volume) 2025 & 2033
- Figure 57: Asia Pacific Border Security Industry Revenue Share (%), by Export Market Analysis (Value & Volume) 2025 & 2033
- Figure 58: Asia Pacific Border Security Industry Revenue (undefined), by Price Trend Analysis 2025 & 2033
- Figure 59: Asia Pacific Border Security Industry Revenue Share (%), by Price Trend Analysis 2025 & 2033
- Figure 60: Asia Pacific Border Security Industry Revenue (undefined), by Country 2025 & 2033
- Figure 61: Asia Pacific Border Security Industry Revenue Share (%), by Country 2025 & 2033
List of Tables
- Table 1: Global Border Security Industry Revenue undefined Forecast, by Production Analysis 2020 & 2033
- Table 2: Global Border Security Industry Revenue undefined Forecast, by Consumption Analysis 2020 & 2033
- Table 3: Global Border Security Industry Revenue undefined Forecast, by Import Market Analysis (Value & Volume) 2020 & 2033
- Table 4: Global Border Security Industry Revenue undefined Forecast, by Export Market Analysis (Value & Volume) 2020 & 2033
- Table 5: Global Border Security Industry Revenue undefined Forecast, by Price Trend Analysis 2020 & 2033
- Table 6: Global Border Security Industry Revenue undefined Forecast, by Region 2020 & 2033
- Table 7: Global Border Security Industry Revenue undefined Forecast, by Production Analysis 2020 & 2033
- Table 8: Global Border Security Industry Revenue undefined Forecast, by Consumption Analysis 2020 & 2033
- Table 9: Global Border Security Industry Revenue undefined Forecast, by Import Market Analysis (Value & Volume) 2020 & 2033
- Table 10: Global Border Security Industry Revenue undefined Forecast, by Export Market Analysis (Value & Volume) 2020 & 2033
- Table 11: Global Border Security Industry Revenue undefined Forecast, by Price Trend Analysis 2020 & 2033
- Table 12: Global Border Security Industry Revenue undefined Forecast, by Country 2020 & 2033
- Table 13: United States Border Security Industry Revenue (undefined) Forecast, by Application 2020 & 2033
- Table 14: Canada Border Security Industry Revenue (undefined) Forecast, by Application 2020 & 2033
- Table 15: Mexico Border Security Industry Revenue (undefined) Forecast, by Application 2020 & 2033
- Table 16: Global Border Security Industry Revenue undefined Forecast, by Production Analysis 2020 & 2033
- Table 17: Global Border Security Industry Revenue undefined Forecast, by Consumption Analysis 2020 & 2033
- Table 18: Global Border Security Industry Revenue undefined Forecast, by Import Market Analysis (Value & Volume) 2020 & 2033
- Table 19: Global Border Security Industry Revenue undefined Forecast, by Export Market Analysis (Value & Volume) 2020 & 2033
- Table 20: Global Border Security Industry Revenue undefined Forecast, by Price Trend Analysis 2020 & 2033
- Table 21: Global Border Security Industry Revenue undefined Forecast, by Country 2020 & 2033
- Table 22: Brazil Border Security Industry Revenue (undefined) Forecast, by Application 2020 & 2033
- Table 23: Argentina Border Security Industry Revenue (undefined) Forecast, by Application 2020 & 2033
- Table 24: Rest of South America Border Security Industry Revenue (undefined) Forecast, by Application 2020 & 2033
- Table 25: Global Border Security Industry Revenue undefined Forecast, by Production Analysis 2020 & 2033
- Table 26: Global Border Security Industry Revenue undefined Forecast, by Consumption Analysis 2020 & 2033
- Table 27: Global Border Security Industry Revenue undefined Forecast, by Import Market Analysis (Value & Volume) 2020 & 2033
- Table 28: Global Border Security Industry Revenue undefined Forecast, by Export Market Analysis (Value & Volume) 2020 & 2033
- Table 29: Global Border Security Industry Revenue undefined Forecast, by Price Trend Analysis 2020 & 2033
- Table 30: Global Border Security Industry Revenue undefined Forecast, by Country 2020 & 2033
- Table 31: United Kingdom Border Security Industry Revenue (undefined) Forecast, by Application 2020 & 2033
- Table 32: Germany Border Security Industry Revenue (undefined) Forecast, by Application 2020 & 2033
- Table 33: France Border Security Industry Revenue (undefined) Forecast, by Application 2020 & 2033
- Table 34: Italy Border Security Industry Revenue (undefined) Forecast, by Application 2020 & 2033
- Table 35: Spain Border Security Industry Revenue (undefined) Forecast, by Application 2020 & 2033
- Table 36: Russia Border Security Industry Revenue (undefined) Forecast, by Application 2020 & 2033
- Table 37: Benelux Border Security Industry Revenue (undefined) Forecast, by Application 2020 & 2033
- Table 38: Nordics Border Security Industry Revenue (undefined) Forecast, by Application 2020 & 2033
- Table 39: Rest of Europe Border Security Industry Revenue (undefined) Forecast, by Application 2020 & 2033
- Table 40: Global Border Security Industry Revenue undefined Forecast, by Production Analysis 2020 & 2033
- Table 41: Global Border Security Industry Revenue undefined Forecast, by Consumption Analysis 2020 & 2033
- Table 42: Global Border Security Industry Revenue undefined Forecast, by Import Market Analysis (Value & Volume) 2020 & 2033
- Table 43: Global Border Security Industry Revenue undefined Forecast, by Export Market Analysis (Value & Volume) 2020 & 2033
- Table 44: Global Border Security Industry Revenue undefined Forecast, by Price Trend Analysis 2020 & 2033
- Table 45: Global Border Security Industry Revenue undefined Forecast, by Country 2020 & 2033
- Table 46: Turkey Border Security Industry Revenue (undefined) Forecast, by Application 2020 & 2033
- Table 47: Israel Border Security Industry Revenue (undefined) Forecast, by Application 2020 & 2033
- Table 48: GCC Border Security Industry Revenue (undefined) Forecast, by Application 2020 & 2033
- Table 49: North Africa Border Security Industry Revenue (undefined) Forecast, by Application 2020 & 2033
- Table 50: South Africa Border Security Industry Revenue (undefined) Forecast, by Application 2020 & 2033
- Table 51: Rest of Middle East & Africa Border Security Industry Revenue (undefined) Forecast, by Application 2020 & 2033
- Table 52: Global Border Security Industry Revenue undefined Forecast, by Production Analysis 2020 & 2033
- Table 53: Global Border Security Industry Revenue undefined Forecast, by Consumption Analysis 2020 & 2033
- Table 54: Global Border Security Industry Revenue undefined Forecast, by Import Market Analysis (Value & Volume) 2020 & 2033
- Table 55: Global Border Security Industry Revenue undefined Forecast, by Export Market Analysis (Value & Volume) 2020 & 2033
- Table 56: Global Border Security Industry Revenue undefined Forecast, by Price Trend Analysis 2020 & 2033
- Table 57: Global Border Security Industry Revenue undefined Forecast, by Country 2020 & 2033
- Table 58: China Border Security Industry Revenue (undefined) Forecast, by Application 2020 & 2033
- Table 59: India Border Security Industry Revenue (undefined) Forecast, by Application 2020 & 2033
- Table 60: Japan Border Security Industry Revenue (undefined) Forecast, by Application 2020 & 2033
- Table 61: South Korea Border Security Industry Revenue (undefined) Forecast, by Application 2020 & 2033
- Table 62: ASEAN Border Security Industry Revenue (undefined) Forecast, by Application 2020 & 2033
- Table 63: Oceania Border Security Industry Revenue (undefined) Forecast, by Application 2020 & 2033
- Table 64: Rest of Asia Pacific Border Security Industry Revenue (undefined) Forecast, by Application 2020 & 2033
Frequently Asked Questions
1. What is the projected Compound Annual Growth Rate (CAGR) of the Border Security Industry?
The projected CAGR is approximately 6.62%.
2. Which companies are prominent players in the Border Security Industry?
Key companies in the market include Raytheon Technologies Corporation, THALES, General Dynamics Corporation, Leonardo SpA, Elbit Systems Ltd, Airbus SE, Moog Inc, Rafael Advanced Defense Systems Ltd, IAI, BAE Systems plc, Northrop Grumman Corporation, Senstar Technologies Ltd, The Boeing Company.
3. What are the main segments of the Border Security Industry?
The market segments include Production Analysis, Consumption Analysis, Import Market Analysis (Value & Volume), Export Market Analysis (Value & Volume), Price Trend Analysis.
4. Can you provide details about the market size?
The market size is estimated to be USD XXX N/A as of 2022.
5. What are some drivers contributing to market growth?
; Increasing Number Of Air Passengers; Use Of Portable Electronic Devices.
6. What are the notable trends driving market growth?
The Sea segment to Experience Major Growth.
7. Are there any restraints impacting market growth?
; High Cost Of Connectivity Equipments.
8. Can you provide examples of recent developments in the market?
In March 2023, Accenture Federal Services received a contract worth USD 380 million for IT infrastructure operations and modernization from US Customs and Border Protection (CBP). Under the contract, the company will deliver comprehensive technology support across multiple programs within the agency responsible for safeguarding the country's borders and facilitating lawful international travel and trade.
9. What pricing options are available for accessing the report?
Pricing options include single-user, multi-user, and enterprise licenses priced at USD 4750, USD 5250, and USD 8750 respectively.
10. Is the market size provided in terms of value or volume?
The market size is provided in terms of value, measured in N/A.
11. Are there any specific market keywords associated with the report?
Yes, the market keyword associated with the report is "Border Security Industry," which aids in identifying and referencing the specific market segment covered.
12. How do I determine which pricing option suits my needs best?
The pricing options vary based on user requirements and access needs. Individual users may opt for single-user licenses, while businesses requiring broader access may choose multi-user or enterprise licenses for cost-effective access to the report.
13. Are there any additional resources or data provided in the Border Security Industry report?
While the report offers comprehensive insights, it's advisable to review the specific contents or supplementary materials provided to ascertain if additional resources or data are available.
14. How can I stay updated on further developments or reports in the Border Security Industry?
To stay informed about further developments, trends, and reports in the Border Security Industry, consider subscribing to industry newsletters, following relevant companies and organizations, or regularly checking reputable industry news sources and publications.
Methodology
Step 1 - Identification of Relevant Samples Size from Population Database


Step 2 - Approaches for Defining Global Market Size (Value, Volume* & Price*)

Note*: In applicable scenarios
Step 3 - Data Sources
Primary Research
- Web Analytics
- Survey Reports
- Research Institute
- Latest Research Reports
- Opinion Leaders
Secondary Research
- Annual Reports
- White Paper
- Latest Press Release
- Industry Association
- Paid Database
- Investor Presentations

Step 4 - Data Triangulation
Involves using different sources of information in order to increase the validity of a study
These sources are likely to be stakeholders in a program - participants, other researchers, program staff, other community members, and so on.
Then we put all data in single framework & apply various statistical tools to find out the dynamic on the market.
During the analysis stage, feedback from the stakeholder groups would be compared to determine areas of agreement as well as areas of divergence