

Key Insights
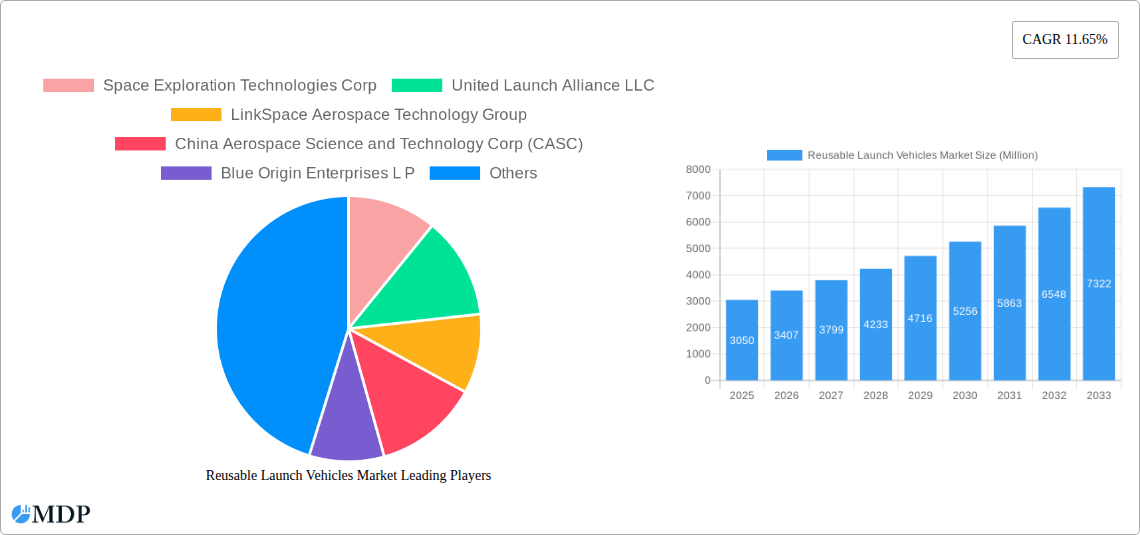
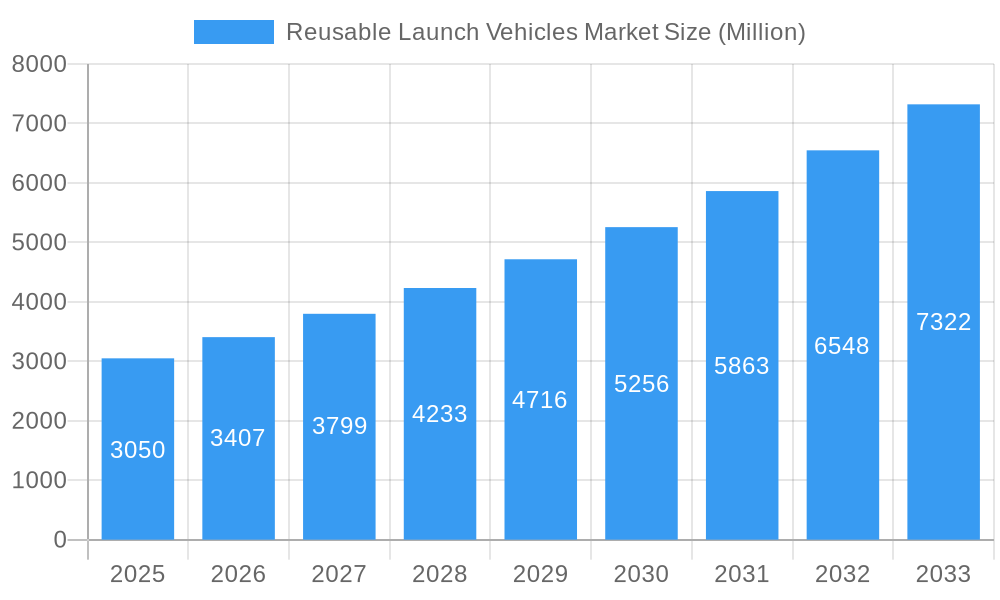
The Reusable Launch Vehicles (RLV) market is experiencing robust growth, projected to reach $3.05 billion in 2025 and maintain a Compound Annual Growth Rate (CAGR) of 11.65% from 2025 to 2033. This expansion is driven by several key factors. Firstly, the increasing demand for space-based services, including satellite constellations for communication, earth observation, and navigation, necessitates more cost-effective and frequent launch capabilities. RLVs offer a significant cost advantage over single-use rockets by reducing the manufacturing and disposal costs associated with each launch. Secondly, advancements in reusable rocket technology, particularly in areas like engine reusability and improved landing systems, are enhancing reliability and reducing launch preparation times. This increased efficiency translates to greater operational flexibility and lower overall mission costs, attracting both government space agencies and private sector companies. Finally, the growing participation of private space companies, like SpaceX and Blue Origin, is fostering innovation and competition, further accelerating market growth. These companies are actively developing and deploying RLV technologies, pushing the boundaries of what's possible and creating a more dynamic and accessible space launch environment.
Reusable Launch Vehicles Market Market Size (In Billion)
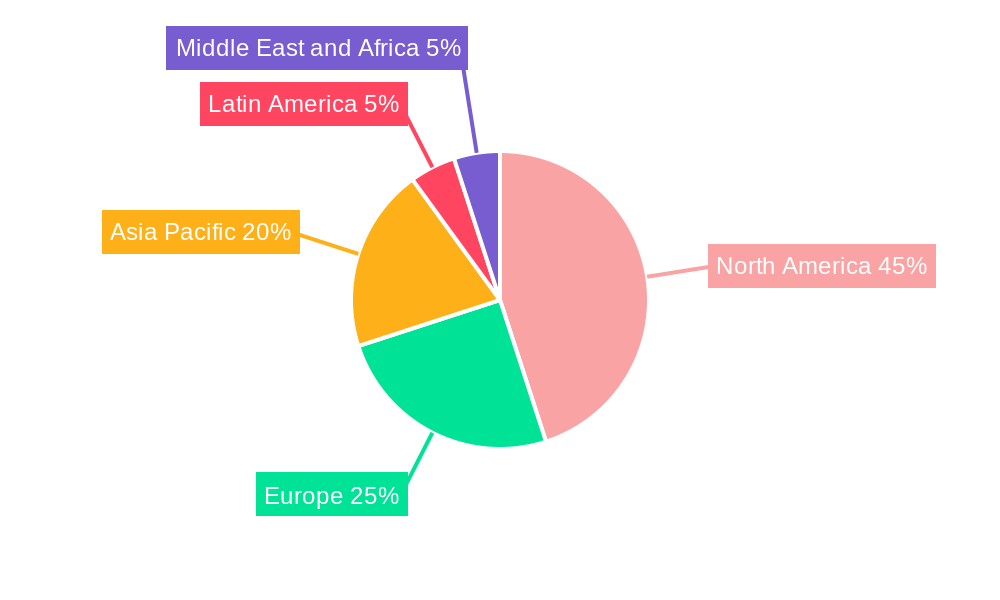
The market segmentation reveals a strong preference for partially reusable launch vehicles, likely reflecting the current technological maturity and cost-effectiveness. However, the multi-stage configuration is anticipated to gain traction in the future as technological advancements allow for greater reusability across multiple stages. Regionally, North America currently holds a significant market share due to the presence of major players like SpaceX and United Launch Alliance. However, the Asia-Pacific region is expected to witness considerable growth fueled by increasing investments in space exploration and the emergence of strong domestic players such as CASC and ISRO. Competitive dynamics are intense, with established aerospace giants alongside ambitious newcomers driving continuous improvements in technology and cost reduction. This competitive landscape will further stimulate innovation and fuel the overall expansion of the RLV market throughout the forecast period.
Reusable Launch Vehicles Market Company Market Share
Reusable Launch Vehicles Market: A Comprehensive Report (2019-2033)
This comprehensive report provides a detailed analysis of the Reusable Launch Vehicles market, offering invaluable insights for stakeholders seeking to navigate this dynamic and rapidly evolving sector. The study covers the period 2019-2033, with a focus on the forecast period 2025-2033, using 2025 as the base year and incorporating data from the historical period (2019-2024). The market is segmented by type (Partially Reusable, Fully Reusable) and configuration (Single-Stage, Multi-Stage), analyzing key players such as SpaceX, United Launch Alliance, and Blue Origin. This report is essential for strategic decision-making and investment planning within the aerospace and defense industries. Download now to gain a competitive edge!
Reusable Launch Vehicles Market Market Dynamics & Concentration
The Reusable Launch Vehicles market is characterized by a dynamic interplay of factors influencing its concentration and growth trajectory. The market is currently dominated by a few key players, with SpaceX holding a significant market share, estimated at xx% in 2025. Other major players, including United Launch Alliance LLC, Blue Origin Enterprises L P, and China Aerospace Science and Technology Corp (CASC), contribute significantly but collectively represent a smaller share than SpaceX. This high concentration is partly due to the substantial capital investment required for research, development, and testing of reusable launch vehicles. However, the market is experiencing increasing competition from emerging players like LinkSpace Aerospace Technology Group, driven by technological advancements and growing demand for space-based services.
Innovation is a key driver, with continuous advancements in propulsion systems, materials science, and autonomous flight control enhancing the efficiency and reliability of reusable launch vehicles. Stringent regulatory frameworks, varying across different space agencies (e.g., FAA, ESA), influence market dynamics, alongside the emergence of product substitutes, such as advanced expendable launch systems. End-user trends are shifting towards more frequent and cost-effective access to space, fueling demand for reusable launch vehicles. Mergers and acquisitions (M&A) activities have been relatively modest in recent years (estimated at xx deals in the period 2019-2024). However, an increase is predicted as the market matures and consolidation accelerates. The predicted CAGR for M&A activity during the forecast period (2025-2033) is xx%.
Reusable Launch Vehicles Market Industry Trends & Analysis
The Reusable Launch Vehicles market is experiencing significant growth, driven by a confluence of factors. Technological advancements in reusable rocket technology, including improved engine designs and advanced materials, are enabling greater efficiency and cost reductions. The increasing demand for satellite launches, both for commercial and governmental purposes, is a key market driver. Furthermore, the growing interest in space tourism and exploration is further expanding the market's scope and potential. The overall market exhibits a positive growth trajectory, with a projected Compound Annual Growth Rate (CAGR) of xx% from 2025 to 2033. This signifies a substantial expansion in market value, from an estimated xx Million in 2025 to xx Million by 2033. Market penetration is steadily increasing, as reusable launch vehicles become a more economically viable option compared to traditional expendable rockets. This trend is fuelled by the decreasing cost per launch enabled by reusability and technological innovations. Competitive dynamics are intensifying, with established players facing pressure from new entrants seeking to disrupt the market through innovative technologies and business models.
Leading Markets & Segments in Reusable Launch Vehicles Market
The North American market currently holds a dominant position in the Reusable Launch Vehicles market, largely driven by the significant presence of companies like SpaceX and Blue Origin. However, the Asia-Pacific region is expected to witness rapid growth, propelled by government initiatives and investments in space exploration programs in China and India. The following factors contribute to market dominance:
- North America: Strong government support (e.g., NASA funding), robust private sector investment, advanced technological capabilities.
- Asia-Pacific: Government-led space programs (e.g., China's CASC, India's ISRO), growing domestic demand for satellite launches, rising private investment.
In terms of segment dominance:
- Type: Fully reusable launch vehicles are projected to gain greater market share in the long term due to their potential for significant cost savings and operational efficiency improvements, though partially reusable systems are expected to remain relevant for specific applications.
- Configuration: Multi-stage configurations currently dominate the market due to their established technological maturity and performance capabilities. Single-stage-to-orbit (SSTO) designs are still under development, but could potentially disrupt the market with further advancements in technology and efficiency.
Reusable Launch Vehicles Market Product Developments
Recent product developments focus on improving the reusability rate, reducing turnaround time between launches, and enhancing payload capacity. Innovations in materials science are leading to lighter and more durable launch vehicles. Advanced propulsion systems, including reusable engines and more efficient propellant combinations, are significantly reducing operational costs and expanding mission capabilities. These advancements translate into a competitive advantage for companies by offering lower launch costs, faster turnaround times, and greater operational flexibility, all while meeting evolving market demand for reliable and cost-effective space access.
Key Drivers of Reusable Launch Vehicles Market Growth
The Reusable Launch Vehicles market is driven by several key factors:
- Technological Advancements: Improvements in engine design, materials science, and flight control systems are leading to more reliable and cost-effective reusable rockets.
- Economic Factors: The reduced cost per launch associated with reusability is a major incentive for both governmental and commercial entities.
- Regulatory Support: Government initiatives and funding for space exploration and commercial space activities provide crucial support and stimulus for market growth. Examples include NASA's Commercial Crew Program and various national space agencies' investment in research and development.
Challenges in the Reusable Launch Vehicles Market Market
Several challenges hinder the widespread adoption of reusable launch vehicles:
- High Initial Investment Costs: The development and production of reusable rockets necessitate substantial upfront investments, posing a barrier to entry for many companies.
- Regulatory Hurdles: The complex regulatory landscape and licensing procedures for space launches add to operational challenges and expenses.
- Supply Chain Complexities: The intricate and specialized supply chain required for these vehicles introduces vulnerabilities and potential delays.
- Competition: The intensifying competition among established and emerging players in the market could hinder profitability for some companies. The estimated impact of these challenges on market growth in 2025 is a reduction of xx%
Emerging Opportunities in Reusable Launch Vehicles Market
The long-term growth of the Reusable Launch Vehicles market is poised to be driven by several emerging opportunities:
- Technological Breakthroughs: Advancements in areas like hypersonic flight and novel propulsion systems are expected to unlock further cost reductions and performance improvements, leading to wider market adoption.
- Strategic Partnerships: Collaboration between private companies, government agencies, and research institutions can foster innovation and expedite technological progress.
- Market Expansion: The growing demand for satellite constellations and the rise of space tourism will fuel increased demand for reliable and cost-effective launch services.
Leading Players in the Reusable Launch Vehicles Market Sector
- Space Exploration Technologies Corp
- United Launch Alliance LLC
- LinkSpace Aerospace Technology Group
- China Aerospace Science and Technology Corp (CASC)
- Blue Origin Enterprises L P
- ArianeGroup
- Deutsches Zentrum für Luft- und Raumfahrt e V (DLR)
- Indian Space Research Organisation (ISRO)
- National Aeronautics and Space Administration (NASA)
Key Milestones in Reusable Launch Vehicles Market Industry
- 2015: SpaceX successfully lands the Falcon 9 first stage, marking a significant milestone in reusable rocket technology.
- 2019: Blue Origin performs multiple successful launches and landings of its New Shepard suborbital vehicle.
- 2022: Several successful commercial launches and landings of reusable rockets by multiple companies demonstrates increasing market maturity. (Specific dates need further research)
Strategic Outlook for Reusable Launch Vehicles Market Market
The future of the Reusable Launch Vehicles market appears bright, with significant potential for growth driven by technological advancements and increased demand for space-based services. Strategic partnerships, investments in research and development, and the continued improvement of reusable launch vehicle technologies will be crucial for success in this increasingly competitive market. The market is expected to reach xx Million by 2033, creating abundant opportunities for both established players and new entrants. The key to success lies in innovation, cost reduction, and a strategic approach to capture market share in the face of growing competition.
Reusable Launch Vehicles Market Segmentation
-
1. Type
- 1.1. Partially Reusable
- 1.2. Fully Reusable
-
2. Configuration
- 2.1. Single-Stage
- 2.2. Multi-Stage
Reusable Launch Vehicles Market Segmentation By Geography
-
1. North America
- 1.1. North America
- 1.2. Canada
-
2. Europe
- 2.1. United Kingdom
- 2.2. Germany
- 2.3. France
- 2.4. Italy
- 2.5. Russia
- 2.6. Rest of Europe
-
3. Asia Pacific
- 3.1. China
- 3.2. India
- 3.3. Japan
- 3.4. South Korea
- 3.5. Rest of Asia Pacific
-
4. Latin America
- 4.1. Brazil
- 4.2. Mexico
- 4.3. Rest of Latin America
-
5. Middle East and Africa
- 5.1. Saudi Arabia
- 5.2. United Arab Emirates
- 5.3. Israel
- 5.4. South Africa
- 5.5. Rest of Middle East and Africa
Reusable Launch Vehicles Market Regional Market Share
Geographic Coverage of Reusable Launch Vehicles Market
Reusable Launch Vehicles Market REPORT HIGHLIGHTS
| Aspects | Details |
|---|---|
| Study Period | 2020-2034 |
| Base Year | 2025 |
| Estimated Year | 2026 |
| Forecast Period | 2026-2034 |
| Historical Period | 2020-2025 |
| Growth Rate | CAGR of 11.65% from 2020-2034 |
| Segmentation |
|
Table of Contents
- 1. Introduction
- 1.1. Research Scope
- 1.2. Market Segmentation
- 1.3. Research Objective
- 1.4. Definitions and Assumptions
- 2. Executive Summary
- 2.1. Market Snapshot
- 3. Market Dynamics
- 3.1. Market Drivers
- 3.2. Market Restrains
- 3.3. Market Trends
- 3.4. Market Opportunities
- 4. Market Factor Analysis
- 4.1. Porters Five Forces
- 4.1.1. Bargaining Power of Suppliers
- 4.1.2. Bargaining Power of Buyers
- 4.1.3. Threat of New Entrants
- 4.1.4. Threat of Substitutes
- 4.1.5. Competitive Rivalry
- 4.2. PESTEL analysis
- 4.3. BCG Analysis
- 4.3.1. Stars (High Growth, High Market Share)
- 4.3.2. Cash Cows (Low Growth, High Market Share)
- 4.3.3. Question Mark (High Growth, Low Market Share)
- 4.3.4. Dogs (Low Growth, Low Market Share)
- 4.4. Ansoff Matrix Analysis
- 4.5. Supply Chain Analysis
- 4.6. Regulatory Landscape
- 4.7. Current Market Potential and Opportunity Assessment (TAM–SAM–SOM Framework)
- 4.8. MDP Analyst Note
- 4.1. Porters Five Forces
- 5. Market Analysis, Insights and Forecast 2021-2033
- 5.1. Market Analysis, Insights and Forecast - by Type
- 5.1.1. Partially Reusable
- 5.1.2. Fully Reusable
- 5.2. Market Analysis, Insights and Forecast - by Configuration
- 5.2.1. Single-Stage
- 5.2.2. Multi-Stage
- 5.3. Market Analysis, Insights and Forecast - by Region
- 5.3.1. North America
- 5.3.2. Europe
- 5.3.3. Asia Pacific
- 5.3.4. Latin America
- 5.3.5. Middle East and Africa
- 5.1. Market Analysis, Insights and Forecast - by Type
- 6. Global Reusable Launch Vehicles Market Analysis, Insights and Forecast, 2021-2033
- 6.1. Market Analysis, Insights and Forecast - by Type
- 6.1.1. Partially Reusable
- 6.1.2. Fully Reusable
- 6.2. Market Analysis, Insights and Forecast - by Configuration
- 6.2.1. Single-Stage
- 6.2.2. Multi-Stage
- 6.1. Market Analysis, Insights and Forecast - by Type
- 7. North America Reusable Launch Vehicles Market Analysis, Insights and Forecast, 2020-2032
- 7.1. Market Analysis, Insights and Forecast - by Type
- 7.1.1. Partially Reusable
- 7.1.2. Fully Reusable
- 7.2. Market Analysis, Insights and Forecast - by Configuration
- 7.2.1. Single-Stage
- 7.2.2. Multi-Stage
- 7.1. Market Analysis, Insights and Forecast - by Type
- 8. Europe Reusable Launch Vehicles Market Analysis, Insights and Forecast, 2020-2032
- 8.1. Market Analysis, Insights and Forecast - by Type
- 8.1.1. Partially Reusable
- 8.1.2. Fully Reusable
- 8.2. Market Analysis, Insights and Forecast - by Configuration
- 8.2.1. Single-Stage
- 8.2.2. Multi-Stage
- 8.1. Market Analysis, Insights and Forecast - by Type
- 9. Asia Pacific Reusable Launch Vehicles Market Analysis, Insights and Forecast, 2020-2032
- 9.1. Market Analysis, Insights and Forecast - by Type
- 9.1.1. Partially Reusable
- 9.1.2. Fully Reusable
- 9.2. Market Analysis, Insights and Forecast - by Configuration
- 9.2.1. Single-Stage
- 9.2.2. Multi-Stage
- 9.1. Market Analysis, Insights and Forecast - by Type
- 10. Latin America Reusable Launch Vehicles Market Analysis, Insights and Forecast, 2020-2032
- 10.1. Market Analysis, Insights and Forecast - by Type
- 10.1.1. Partially Reusable
- 10.1.2. Fully Reusable
- 10.2. Market Analysis, Insights and Forecast - by Configuration
- 10.2.1. Single-Stage
- 10.2.2. Multi-Stage
- 10.1. Market Analysis, Insights and Forecast - by Type
- 11. Middle East and Africa Reusable Launch Vehicles Market Analysis, Insights and Forecast, 2020-2032
- 11.1. Market Analysis, Insights and Forecast - by Type
- 11.1.1. Partially Reusable
- 11.1.2. Fully Reusable
- 11.2. Market Analysis, Insights and Forecast - by Configuration
- 11.2.1. Single-Stage
- 11.2.2. Multi-Stage
- 11.1. Market Analysis, Insights and Forecast - by Type
- 12. Competitive Analysis
- 12.1. Company Profiles
- 12.1.1 Space Exploration Technologies Corp
- 12.1.1.1. Company Overview
- 12.1.1.2. Products
- 12.1.1.3. Company Financials
- 12.1.1.4. SWOT Analysis
- 12.1.2 United Launch Alliance LLC
- 12.1.2.1. Company Overview
- 12.1.2.2. Products
- 12.1.2.3. Company Financials
- 12.1.2.4. SWOT Analysis
- 12.1.3 LinkSpace Aerospace Technology Group
- 12.1.3.1. Company Overview
- 12.1.3.2. Products
- 12.1.3.3. Company Financials
- 12.1.3.4. SWOT Analysis
- 12.1.4 China Aerospace Science and Technology Corp (CASC)
- 12.1.4.1. Company Overview
- 12.1.4.2. Products
- 12.1.4.3. Company Financials
- 12.1.4.4. SWOT Analysis
- 12.1.5 Blue Origin Enterprises L P
- 12.1.5.1. Company Overview
- 12.1.5.2. Products
- 12.1.5.3. Company Financials
- 12.1.5.4. SWOT Analysis
- 12.1.6 ArianeGroup
- 12.1.6.1. Company Overview
- 12.1.6.2. Products
- 12.1.6.3. Company Financials
- 12.1.6.4. SWOT Analysis
- 12.1.7 Deutsches Zentrum für Luft- und Raumfahrt e V (DLR
- 12.1.7.1. Company Overview
- 12.1.7.2. Products
- 12.1.7.3. Company Financials
- 12.1.7.4. SWOT Analysis
- 12.1.8 Indian Space Research Organisation (ISRO)
- 12.1.8.1. Company Overview
- 12.1.8.2. Products
- 12.1.8.3. Company Financials
- 12.1.8.4. SWOT Analysis
- 12.1.9 National Aeronautics and Space Administration (NASA)
- 12.1.9.1. Company Overview
- 12.1.9.2. Products
- 12.1.9.3. Company Financials
- 12.1.9.4. SWOT Analysis
- 12.1.1 Space Exploration Technologies Corp
- 12.2. Market Entropy
- 12.2.1 Company's Key Areas Served
- 12.2.2 Recent Developments
- 12.3. Company Market Share Analysis 2025
- 12.3.1 Top 5 Companies Market Share Analysis
- 12.3.2 Top 3 Companies Market Share Analysis
- 12.4. List of Potential Customers
- 13. Research Methodology
List of Figures
- Figure 1: Global Reusable Launch Vehicles Market Revenue Breakdown (Million, %) by Region 2025 & 2033
- Figure 2: North America Reusable Launch Vehicles Market Revenue (Million), by Type 2025 & 2033
- Figure 3: North America Reusable Launch Vehicles Market Revenue Share (%), by Type 2025 & 2033
- Figure 4: North America Reusable Launch Vehicles Market Revenue (Million), by Configuration 2025 & 2033
- Figure 5: North America Reusable Launch Vehicles Market Revenue Share (%), by Configuration 2025 & 2033
- Figure 6: North America Reusable Launch Vehicles Market Revenue (Million), by Country 2025 & 2033
- Figure 7: North America Reusable Launch Vehicles Market Revenue Share (%), by Country 2025 & 2033
- Figure 8: Europe Reusable Launch Vehicles Market Revenue (Million), by Type 2025 & 2033
- Figure 9: Europe Reusable Launch Vehicles Market Revenue Share (%), by Type 2025 & 2033
- Figure 10: Europe Reusable Launch Vehicles Market Revenue (Million), by Configuration 2025 & 2033
- Figure 11: Europe Reusable Launch Vehicles Market Revenue Share (%), by Configuration 2025 & 2033
- Figure 12: Europe Reusable Launch Vehicles Market Revenue (Million), by Country 2025 & 2033
- Figure 13: Europe Reusable Launch Vehicles Market Revenue Share (%), by Country 2025 & 2033
- Figure 14: Asia Pacific Reusable Launch Vehicles Market Revenue (Million), by Type 2025 & 2033
- Figure 15: Asia Pacific Reusable Launch Vehicles Market Revenue Share (%), by Type 2025 & 2033
- Figure 16: Asia Pacific Reusable Launch Vehicles Market Revenue (Million), by Configuration 2025 & 2033
- Figure 17: Asia Pacific Reusable Launch Vehicles Market Revenue Share (%), by Configuration 2025 & 2033
- Figure 18: Asia Pacific Reusable Launch Vehicles Market Revenue (Million), by Country 2025 & 2033
- Figure 19: Asia Pacific Reusable Launch Vehicles Market Revenue Share (%), by Country 2025 & 2033
- Figure 20: Latin America Reusable Launch Vehicles Market Revenue (Million), by Type 2025 & 2033
- Figure 21: Latin America Reusable Launch Vehicles Market Revenue Share (%), by Type 2025 & 2033
- Figure 22: Latin America Reusable Launch Vehicles Market Revenue (Million), by Configuration 2025 & 2033
- Figure 23: Latin America Reusable Launch Vehicles Market Revenue Share (%), by Configuration 2025 & 2033
- Figure 24: Latin America Reusable Launch Vehicles Market Revenue (Million), by Country 2025 & 2033
- Figure 25: Latin America Reusable Launch Vehicles Market Revenue Share (%), by Country 2025 & 2033
- Figure 26: Middle East and Africa Reusable Launch Vehicles Market Revenue (Million), by Type 2025 & 2033
- Figure 27: Middle East and Africa Reusable Launch Vehicles Market Revenue Share (%), by Type 2025 & 2033
- Figure 28: Middle East and Africa Reusable Launch Vehicles Market Revenue (Million), by Configuration 2025 & 2033
- Figure 29: Middle East and Africa Reusable Launch Vehicles Market Revenue Share (%), by Configuration 2025 & 2033
- Figure 30: Middle East and Africa Reusable Launch Vehicles Market Revenue (Million), by Country 2025 & 2033
- Figure 31: Middle East and Africa Reusable Launch Vehicles Market Revenue Share (%), by Country 2025 & 2033
List of Tables
- Table 1: Global Reusable Launch Vehicles Market Revenue Million Forecast, by Type 2020 & 2033
- Table 2: Global Reusable Launch Vehicles Market Revenue Million Forecast, by Configuration 2020 & 2033
- Table 3: Global Reusable Launch Vehicles Market Revenue Million Forecast, by Region 2020 & 2033
- Table 4: Global Reusable Launch Vehicles Market Revenue Million Forecast, by Type 2020 & 2033
- Table 5: Global Reusable Launch Vehicles Market Revenue Million Forecast, by Configuration 2020 & 2033
- Table 6: Global Reusable Launch Vehicles Market Revenue Million Forecast, by Country 2020 & 2033
- Table 7: North America Reusable Launch Vehicles Market Revenue (Million) Forecast, by Application 2020 & 2033
- Table 8: Canada Reusable Launch Vehicles Market Revenue (Million) Forecast, by Application 2020 & 2033
- Table 9: Global Reusable Launch Vehicles Market Revenue Million Forecast, by Type 2020 & 2033
- Table 10: Global Reusable Launch Vehicles Market Revenue Million Forecast, by Configuration 2020 & 2033
- Table 11: Global Reusable Launch Vehicles Market Revenue Million Forecast, by Country 2020 & 2033
- Table 12: United Kingdom Reusable Launch Vehicles Market Revenue (Million) Forecast, by Application 2020 & 2033
- Table 13: Germany Reusable Launch Vehicles Market Revenue (Million) Forecast, by Application 2020 & 2033
- Table 14: France Reusable Launch Vehicles Market Revenue (Million) Forecast, by Application 2020 & 2033
- Table 15: Italy Reusable Launch Vehicles Market Revenue (Million) Forecast, by Application 2020 & 2033
- Table 16: Russia Reusable Launch Vehicles Market Revenue (Million) Forecast, by Application 2020 & 2033
- Table 17: Rest of Europe Reusable Launch Vehicles Market Revenue (Million) Forecast, by Application 2020 & 2033
- Table 18: Global Reusable Launch Vehicles Market Revenue Million Forecast, by Type 2020 & 2033
- Table 19: Global Reusable Launch Vehicles Market Revenue Million Forecast, by Configuration 2020 & 2033
- Table 20: Global Reusable Launch Vehicles Market Revenue Million Forecast, by Country 2020 & 2033
- Table 21: China Reusable Launch Vehicles Market Revenue (Million) Forecast, by Application 2020 & 2033
- Table 22: India Reusable Launch Vehicles Market Revenue (Million) Forecast, by Application 2020 & 2033
- Table 23: Japan Reusable Launch Vehicles Market Revenue (Million) Forecast, by Application 2020 & 2033
- Table 24: South Korea Reusable Launch Vehicles Market Revenue (Million) Forecast, by Application 2020 & 2033
- Table 25: Rest of Asia Pacific Reusable Launch Vehicles Market Revenue (Million) Forecast, by Application 2020 & 2033
- Table 26: Global Reusable Launch Vehicles Market Revenue Million Forecast, by Type 2020 & 2033
- Table 27: Global Reusable Launch Vehicles Market Revenue Million Forecast, by Configuration 2020 & 2033
- Table 28: Global Reusable Launch Vehicles Market Revenue Million Forecast, by Country 2020 & 2033
- Table 29: Brazil Reusable Launch Vehicles Market Revenue (Million) Forecast, by Application 2020 & 2033
- Table 30: Mexico Reusable Launch Vehicles Market Revenue (Million) Forecast, by Application 2020 & 2033
- Table 31: Rest of Latin America Reusable Launch Vehicles Market Revenue (Million) Forecast, by Application 2020 & 2033
- Table 32: Global Reusable Launch Vehicles Market Revenue Million Forecast, by Type 2020 & 2033
- Table 33: Global Reusable Launch Vehicles Market Revenue Million Forecast, by Configuration 2020 & 2033
- Table 34: Global Reusable Launch Vehicles Market Revenue Million Forecast, by Country 2020 & 2033
- Table 35: Saudi Arabia Reusable Launch Vehicles Market Revenue (Million) Forecast, by Application 2020 & 2033
- Table 36: United Arab Emirates Reusable Launch Vehicles Market Revenue (Million) Forecast, by Application 2020 & 2033
- Table 37: Israel Reusable Launch Vehicles Market Revenue (Million) Forecast, by Application 2020 & 2033
- Table 38: South Africa Reusable Launch Vehicles Market Revenue (Million) Forecast, by Application 2020 & 2033
- Table 39: Rest of Middle East and Africa Reusable Launch Vehicles Market Revenue (Million) Forecast, by Application 2020 & 2033
Frequently Asked Questions
1. What is the projected Compound Annual Growth Rate (CAGR) of the Reusable Launch Vehicles Market?
The projected CAGR is approximately 11.65%.
2. Which companies are prominent players in the Reusable Launch Vehicles Market?
Key companies in the market include Space Exploration Technologies Corp, United Launch Alliance LLC, LinkSpace Aerospace Technology Group, China Aerospace Science and Technology Corp (CASC), Blue Origin Enterprises L P, ArianeGroup, Deutsches Zentrum für Luft- und Raumfahrt e V (DLR, Indian Space Research Organisation (ISRO), National Aeronautics and Space Administration (NASA).
3. What are the main segments of the Reusable Launch Vehicles Market?
The market segments include Type, Configuration.
4. Can you provide details about the market size?
The market size is estimated to be USD 3.05 Million as of 2022.
5. What are some drivers contributing to market growth?
N/A
6. What are the notable trends driving market growth?
Fully Reusable Launch Vehicles to hold the Largest Market Share in 2023.
7. Are there any restraints impacting market growth?
N/A
8. Can you provide examples of recent developments in the market?
N/A
9. What pricing options are available for accessing the report?
Pricing options include single-user, multi-user, and enterprise licenses priced at USD 4750, USD 5250, and USD 8750 respectively.
10. Is the market size provided in terms of value or volume?
The market size is provided in terms of value, measured in Million.
11. Are there any specific market keywords associated with the report?
Yes, the market keyword associated with the report is "Reusable Launch Vehicles Market," which aids in identifying and referencing the specific market segment covered.
12. How do I determine which pricing option suits my needs best?
The pricing options vary based on user requirements and access needs. Individual users may opt for single-user licenses, while businesses requiring broader access may choose multi-user or enterprise licenses for cost-effective access to the report.
13. Are there any additional resources or data provided in the Reusable Launch Vehicles Market report?
While the report offers comprehensive insights, it's advisable to review the specific contents or supplementary materials provided to ascertain if additional resources or data are available.
14. How can I stay updated on further developments or reports in the Reusable Launch Vehicles Market?
To stay informed about further developments, trends, and reports in the Reusable Launch Vehicles Market, consider subscribing to industry newsletters, following relevant companies and organizations, or regularly checking reputable industry news sources and publications.
Methodology
Step 1 - Identification of Relevant Samples Size from Population Database


Step 2 - Approaches for Defining Global Market Size (Value, Volume* & Price*)

Note*: In applicable scenarios
Step 3 - Data Sources
Primary Research
- Web Analytics
- Survey Reports
- Research Institute
- Latest Research Reports
- Opinion Leaders
Secondary Research
- Annual Reports
- White Paper
- Latest Press Release
- Industry Association
- Paid Database
- Investor Presentations

Step 4 - Data Triangulation
Involves using different sources of information in order to increase the validity of a study
These sources are likely to be stakeholders in a program - participants, other researchers, program staff, other community members, and so on.
Then we put all data in single framework & apply various statistical tools to find out the dynamic on the market.
During the analysis stage, feedback from the stakeholder groups would be compared to determine areas of agreement as well as areas of divergence