

Key Insights
The Remote Sensing Technology market is poised for significant expansion, driven by the escalating demand for high-resolution geospatial data across diverse industries. The market is projected to reach $25.37 billion by 2025, exhibiting a Compound Annual Growth Rate (CAGR) of 11.59%. Key growth catalysts include the widespread adoption of remote sensing in precision agriculture, environmental monitoring, urban planning, and disaster management. Innovations in sensor technology, satellite miniaturization, and declining data processing costs further accelerate market growth. The commercial sector is a major contributor, with increasing private investment in Earth observation applications, while military and government sectors remain vital for intelligence and national security.
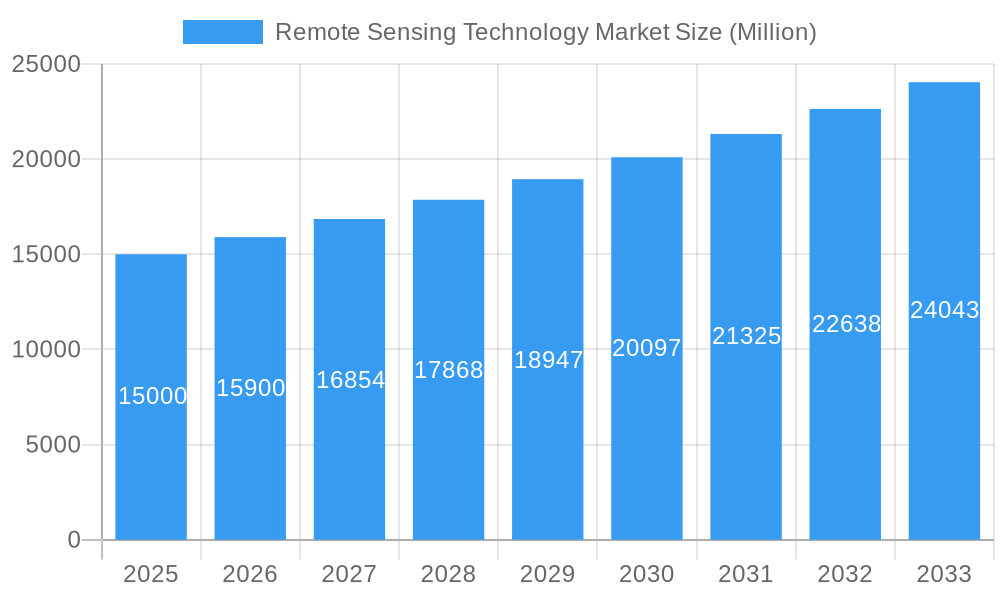
Remote Sensing Technology Market Market Size (In Billion)
Within satellite mass segments, higher mass satellites offer advanced capabilities and premium pricing. The demand for Low Earth Orbit (LEO) satellites is anticipated to surge due to their superior resolution and revisit times compared to Geostationary Earth Orbit (GEO) satellites.
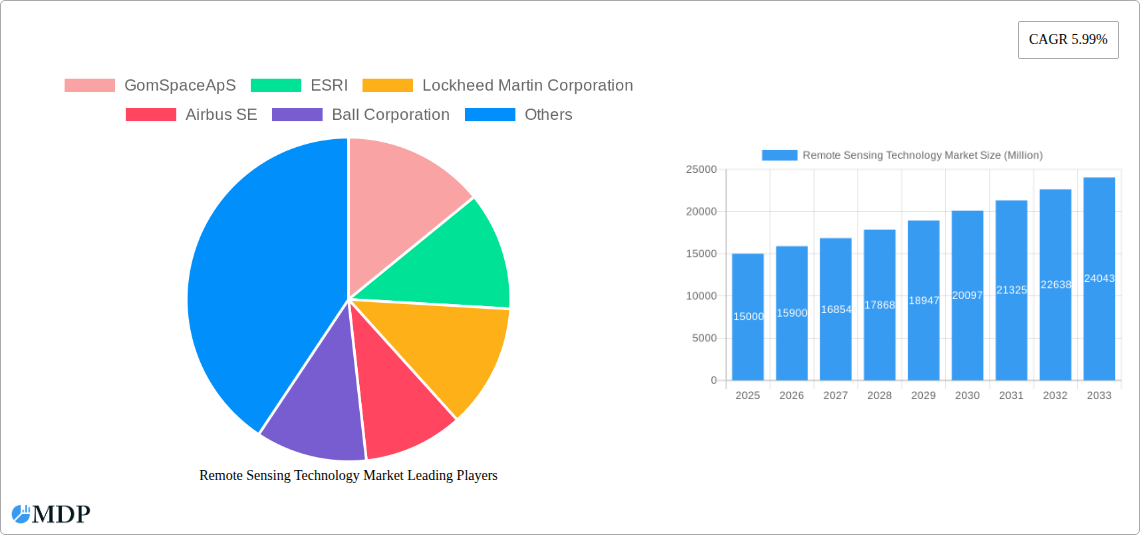
Remote Sensing Technology Market Company Market Share
The competitive landscape features established aerospace firms and agile technology startups, alongside prominent national space agencies. Despite potential restraints from regulatory complexities, data security, and high initial investment, ongoing technological advancements and supportive government initiatives are expected to foster sustained market growth. Market participants are prioritizing innovation in sensor technology, data analytics, and cost-effective satellite constellations to secure a competitive advantage.
Remote Sensing Technology Market: A Comprehensive Report 2019-2033
This comprehensive report provides an in-depth analysis of the Remote Sensing Technology Market, offering valuable insights for stakeholders across the industry. Covering the period 2019-2033, with a base year of 2025 and a forecast period of 2025-2033, this report meticulously examines market dynamics, trends, leading segments, and key players, ultimately providing a strategic outlook for future growth.
Remote Sensing Technology Market Market Dynamics & Concentration
The Remote Sensing Technology market exhibits a moderately concentrated landscape, with a few major players holding significant market share. Innovation is a key driver, fueled by advancements in sensor technology, data analytics, and satellite platforms. Stringent regulatory frameworks, particularly concerning data privacy and national security, influence market operations. The market witnesses considerable M&A activity, reflecting strategic efforts to consolidate market share and expand technological capabilities. Substitute technologies, such as aerial photography and LiDAR, present competitive challenges. End-user trends lean towards increased adoption of remote sensing across commercial, military, and government sectors, driven by growing data demands and the need for real-time insights.
- Market Concentration: The top 5 players account for approximately xx% of the global market share in 2025.
- M&A Activity: An estimated xx M&A deals were recorded between 2019 and 2024.
- Innovation Drivers: Advances in AI, Machine Learning and miniaturization of satellite technology.
- Regulatory Landscape: Stringent data privacy regulations in regions like Europe and North America are shaping market dynamics.
Remote Sensing Technology Market Industry Trends & Analysis
The Remote Sensing Technology market is experiencing robust growth, driven by increasing demand across diverse sectors. The Compound Annual Growth Rate (CAGR) is projected to be xx% during the forecast period (2025-2033). This expansion is fueled by technological advancements such as higher-resolution imaging, improved data processing capabilities, and the proliferation of small satellites. Consumer preferences are shifting towards cost-effective, readily accessible remote sensing solutions. Competitive dynamics are characterized by intense rivalry among established players and emerging entrants, leading to continuous innovation and price competition. Market penetration across various end-user segments continues to rise, particularly in developing economies where infrastructure development and resource management are key priorities.
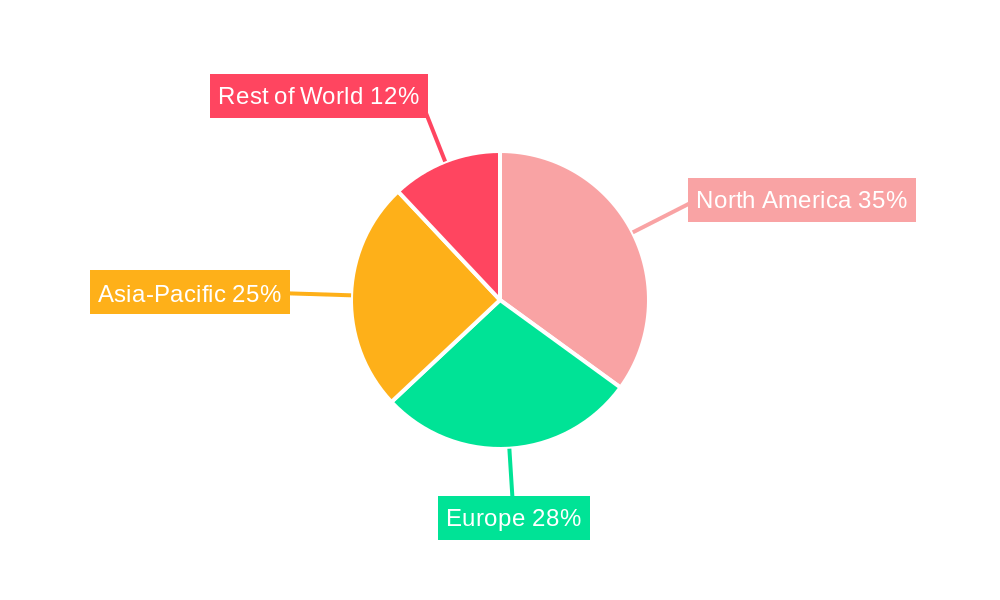
Leading Markets & Segments in Remote Sensing Technology Market
The North American region currently holds a leading position in the Remote Sensing Technology market, driven by strong government investments, advanced technological infrastructure and a robust commercial sector. Within the segment breakdown:
End User:
- Military & Government: This segment dominates the market, owing to substantial investments in national security and defense applications.
- Commercial: This segment shows significant growth potential, fueled by increasing adoption across sectors like agriculture, construction, and environmental monitoring.
Satellite Mass:
- 10-100kg: This segment is experiencing rapid growth due to the increased use of CubeSats and other small satellites.
- 100-500kg: This segment remains a significant portion of the market, offering a balance between payload capacity and launch cost.
Orbit Class:
- LEO: The Low Earth Orbit (LEO) segment holds the largest market share, owing to its cost-effectiveness and relatively quick data acquisition times.
Satellite Subsystem:
- Satellite Bus & Subsystems: This segment constitutes the largest proportion, reflecting the vital role of the satellite platform in overall system performance.
Key Drivers (examples):
- North America: Strong government funding for space research and robust private sector investment.
- Europe: Focus on environmental monitoring and sustainable resource management.
- Asia-Pacific: Rapid infrastructure development and urbanization are driving demand.
Remote Sensing Technology Market Product Developments
Recent product innovations include miniaturized satellites with enhanced imaging capabilities, advanced data analytics platforms, and improved data processing algorithms. These advancements enable real-time data acquisition, higher resolution imagery, and more efficient data analysis, resulting in cost-effective solutions with improved accuracy and reliability. This directly improves market fit by catering to the growing demand for precise and timely information across diverse applications.
Key Drivers of Remote Sensing Technology Market Growth
The market's growth is driven by technological advancements, economic factors, and supportive regulatory environments. Specifically:
- Technological Advancements: Miniaturization of satellites, improved sensor technology, and advanced data analytics capabilities are key catalysts.
- Economic Factors: Growing investment in infrastructure, increasing demand for resource management and environmental monitoring, and the commercialization of space are major contributors.
- Regulatory Support: Government initiatives promoting space exploration and technology development further fuel market growth.
Challenges in the Remote Sensing Technology Market Market
Several challenges hinder market expansion:
- High Initial Investment Costs: Developing and deploying satellite systems requires substantial capital investment.
- Data Security and Privacy Concerns: Stricter regulations on data handling and protection are increasing operational costs and complexities.
- Competition: Intense competition among established players and emerging companies.
Emerging Opportunities in Remote Sensing Technology Market
Technological breakthroughs, strategic partnerships, and market expansion into emerging economies present significant growth opportunities. The integration of AI and machine learning into data analysis pipelines is revolutionizing the sector, improving efficiency and generating valuable insights. Collaborations between private companies and government agencies are creating synergies, streamlining access to resources and data. Expanding into developing nations with unmet needs for infrastructure development and resource management presents considerable market potential.
Leading Players in the Remote Sensing Technology Market Sector
- GomSpace ApS
- ESRI
- Lockheed Martin Corporation
- Airbus SE
- Ball Corporation
- Japan Aerospace Exploration Agency (JAXA)
- China Aerospace Science and Technology Corporation (CASC)
- Maxar Technologies Inc
- ROSCOSMOS
- Thale
- Planet Labs Inc
- Northrop Grumman Corporation
- Indian Space Research Organisation (ISRO)
- IHI Corporation
- Spire Global Inc
Key Milestones in Remote Sensing Technology Market Industry
- March 2023: JAXA scheduled the launch of the H3 Launch Vehicle with ALOS-3, signifying advancements in Earth observation capabilities.
- February 2023: The NASA-Esri agreement broadened access to geospatial data, boosting research and development.
- January 2023: Airbus secured a contract with Poland for two high-performance Earth observation satellites, highlighting growing demand for geospatial intelligence.
Strategic Outlook for Remote Sensing Technology Market Market
The Remote Sensing Technology market exhibits immense growth potential, driven by continuous technological innovation, expanding applications, and increasing global investment in space exploration. Strategic opportunities lie in developing advanced data analytics capabilities, fostering strategic partnerships to leverage diverse expertise, and focusing on cost-effective solutions to expand market reach, particularly in emerging economies. The future will see an increased demand for integrated solutions combining remote sensing data with other information sources to provide comprehensive insights across various applications.
Remote Sensing Technology Market Segmentation
-
1. Satellite Mass
- 1.1. 10-100kg
- 1.2. 100-500kg
- 1.3. 500-1000kg
- 1.4. Below 10 Kg
- 1.5. above 1000kg
-
2. Orbit Class
- 2.1. GEO
- 2.2. LEO
- 2.3. MEO
-
3. Satellite Subsystem
- 3.1. Propulsion Hardware and Propellant
- 3.2. Satellite Bus & Subsystems
- 3.3. Solar Array & Power Hardware
- 3.4. Structures, Harness & Mechanisms
-
4. End User
- 4.1. Commercial
- 4.2. Military & Government
- 4.3. Other
Remote Sensing Technology Market Segmentation By Geography
-
1. North America
- 1.1. United States
- 1.2. Canada
- 1.3. Mexico
-
2. South America
- 2.1. Brazil
- 2.2. Argentina
- 2.3. Rest of South America
-
3. Europe
- 3.1. United Kingdom
- 3.2. Germany
- 3.3. France
- 3.4. Italy
- 3.5. Spain
- 3.6. Russia
- 3.7. Benelux
- 3.8. Nordics
- 3.9. Rest of Europe
-
4. Middle East & Africa
- 4.1. Turkey
- 4.2. Israel
- 4.3. GCC
- 4.4. North Africa
- 4.5. South Africa
- 4.6. Rest of Middle East & Africa
-
5. Asia Pacific
- 5.1. China
- 5.2. India
- 5.3. Japan
- 5.4. South Korea
- 5.5. ASEAN
- 5.6. Oceania
- 5.7. Rest of Asia Pacific
Remote Sensing Technology Market Regional Market Share
Geographic Coverage of Remote Sensing Technology Market
Remote Sensing Technology Market REPORT HIGHLIGHTS
| Aspects | Details |
|---|---|
| Study Period | 2020-2034 |
| Base Year | 2025 |
| Estimated Year | 2026 |
| Forecast Period | 2026-2034 |
| Historical Period | 2020-2025 |
| Growth Rate | CAGR of 11.59% from 2020-2034 |
| Segmentation |
|
Table of Contents
- 1. Introduction
- 1.1. Research Scope
- 1.2. Market Segmentation
- 1.3. Research Objective
- 1.4. Definitions and Assumptions
- 2. Executive Summary
- 2.1. Market Snapshot
- 3. Market Dynamics
- 3.1. Market Drivers
- 3.2. Market Restrains
- 3.3. Market Trends
- 3.4. Market Opportunities
- 4. Market Factor Analysis
- 4.1. Porters Five Forces
- 4.1.1. Bargaining Power of Suppliers
- 4.1.2. Bargaining Power of Buyers
- 4.1.3. Threat of New Entrants
- 4.1.4. Threat of Substitutes
- 4.1.5. Competitive Rivalry
- 4.2. PESTEL analysis
- 4.3. BCG Analysis
- 4.3.1. Stars (High Growth, High Market Share)
- 4.3.2. Cash Cows (Low Growth, High Market Share)
- 4.3.3. Question Mark (High Growth, Low Market Share)
- 4.3.4. Dogs (Low Growth, Low Market Share)
- 4.4. Ansoff Matrix Analysis
- 4.5. Supply Chain Analysis
- 4.6. Regulatory Landscape
- 4.7. Current Market Potential and Opportunity Assessment (TAM–SAM–SOM Framework)
- 4.8. MDP Analyst Note
- 4.1. Porters Five Forces
- 5. Market Analysis, Insights and Forecast 2021-2033
- 5.1. Market Analysis, Insights and Forecast - by Satellite Mass
- 5.1.1. 10-100kg
- 5.1.2. 100-500kg
- 5.1.3. 500-1000kg
- 5.1.4. Below 10 Kg
- 5.1.5. above 1000kg
- 5.2. Market Analysis, Insights and Forecast - by Orbit Class
- 5.2.1. GEO
- 5.2.2. LEO
- 5.2.3. MEO
- 5.3. Market Analysis, Insights and Forecast - by Satellite Subsystem
- 5.3.1. Propulsion Hardware and Propellant
- 5.3.2. Satellite Bus & Subsystems
- 5.3.3. Solar Array & Power Hardware
- 5.3.4. Structures, Harness & Mechanisms
- 5.4. Market Analysis, Insights and Forecast - by End User
- 5.4.1. Commercial
- 5.4.2. Military & Government
- 5.4.3. Other
- 5.5. Market Analysis, Insights and Forecast - by Region
- 5.5.1. North America
- 5.5.2. South America
- 5.5.3. Europe
- 5.5.4. Middle East & Africa
- 5.5.5. Asia Pacific
- 5.1. Market Analysis, Insights and Forecast - by Satellite Mass
- 6. Global Remote Sensing Technology Market Analysis, Insights and Forecast, 2021-2033
- 6.1. Market Analysis, Insights and Forecast - by Satellite Mass
- 6.1.1. 10-100kg
- 6.1.2. 100-500kg
- 6.1.3. 500-1000kg
- 6.1.4. Below 10 Kg
- 6.1.5. above 1000kg
- 6.2. Market Analysis, Insights and Forecast - by Orbit Class
- 6.2.1. GEO
- 6.2.2. LEO
- 6.2.3. MEO
- 6.3. Market Analysis, Insights and Forecast - by Satellite Subsystem
- 6.3.1. Propulsion Hardware and Propellant
- 6.3.2. Satellite Bus & Subsystems
- 6.3.3. Solar Array & Power Hardware
- 6.3.4. Structures, Harness & Mechanisms
- 6.4. Market Analysis, Insights and Forecast - by End User
- 6.4.1. Commercial
- 6.4.2. Military & Government
- 6.4.3. Other
- 6.1. Market Analysis, Insights and Forecast - by Satellite Mass
- 7. North America Remote Sensing Technology Market Analysis, Insights and Forecast, 2020-2032
- 7.1. Market Analysis, Insights and Forecast - by Satellite Mass
- 7.1.1. 10-100kg
- 7.1.2. 100-500kg
- 7.1.3. 500-1000kg
- 7.1.4. Below 10 Kg
- 7.1.5. above 1000kg
- 7.2. Market Analysis, Insights and Forecast - by Orbit Class
- 7.2.1. GEO
- 7.2.2. LEO
- 7.2.3. MEO
- 7.3. Market Analysis, Insights and Forecast - by Satellite Subsystem
- 7.3.1. Propulsion Hardware and Propellant
- 7.3.2. Satellite Bus & Subsystems
- 7.3.3. Solar Array & Power Hardware
- 7.3.4. Structures, Harness & Mechanisms
- 7.4. Market Analysis, Insights and Forecast - by End User
- 7.4.1. Commercial
- 7.4.2. Military & Government
- 7.4.3. Other
- 7.1. Market Analysis, Insights and Forecast - by Satellite Mass
- 8. South America Remote Sensing Technology Market Analysis, Insights and Forecast, 2020-2032
- 8.1. Market Analysis, Insights and Forecast - by Satellite Mass
- 8.1.1. 10-100kg
- 8.1.2. 100-500kg
- 8.1.3. 500-1000kg
- 8.1.4. Below 10 Kg
- 8.1.5. above 1000kg
- 8.2. Market Analysis, Insights and Forecast - by Orbit Class
- 8.2.1. GEO
- 8.2.2. LEO
- 8.2.3. MEO
- 8.3. Market Analysis, Insights and Forecast - by Satellite Subsystem
- 8.3.1. Propulsion Hardware and Propellant
- 8.3.2. Satellite Bus & Subsystems
- 8.3.3. Solar Array & Power Hardware
- 8.3.4. Structures, Harness & Mechanisms
- 8.4. Market Analysis, Insights and Forecast - by End User
- 8.4.1. Commercial
- 8.4.2. Military & Government
- 8.4.3. Other
- 8.1. Market Analysis, Insights and Forecast - by Satellite Mass
- 9. Europe Remote Sensing Technology Market Analysis, Insights and Forecast, 2020-2032
- 9.1. Market Analysis, Insights and Forecast - by Satellite Mass
- 9.1.1. 10-100kg
- 9.1.2. 100-500kg
- 9.1.3. 500-1000kg
- 9.1.4. Below 10 Kg
- 9.1.5. above 1000kg
- 9.2. Market Analysis, Insights and Forecast - by Orbit Class
- 9.2.1. GEO
- 9.2.2. LEO
- 9.2.3. MEO
- 9.3. Market Analysis, Insights and Forecast - by Satellite Subsystem
- 9.3.1. Propulsion Hardware and Propellant
- 9.3.2. Satellite Bus & Subsystems
- 9.3.3. Solar Array & Power Hardware
- 9.3.4. Structures, Harness & Mechanisms
- 9.4. Market Analysis, Insights and Forecast - by End User
- 9.4.1. Commercial
- 9.4.2. Military & Government
- 9.4.3. Other
- 9.1. Market Analysis, Insights and Forecast - by Satellite Mass
- 10. Middle East & Africa Remote Sensing Technology Market Analysis, Insights and Forecast, 2020-2032
- 10.1. Market Analysis, Insights and Forecast - by Satellite Mass
- 10.1.1. 10-100kg
- 10.1.2. 100-500kg
- 10.1.3. 500-1000kg
- 10.1.4. Below 10 Kg
- 10.1.5. above 1000kg
- 10.2. Market Analysis, Insights and Forecast - by Orbit Class
- 10.2.1. GEO
- 10.2.2. LEO
- 10.2.3. MEO
- 10.3. Market Analysis, Insights and Forecast - by Satellite Subsystem
- 10.3.1. Propulsion Hardware and Propellant
- 10.3.2. Satellite Bus & Subsystems
- 10.3.3. Solar Array & Power Hardware
- 10.3.4. Structures, Harness & Mechanisms
- 10.4. Market Analysis, Insights and Forecast - by End User
- 10.4.1. Commercial
- 10.4.2. Military & Government
- 10.4.3. Other
- 10.1. Market Analysis, Insights and Forecast - by Satellite Mass
- 11. Asia Pacific Remote Sensing Technology Market Analysis, Insights and Forecast, 2020-2032
- 11.1. Market Analysis, Insights and Forecast - by Satellite Mass
- 11.1.1. 10-100kg
- 11.1.2. 100-500kg
- 11.1.3. 500-1000kg
- 11.1.4. Below 10 Kg
- 11.1.5. above 1000kg
- 11.2. Market Analysis, Insights and Forecast - by Orbit Class
- 11.2.1. GEO
- 11.2.2. LEO
- 11.2.3. MEO
- 11.3. Market Analysis, Insights and Forecast - by Satellite Subsystem
- 11.3.1. Propulsion Hardware and Propellant
- 11.3.2. Satellite Bus & Subsystems
- 11.3.3. Solar Array & Power Hardware
- 11.3.4. Structures, Harness & Mechanisms
- 11.4. Market Analysis, Insights and Forecast - by End User
- 11.4.1. Commercial
- 11.4.2. Military & Government
- 11.4.3. Other
- 11.1. Market Analysis, Insights and Forecast - by Satellite Mass
- 12. Competitive Analysis
- 12.1. Company Profiles
- 12.1.1 GomSpaceApS
- 12.1.1.1. Company Overview
- 12.1.1.2. Products
- 12.1.1.3. Company Financials
- 12.1.1.4. SWOT Analysis
- 12.1.2 ESRI
- 12.1.2.1. Company Overview
- 12.1.2.2. Products
- 12.1.2.3. Company Financials
- 12.1.2.4. SWOT Analysis
- 12.1.3 Lockheed Martin Corporation
- 12.1.3.1. Company Overview
- 12.1.3.2. Products
- 12.1.3.3. Company Financials
- 12.1.3.4. SWOT Analysis
- 12.1.4 Airbus SE
- 12.1.4.1. Company Overview
- 12.1.4.2. Products
- 12.1.4.3. Company Financials
- 12.1.4.4. SWOT Analysis
- 12.1.5 Ball Corporation
- 12.1.5.1. Company Overview
- 12.1.5.2. Products
- 12.1.5.3. Company Financials
- 12.1.5.4. SWOT Analysis
- 12.1.6 Japan Aerospace Exploration Agency (JAXA)
- 12.1.6.1. Company Overview
- 12.1.6.2. Products
- 12.1.6.3. Company Financials
- 12.1.6.4. SWOT Analysis
- 12.1.7 China Aerospace Science and Technology Corporation (CASC)
- 12.1.7.1. Company Overview
- 12.1.7.2. Products
- 12.1.7.3. Company Financials
- 12.1.7.4. SWOT Analysis
- 12.1.8 Maxar Technologies Inc
- 12.1.8.1. Company Overview
- 12.1.8.2. Products
- 12.1.8.3. Company Financials
- 12.1.8.4. SWOT Analysis
- 12.1.9 ROSCOSMOS
- 12.1.9.1. Company Overview
- 12.1.9.2. Products
- 12.1.9.3. Company Financials
- 12.1.9.4. SWOT Analysis
- 12.1.10 Thale
- 12.1.10.1. Company Overview
- 12.1.10.2. Products
- 12.1.10.3. Company Financials
- 12.1.10.4. SWOT Analysis
- 12.1.11 Planet Labs Inc
- 12.1.11.1. Company Overview
- 12.1.11.2. Products
- 12.1.11.3. Company Financials
- 12.1.11.4. SWOT Analysis
- 12.1.12 Northrop Grumman Corporation
- 12.1.12.1. Company Overview
- 12.1.12.2. Products
- 12.1.12.3. Company Financials
- 12.1.12.4. SWOT Analysis
- 12.1.13 Indian Space Research Organisation (ISRO)
- 12.1.13.1. Company Overview
- 12.1.13.2. Products
- 12.1.13.3. Company Financials
- 12.1.13.4. SWOT Analysis
- 12.1.14 IHI Corporation
- 12.1.14.1. Company Overview
- 12.1.14.2. Products
- 12.1.14.3. Company Financials
- 12.1.14.4. SWOT Analysis
- 12.1.15 Spire Global Inc
- 12.1.15.1. Company Overview
- 12.1.15.2. Products
- 12.1.15.3. Company Financials
- 12.1.15.4. SWOT Analysis
- 12.1.1 GomSpaceApS
- 12.2. Market Entropy
- 12.2.1 Company's Key Areas Served
- 12.2.2 Recent Developments
- 12.3. Company Market Share Analysis 2025
- 12.3.1 Top 5 Companies Market Share Analysis
- 12.3.2 Top 3 Companies Market Share Analysis
- 12.4. List of Potential Customers
- 13. Research Methodology
List of Figures
- Figure 1: Global Remote Sensing Technology Market Revenue Breakdown (billion, %) by Region 2025 & 2033
- Figure 2: North America Remote Sensing Technology Market Revenue (billion), by Satellite Mass 2025 & 2033
- Figure 3: North America Remote Sensing Technology Market Revenue Share (%), by Satellite Mass 2025 & 2033
- Figure 4: North America Remote Sensing Technology Market Revenue (billion), by Orbit Class 2025 & 2033
- Figure 5: North America Remote Sensing Technology Market Revenue Share (%), by Orbit Class 2025 & 2033
- Figure 6: North America Remote Sensing Technology Market Revenue (billion), by Satellite Subsystem 2025 & 2033
- Figure 7: North America Remote Sensing Technology Market Revenue Share (%), by Satellite Subsystem 2025 & 2033
- Figure 8: North America Remote Sensing Technology Market Revenue (billion), by End User 2025 & 2033
- Figure 9: North America Remote Sensing Technology Market Revenue Share (%), by End User 2025 & 2033
- Figure 10: North America Remote Sensing Technology Market Revenue (billion), by Country 2025 & 2033
- Figure 11: North America Remote Sensing Technology Market Revenue Share (%), by Country 2025 & 2033
- Figure 12: South America Remote Sensing Technology Market Revenue (billion), by Satellite Mass 2025 & 2033
- Figure 13: South America Remote Sensing Technology Market Revenue Share (%), by Satellite Mass 2025 & 2033
- Figure 14: South America Remote Sensing Technology Market Revenue (billion), by Orbit Class 2025 & 2033
- Figure 15: South America Remote Sensing Technology Market Revenue Share (%), by Orbit Class 2025 & 2033
- Figure 16: South America Remote Sensing Technology Market Revenue (billion), by Satellite Subsystem 2025 & 2033
- Figure 17: South America Remote Sensing Technology Market Revenue Share (%), by Satellite Subsystem 2025 & 2033
- Figure 18: South America Remote Sensing Technology Market Revenue (billion), by End User 2025 & 2033
- Figure 19: South America Remote Sensing Technology Market Revenue Share (%), by End User 2025 & 2033
- Figure 20: South America Remote Sensing Technology Market Revenue (billion), by Country 2025 & 2033
- Figure 21: South America Remote Sensing Technology Market Revenue Share (%), by Country 2025 & 2033
- Figure 22: Europe Remote Sensing Technology Market Revenue (billion), by Satellite Mass 2025 & 2033
- Figure 23: Europe Remote Sensing Technology Market Revenue Share (%), by Satellite Mass 2025 & 2033
- Figure 24: Europe Remote Sensing Technology Market Revenue (billion), by Orbit Class 2025 & 2033
- Figure 25: Europe Remote Sensing Technology Market Revenue Share (%), by Orbit Class 2025 & 2033
- Figure 26: Europe Remote Sensing Technology Market Revenue (billion), by Satellite Subsystem 2025 & 2033
- Figure 27: Europe Remote Sensing Technology Market Revenue Share (%), by Satellite Subsystem 2025 & 2033
- Figure 28: Europe Remote Sensing Technology Market Revenue (billion), by End User 2025 & 2033
- Figure 29: Europe Remote Sensing Technology Market Revenue Share (%), by End User 2025 & 2033
- Figure 30: Europe Remote Sensing Technology Market Revenue (billion), by Country 2025 & 2033
- Figure 31: Europe Remote Sensing Technology Market Revenue Share (%), by Country 2025 & 2033
- Figure 32: Middle East & Africa Remote Sensing Technology Market Revenue (billion), by Satellite Mass 2025 & 2033
- Figure 33: Middle East & Africa Remote Sensing Technology Market Revenue Share (%), by Satellite Mass 2025 & 2033
- Figure 34: Middle East & Africa Remote Sensing Technology Market Revenue (billion), by Orbit Class 2025 & 2033
- Figure 35: Middle East & Africa Remote Sensing Technology Market Revenue Share (%), by Orbit Class 2025 & 2033
- Figure 36: Middle East & Africa Remote Sensing Technology Market Revenue (billion), by Satellite Subsystem 2025 & 2033
- Figure 37: Middle East & Africa Remote Sensing Technology Market Revenue Share (%), by Satellite Subsystem 2025 & 2033
- Figure 38: Middle East & Africa Remote Sensing Technology Market Revenue (billion), by End User 2025 & 2033
- Figure 39: Middle East & Africa Remote Sensing Technology Market Revenue Share (%), by End User 2025 & 2033
- Figure 40: Middle East & Africa Remote Sensing Technology Market Revenue (billion), by Country 2025 & 2033
- Figure 41: Middle East & Africa Remote Sensing Technology Market Revenue Share (%), by Country 2025 & 2033
- Figure 42: Asia Pacific Remote Sensing Technology Market Revenue (billion), by Satellite Mass 2025 & 2033
- Figure 43: Asia Pacific Remote Sensing Technology Market Revenue Share (%), by Satellite Mass 2025 & 2033
- Figure 44: Asia Pacific Remote Sensing Technology Market Revenue (billion), by Orbit Class 2025 & 2033
- Figure 45: Asia Pacific Remote Sensing Technology Market Revenue Share (%), by Orbit Class 2025 & 2033
- Figure 46: Asia Pacific Remote Sensing Technology Market Revenue (billion), by Satellite Subsystem 2025 & 2033
- Figure 47: Asia Pacific Remote Sensing Technology Market Revenue Share (%), by Satellite Subsystem 2025 & 2033
- Figure 48: Asia Pacific Remote Sensing Technology Market Revenue (billion), by End User 2025 & 2033
- Figure 49: Asia Pacific Remote Sensing Technology Market Revenue Share (%), by End User 2025 & 2033
- Figure 50: Asia Pacific Remote Sensing Technology Market Revenue (billion), by Country 2025 & 2033
- Figure 51: Asia Pacific Remote Sensing Technology Market Revenue Share (%), by Country 2025 & 2033
List of Tables
- Table 1: Global Remote Sensing Technology Market Revenue billion Forecast, by Satellite Mass 2020 & 2033
- Table 2: Global Remote Sensing Technology Market Revenue billion Forecast, by Orbit Class 2020 & 2033
- Table 3: Global Remote Sensing Technology Market Revenue billion Forecast, by Satellite Subsystem 2020 & 2033
- Table 4: Global Remote Sensing Technology Market Revenue billion Forecast, by End User 2020 & 2033
- Table 5: Global Remote Sensing Technology Market Revenue billion Forecast, by Region 2020 & 2033
- Table 6: Global Remote Sensing Technology Market Revenue billion Forecast, by Satellite Mass 2020 & 2033
- Table 7: Global Remote Sensing Technology Market Revenue billion Forecast, by Orbit Class 2020 & 2033
- Table 8: Global Remote Sensing Technology Market Revenue billion Forecast, by Satellite Subsystem 2020 & 2033
- Table 9: Global Remote Sensing Technology Market Revenue billion Forecast, by End User 2020 & 2033
- Table 10: Global Remote Sensing Technology Market Revenue billion Forecast, by Country 2020 & 2033
- Table 11: United States Remote Sensing Technology Market Revenue (billion) Forecast, by Application 2020 & 2033
- Table 12: Canada Remote Sensing Technology Market Revenue (billion) Forecast, by Application 2020 & 2033
- Table 13: Mexico Remote Sensing Technology Market Revenue (billion) Forecast, by Application 2020 & 2033
- Table 14: Global Remote Sensing Technology Market Revenue billion Forecast, by Satellite Mass 2020 & 2033
- Table 15: Global Remote Sensing Technology Market Revenue billion Forecast, by Orbit Class 2020 & 2033
- Table 16: Global Remote Sensing Technology Market Revenue billion Forecast, by Satellite Subsystem 2020 & 2033
- Table 17: Global Remote Sensing Technology Market Revenue billion Forecast, by End User 2020 & 2033
- Table 18: Global Remote Sensing Technology Market Revenue billion Forecast, by Country 2020 & 2033
- Table 19: Brazil Remote Sensing Technology Market Revenue (billion) Forecast, by Application 2020 & 2033
- Table 20: Argentina Remote Sensing Technology Market Revenue (billion) Forecast, by Application 2020 & 2033
- Table 21: Rest of South America Remote Sensing Technology Market Revenue (billion) Forecast, by Application 2020 & 2033
- Table 22: Global Remote Sensing Technology Market Revenue billion Forecast, by Satellite Mass 2020 & 2033
- Table 23: Global Remote Sensing Technology Market Revenue billion Forecast, by Orbit Class 2020 & 2033
- Table 24: Global Remote Sensing Technology Market Revenue billion Forecast, by Satellite Subsystem 2020 & 2033
- Table 25: Global Remote Sensing Technology Market Revenue billion Forecast, by End User 2020 & 2033
- Table 26: Global Remote Sensing Technology Market Revenue billion Forecast, by Country 2020 & 2033
- Table 27: United Kingdom Remote Sensing Technology Market Revenue (billion) Forecast, by Application 2020 & 2033
- Table 28: Germany Remote Sensing Technology Market Revenue (billion) Forecast, by Application 2020 & 2033
- Table 29: France Remote Sensing Technology Market Revenue (billion) Forecast, by Application 2020 & 2033
- Table 30: Italy Remote Sensing Technology Market Revenue (billion) Forecast, by Application 2020 & 2033
- Table 31: Spain Remote Sensing Technology Market Revenue (billion) Forecast, by Application 2020 & 2033
- Table 32: Russia Remote Sensing Technology Market Revenue (billion) Forecast, by Application 2020 & 2033
- Table 33: Benelux Remote Sensing Technology Market Revenue (billion) Forecast, by Application 2020 & 2033
- Table 34: Nordics Remote Sensing Technology Market Revenue (billion) Forecast, by Application 2020 & 2033
- Table 35: Rest of Europe Remote Sensing Technology Market Revenue (billion) Forecast, by Application 2020 & 2033
- Table 36: Global Remote Sensing Technology Market Revenue billion Forecast, by Satellite Mass 2020 & 2033
- Table 37: Global Remote Sensing Technology Market Revenue billion Forecast, by Orbit Class 2020 & 2033
- Table 38: Global Remote Sensing Technology Market Revenue billion Forecast, by Satellite Subsystem 2020 & 2033
- Table 39: Global Remote Sensing Technology Market Revenue billion Forecast, by End User 2020 & 2033
- Table 40: Global Remote Sensing Technology Market Revenue billion Forecast, by Country 2020 & 2033
- Table 41: Turkey Remote Sensing Technology Market Revenue (billion) Forecast, by Application 2020 & 2033
- Table 42: Israel Remote Sensing Technology Market Revenue (billion) Forecast, by Application 2020 & 2033
- Table 43: GCC Remote Sensing Technology Market Revenue (billion) Forecast, by Application 2020 & 2033
- Table 44: North Africa Remote Sensing Technology Market Revenue (billion) Forecast, by Application 2020 & 2033
- Table 45: South Africa Remote Sensing Technology Market Revenue (billion) Forecast, by Application 2020 & 2033
- Table 46: Rest of Middle East & Africa Remote Sensing Technology Market Revenue (billion) Forecast, by Application 2020 & 2033
- Table 47: Global Remote Sensing Technology Market Revenue billion Forecast, by Satellite Mass 2020 & 2033
- Table 48: Global Remote Sensing Technology Market Revenue billion Forecast, by Orbit Class 2020 & 2033
- Table 49: Global Remote Sensing Technology Market Revenue billion Forecast, by Satellite Subsystem 2020 & 2033
- Table 50: Global Remote Sensing Technology Market Revenue billion Forecast, by End User 2020 & 2033
- Table 51: Global Remote Sensing Technology Market Revenue billion Forecast, by Country 2020 & 2033
- Table 52: China Remote Sensing Technology Market Revenue (billion) Forecast, by Application 2020 & 2033
- Table 53: India Remote Sensing Technology Market Revenue (billion) Forecast, by Application 2020 & 2033
- Table 54: Japan Remote Sensing Technology Market Revenue (billion) Forecast, by Application 2020 & 2033
- Table 55: South Korea Remote Sensing Technology Market Revenue (billion) Forecast, by Application 2020 & 2033
- Table 56: ASEAN Remote Sensing Technology Market Revenue (billion) Forecast, by Application 2020 & 2033
- Table 57: Oceania Remote Sensing Technology Market Revenue (billion) Forecast, by Application 2020 & 2033
- Table 58: Rest of Asia Pacific Remote Sensing Technology Market Revenue (billion) Forecast, by Application 2020 & 2033
Frequently Asked Questions
1. What is the projected Compound Annual Growth Rate (CAGR) of the Remote Sensing Technology Market?
The projected CAGR is approximately 11.59%.
2. Which companies are prominent players in the Remote Sensing Technology Market?
Key companies in the market include GomSpaceApS, ESRI, Lockheed Martin Corporation, Airbus SE, Ball Corporation, Japan Aerospace Exploration Agency (JAXA), China Aerospace Science and Technology Corporation (CASC), Maxar Technologies Inc, ROSCOSMOS, Thale, Planet Labs Inc, Northrop Grumman Corporation, Indian Space Research Organisation (ISRO), IHI Corporation, Spire Global Inc.
3. What are the main segments of the Remote Sensing Technology Market?
The market segments include Satellite Mass, Orbit Class, Satellite Subsystem, End User.
4. Can you provide details about the market size?
The market size is estimated to be USD 25.37 billion as of 2022.
5. What are some drivers contributing to market growth?
N/A
6. What are the notable trends driving market growth?
OTHER KEY INDUSTRY TRENDS COVERED IN THE REPORT.
7. Are there any restraints impacting market growth?
N/A
8. Can you provide examples of recent developments in the market?
March 2023: The Japan Aerospace Exploration Agency (JAXA) had scheduled the launch of the first H3 Launch Vehicle with the Advanced Land Observing Satellite "Daichi 3" (ALOS-3) onboard from the Tanegashima Space Center.February 2023: NASA and geographic information service provider Esri will grant wider access to the space agency's geospatial content for research and exploration purposes through the Space Act Agreement.January 2023: Airbus Defence and Space has signed a contract with Poland to provide a geospatial intelligence system including the development, manufacture, launch and delivery in orbit of two high-performance optical Earth observation satellites.
9. What pricing options are available for accessing the report?
Pricing options include single-user, multi-user, and enterprise licenses priced at USD 3800, USD 4500, and USD 5800 respectively.
10. Is the market size provided in terms of value or volume?
The market size is provided in terms of value, measured in billion.
11. Are there any specific market keywords associated with the report?
Yes, the market keyword associated with the report is "Remote Sensing Technology Market," which aids in identifying and referencing the specific market segment covered.
12. How do I determine which pricing option suits my needs best?
The pricing options vary based on user requirements and access needs. Individual users may opt for single-user licenses, while businesses requiring broader access may choose multi-user or enterprise licenses for cost-effective access to the report.
13. Are there any additional resources or data provided in the Remote Sensing Technology Market report?
While the report offers comprehensive insights, it's advisable to review the specific contents or supplementary materials provided to ascertain if additional resources or data are available.
14. How can I stay updated on further developments or reports in the Remote Sensing Technology Market?
To stay informed about further developments, trends, and reports in the Remote Sensing Technology Market, consider subscribing to industry newsletters, following relevant companies and organizations, or regularly checking reputable industry news sources and publications.
Methodology
Step 1 - Identification of Relevant Samples Size from Population Database


Step 2 - Approaches for Defining Global Market Size (Value, Volume* & Price*)

Note*: In applicable scenarios
Step 3 - Data Sources
Primary Research
- Web Analytics
- Survey Reports
- Research Institute
- Latest Research Reports
- Opinion Leaders
Secondary Research
- Annual Reports
- White Paper
- Latest Press Release
- Industry Association
- Paid Database
- Investor Presentations

Step 4 - Data Triangulation
Involves using different sources of information in order to increase the validity of a study
These sources are likely to be stakeholders in a program - participants, other researchers, program staff, other community members, and so on.
Then we put all data in single framework & apply various statistical tools to find out the dynamic on the market.
During the analysis stage, feedback from the stakeholder groups would be compared to determine areas of agreement as well as areas of divergence