

Key Insights
The Oil & Gas Digital Transformation market is experiencing robust growth, driven by the industry's imperative for enhanced operational efficiency, safety, and profitability. The market, projected for significant expansion, is forecasted to reach 90.44 billion by 2033, with a compelling Compound Annual Growth Rate (CAGR) of 17% from the 2025 base year. Key drivers include the pervasive adoption of advanced technologies such as Big Data analytics, cloud computing, and the Internet of Things (IoT) for process optimization and cost reduction. Furthermore, escalating demands for stringent safety protocols and environmental sustainability are accelerating the integration of digital solutions for predictive maintenance, leak detection, and emissions monitoring. The increasing complexity of oil and gas operations also necessitates sophisticated digital tools for real-time data analysis and informed decision-making. The upstream segment, encompassing exploration and production, is a primary contributor to market expansion, followed by midstream (transportation and storage) and downstream (refining and marketing) operations. Leading industry players are actively investing in research and development and forging strategic partnerships to fortify their market standing.
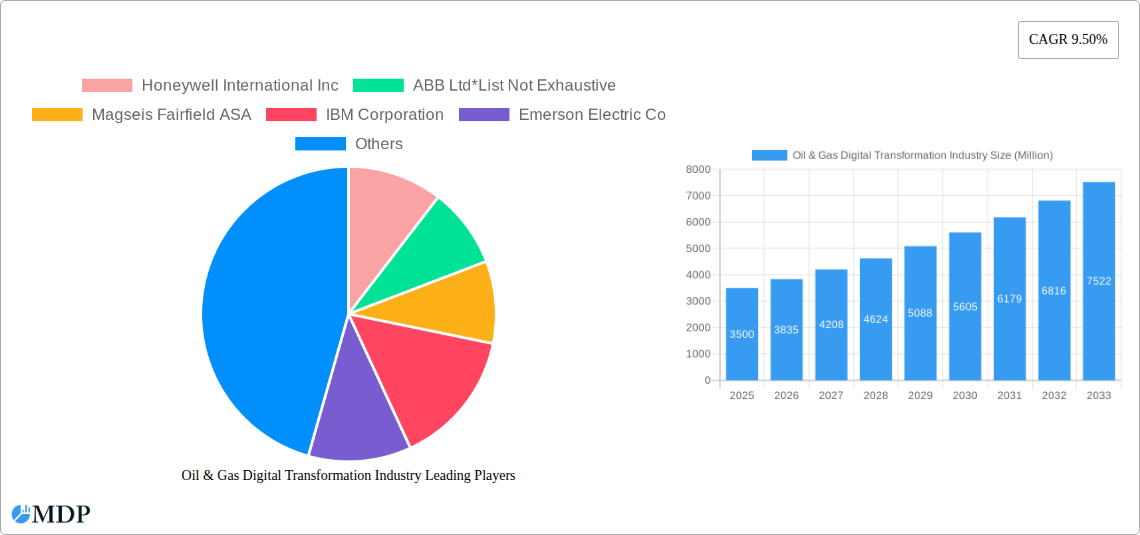
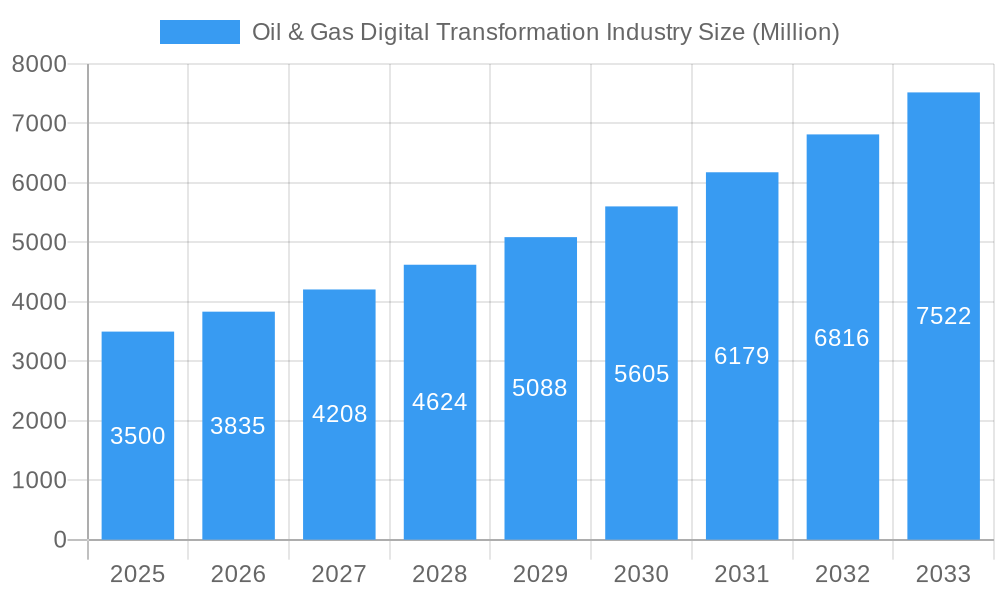
Oil & Gas Digital Transformation Industry Market Size (In Billion)
Geographically, North America is anticipated to maintain a dominant market share, bolstered by substantial investments in digital infrastructure and the presence of major oil and gas enterprises. The Asia-Pacific region, particularly China and India, is poised for rapid growth, fueled by increasing exploration activities and supportive government digitalization initiatives. However, significant initial investment costs for digital transformation and ongoing cybersecurity concerns present potential market restraints. The successful implementation of these technologies critically depends on a skilled workforce and robust data management strategies. Continuous technological advancements in Artificial Intelligence (AI), Extended Reality (XR), and sophisticated field devices will further propel market growth, unlocking new opportunities for efficiency gains and innovation across the industry.
Oil & Gas Digital Transformation Industry Company Market Share
Oil & Gas Digital Transformation Market: Strategic Insights and Future Outlook (2025-2033)
This comprehensive report delivers an in-depth analysis of the Oil & Gas Digital Transformation sector, exploring market dynamics, key players, technological evolution, and future growth trajectories. With a study period focusing on the 2025 base year and a forecast period extending to 2033, this report serves as an indispensable resource for industry stakeholders, investors, and strategic decision-makers. Leveraging extensive market research and historical data, the report provides actionable insights and reliable projections. The total market size is estimated at 90.44 billion for 2025, with a projected expansion to significant figures by 2033, driven by a strong 17% CAGR.
Oil & Gas Digital Transformation Industry Market Dynamics & Concentration
The Oil & Gas Digital Transformation market exhibits a moderately concentrated landscape, with a few major players holding significant market share. Innovation, driven by the need for enhanced efficiency, safety, and sustainability, is a key growth driver. Stringent regulatory frameworks, aimed at improving environmental performance and operational safety, significantly influence industry practices. The market sees substantial M&A activity, reflecting consolidation and expansion strategies among major players. Product substitutes, including alternative energy sources, pose a long-term challenge. End-user trends favor technologically advanced, integrated solutions, which provide comprehensive data analytics and operational insights.
- Market Share: Top 5 players hold an estimated xx% market share in 2025.
- M&A Activity: Over xx M&A deals were recorded between 2019 and 2024, with an average deal value of xx Million.
- Key Innovation Drivers: Improved safety, enhanced efficiency, reduced operational costs, and environmental sustainability.
- Regulatory Influence: Government regulations regarding emissions, safety, and data security significantly impact market growth and technology adoption.
Oil & Gas Digital Transformation Industry Industry Trends & Analysis
The Oil & Gas Digital Transformation market is experiencing robust growth, driven by several factors. The increasing adoption of advanced technologies, such as AI, IoT, and cloud computing, is revolutionizing operational efficiency. Consumer preference shifts towards sustainable practices are pushing companies to embrace digital solutions for environmental compliance. The competitive landscape is characterized by intense innovation and strategic partnerships, leading to rapid technological advancement. This dynamic market is projected to achieve a CAGR of xx% during the forecast period (2025-2033), with market penetration expected to reach xx% by 2033.
Leading Markets & Segments in Oil & Gas Digital Transformation Industry
The Upstream segment dominates the Oil & Gas Digital Transformation market, driven by the need for enhanced drilling efficiency and reservoir management. North America and Europe are currently the leading regions due to their established oil and gas infrastructure and significant investments in digital technologies. Among enabling technologies, Big Data/Analytics and Cloud Computing is currently the largest segment, followed by the Internet of Things (IoT).
- Key Drivers (Upstream): Increased automation, enhanced data analytics for reservoir management, optimized drilling operations.
- Key Drivers (North America): Strong government support, large-scale oil and gas operations, significant investment in digital infrastructure.
- Key Drivers (Europe): Focus on environmental sustainability, strong regulatory framework promoting technological advancements.
- Dominant Enabling Technology: Big Data/Analytics and Cloud Computing, providing significant operational and financial benefits.
Oil & Gas Digital Transformation Industry Product Developments
Recent product innovations focus on integrated platforms that combine data analytics, IoT, and AI for real-time operational insights. These solutions offer enhanced safety, optimized resource allocation, and improved decision-making. The competitive advantage lies in providing comprehensive, user-friendly solutions that seamlessly integrate with existing infrastructure, minimizing disruption and maximizing return on investment. The market is moving towards cloud-based, scalable solutions to meet the growing demand for data storage and processing capabilities.
Key Drivers of Oil & Gas Digital Transformation Industry Growth
Several key factors drive market growth, including technological advancements (AI, IoT, Cloud), government initiatives promoting digitalization, and the need to reduce operational costs and improve safety. The increasing focus on environmental sustainability, with stringent emission regulations, further fuels the adoption of digital solutions for optimized energy efficiency and reduced environmental footprint. Economic incentives, such as tax breaks for technology adoption, encourage further growth.
Challenges in the Oil & Gas Digital Transformation Industry Market
The Oil & Gas Digital Transformation market faces several challenges. High initial investment costs for implementing new technologies can be a significant barrier for smaller companies. Concerns regarding cybersecurity and data privacy pose significant risks. Integration challenges with legacy systems and skills gaps within the workforce can hinder effective implementation. The market also faces challenges associated with unreliable internet connectivity in remote operational areas. These factors combined can result in estimated xx Million in lost revenue annually.
Emerging Opportunities in Oil & Gas Digital Transformation Industry
The market presents significant long-term growth opportunities. Advancements in AI and Machine Learning (ML) promise further optimization and automation. Strategic partnerships between oil and gas companies and technology providers will accelerate innovation. Expanding into emerging markets with significant untapped potential will further drive market growth. The growing focus on carbon capture, utilization, and storage (CCUS) will require significant digitalization investment, creating lucrative opportunities.
Leading Players in the Oil & Gas Digital Transformation Industry Sector
- Honeywell International Inc
- ABB Ltd
- Magseis Fairfield ASA
- IBM Corporation
- Emerson Electric Co
- Mitsubishi Electric Corporation
- Siemens AG
- Schneider Electric SE
- WFS Technologies Ltd
- Fanuc Corporation
- Omron Corporation
- Rockwell Automation Inc
- Rohrback Cosasco Systems Inc
- Yokogawa Electric Corporation
Key Milestones in Oil & Gas Digital Transformation Industry Industry
- October 2021: Emerson announced a multi-year agreement with BayoTech to accelerate hydrogen delivery globally, showcasing the role of automation in alternative energy.
- March 2022: Kyndryl's USD 160 Million agreement with Motiva Enterprises highlights the significant investment in IT infrastructure modernization within the oil and gas sector, driving large-scale digital transformation.
Strategic Outlook for Oil & Gas Digital Transformation Industry Market
The Oil & Gas Digital Transformation market is poised for continued expansion, driven by technological innovation and the increasing need for operational efficiency and sustainability. Strategic partnerships, targeted investments in emerging technologies, and expansion into new geographical markets will be crucial for sustained growth. The long-term outlook is positive, with the market expected to witness substantial growth over the next decade, presenting attractive opportunities for both established players and new entrants.
Oil & Gas Digital Transformation Industry Segmentation
-
1. Enabling Technologies
- 1.1. Big Data/Analytics and Cloud Computing
- 1.2. Internet of Things (IoT)
- 1.3. Artificial Intelligence
- 1.4. Industri
- 1.5. Extended Reality (AR, VR and MR)
- 1.6. Field Devices (Sensors, Motors, VFD etc.)
-
2. Oil and Gas Industry Activity
- 2.1. Upstream
- 2.2. Mid Stream
- 2.3. Downstream
Oil & Gas Digital Transformation Industry Segmentation By Geography
-
1. North America
- 1.1. United States
- 1.2. Canada
-
2. Europe
- 2.1. Germany
- 2.2. United Kingdom
- 2.3. France
- 2.4. Rest of Europe
-
3. Asia Pacific
- 3.1. China
- 3.2. Japan
- 3.3. India
- 3.4. Rest of the Asia Pacific
-
4. Latin America
- 4.1. Brazil
- 4.2. Argentina
- 4.3. Rest of Latin America
-
5. Middle East and Africa
- 5.1. United Arab Emirates
- 5.2. Saudi Arabia
- 5.3. Rest of Middle East and Africa
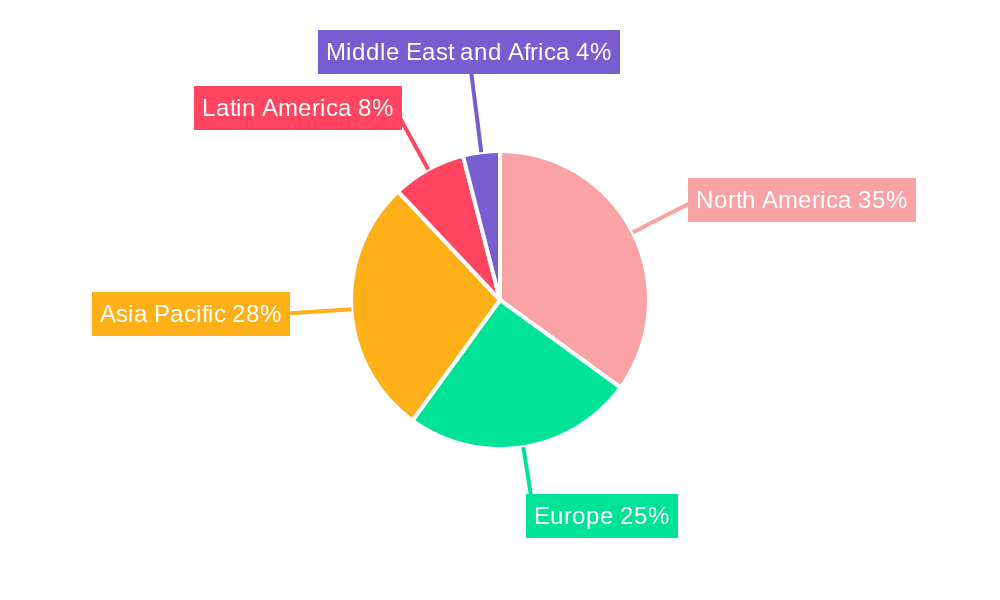
Oil & Gas Digital Transformation Industry Regional Market Share
Geographic Coverage of Oil & Gas Digital Transformation Industry
Oil & Gas Digital Transformation Industry REPORT HIGHLIGHTS
| Aspects | Details |
|---|---|
| Study Period | 2020-2034 |
| Base Year | 2025 |
| Estimated Year | 2026 |
| Forecast Period | 2026-2034 |
| Historical Period | 2020-2025 |
| Growth Rate | CAGR of 17% from 2020-2034 |
| Segmentation |
|
Table of Contents
- 1. Introduction
- 1.1. Research Scope
- 1.2. Market Segmentation
- 1.3. Research Methodology
- 1.4. Definitions and Assumptions
- 2. Executive Summary
- 2.1. Introduction
- 3. Market Dynamics
- 3.1. Introduction
- 3.2. Market Drivers
- 3.2.1. Increasing Need to Implement Disruptive Technologies to Optimize Operations & Increase Safety; Regulatory Requirements
- 3.3. Market Restrains
- 3.3.1. ; Trade Tensions and Implementation Challenges
- 3.4. Market Trends
- 3.4.1. Downstream Sector is Expected to Witness Major Market Share
- 4. Market Factor Analysis
- 4.1. Porters Five Forces
- 4.2. Supply/Value Chain
- 4.3. PESTEL analysis
- 4.4. Market Entropy
- 4.5. Patent/Trademark Analysis
- 5. Global Oil & Gas Digital Transformation Industry Analysis, Insights and Forecast, 2020-2032
- 5.1. Market Analysis, Insights and Forecast - by Enabling Technologies
- 5.1.1. Big Data/Analytics and Cloud Computing
- 5.1.2. Internet of Things (IoT)
- 5.1.3. Artificial Intelligence
- 5.1.4. Industri
- 5.1.5. Extended Reality (AR, VR and MR)
- 5.1.6. Field Devices (Sensors, Motors, VFD etc.)
- 5.2. Market Analysis, Insights and Forecast - by Oil and Gas Industry Activity
- 5.2.1. Upstream
- 5.2.2. Mid Stream
- 5.2.3. Downstream
- 5.3. Market Analysis, Insights and Forecast - by Region
- 5.3.1. North America
- 5.3.2. Europe
- 5.3.3. Asia Pacific
- 5.3.4. Latin America
- 5.3.5. Middle East and Africa
- 5.1. Market Analysis, Insights and Forecast - by Enabling Technologies
- 6. North America Oil & Gas Digital Transformation Industry Analysis, Insights and Forecast, 2020-2032
- 6.1. Market Analysis, Insights and Forecast - by Enabling Technologies
- 6.1.1. Big Data/Analytics and Cloud Computing
- 6.1.2. Internet of Things (IoT)
- 6.1.3. Artificial Intelligence
- 6.1.4. Industri
- 6.1.5. Extended Reality (AR, VR and MR)
- 6.1.6. Field Devices (Sensors, Motors, VFD etc.)
- 6.2. Market Analysis, Insights and Forecast - by Oil and Gas Industry Activity
- 6.2.1. Upstream
- 6.2.2. Mid Stream
- 6.2.3. Downstream
- 6.1. Market Analysis, Insights and Forecast - by Enabling Technologies
- 7. Europe Oil & Gas Digital Transformation Industry Analysis, Insights and Forecast, 2020-2032
- 7.1. Market Analysis, Insights and Forecast - by Enabling Technologies
- 7.1.1. Big Data/Analytics and Cloud Computing
- 7.1.2. Internet of Things (IoT)
- 7.1.3. Artificial Intelligence
- 7.1.4. Industri
- 7.1.5. Extended Reality (AR, VR and MR)
- 7.1.6. Field Devices (Sensors, Motors, VFD etc.)
- 7.2. Market Analysis, Insights and Forecast - by Oil and Gas Industry Activity
- 7.2.1. Upstream
- 7.2.2. Mid Stream
- 7.2.3. Downstream
- 7.1. Market Analysis, Insights and Forecast - by Enabling Technologies
- 8. Asia Pacific Oil & Gas Digital Transformation Industry Analysis, Insights and Forecast, 2020-2032
- 8.1. Market Analysis, Insights and Forecast - by Enabling Technologies
- 8.1.1. Big Data/Analytics and Cloud Computing
- 8.1.2. Internet of Things (IoT)
- 8.1.3. Artificial Intelligence
- 8.1.4. Industri
- 8.1.5. Extended Reality (AR, VR and MR)
- 8.1.6. Field Devices (Sensors, Motors, VFD etc.)
- 8.2. Market Analysis, Insights and Forecast - by Oil and Gas Industry Activity
- 8.2.1. Upstream
- 8.2.2. Mid Stream
- 8.2.3. Downstream
- 8.1. Market Analysis, Insights and Forecast - by Enabling Technologies
- 9. Latin America Oil & Gas Digital Transformation Industry Analysis, Insights and Forecast, 2020-2032
- 9.1. Market Analysis, Insights and Forecast - by Enabling Technologies
- 9.1.1. Big Data/Analytics and Cloud Computing
- 9.1.2. Internet of Things (IoT)
- 9.1.3. Artificial Intelligence
- 9.1.4. Industri
- 9.1.5. Extended Reality (AR, VR and MR)
- 9.1.6. Field Devices (Sensors, Motors, VFD etc.)
- 9.2. Market Analysis, Insights and Forecast - by Oil and Gas Industry Activity
- 9.2.1. Upstream
- 9.2.2. Mid Stream
- 9.2.3. Downstream
- 9.1. Market Analysis, Insights and Forecast - by Enabling Technologies
- 10. Middle East and Africa Oil & Gas Digital Transformation Industry Analysis, Insights and Forecast, 2020-2032
- 10.1. Market Analysis, Insights and Forecast - by Enabling Technologies
- 10.1.1. Big Data/Analytics and Cloud Computing
- 10.1.2. Internet of Things (IoT)
- 10.1.3. Artificial Intelligence
- 10.1.4. Industri
- 10.1.5. Extended Reality (AR, VR and MR)
- 10.1.6. Field Devices (Sensors, Motors, VFD etc.)
- 10.2. Market Analysis, Insights and Forecast - by Oil and Gas Industry Activity
- 10.2.1. Upstream
- 10.2.2. Mid Stream
- 10.2.3. Downstream
- 10.1. Market Analysis, Insights and Forecast - by Enabling Technologies
- 11. Competitive Analysis
- 11.1. Global Market Share Analysis 2025
- 11.2. Company Profiles
- 11.2.1 Honeywell International Inc
- 11.2.1.1. Overview
- 11.2.1.2. Products
- 11.2.1.3. SWOT Analysis
- 11.2.1.4. Recent Developments
- 11.2.1.5. Financials (Based on Availability)
- 11.2.2 ABB Ltd*List Not Exhaustive
- 11.2.2.1. Overview
- 11.2.2.2. Products
- 11.2.2.3. SWOT Analysis
- 11.2.2.4. Recent Developments
- 11.2.2.5. Financials (Based on Availability)
- 11.2.3 Magseis Fairfield ASA
- 11.2.3.1. Overview
- 11.2.3.2. Products
- 11.2.3.3. SWOT Analysis
- 11.2.3.4. Recent Developments
- 11.2.3.5. Financials (Based on Availability)
- 11.2.4 IBM Corporation
- 11.2.4.1. Overview
- 11.2.4.2. Products
- 11.2.4.3. SWOT Analysis
- 11.2.4.4. Recent Developments
- 11.2.4.5. Financials (Based on Availability)
- 11.2.5 Emerson Electric Co
- 11.2.5.1. Overview
- 11.2.5.2. Products
- 11.2.5.3. SWOT Analysis
- 11.2.5.4. Recent Developments
- 11.2.5.5. Financials (Based on Availability)
- 11.2.6 Mitsubishi Electric Corporation
- 11.2.6.1. Overview
- 11.2.6.2. Products
- 11.2.6.3. SWOT Analysis
- 11.2.6.4. Recent Developments
- 11.2.6.5. Financials (Based on Availability)
- 11.2.7 Siemens AG
- 11.2.7.1. Overview
- 11.2.7.2. Products
- 11.2.7.3. SWOT Analysis
- 11.2.7.4. Recent Developments
- 11.2.7.5. Financials (Based on Availability)
- 11.2.8 Schneider Electric SE
- 11.2.8.1. Overview
- 11.2.8.2. Products
- 11.2.8.3. SWOT Analysis
- 11.2.8.4. Recent Developments
- 11.2.8.5. Financials (Based on Availability)
- 11.2.9 WFS Technologies Ltd
- 11.2.9.1. Overview
- 11.2.9.2. Products
- 11.2.9.3. SWOT Analysis
- 11.2.9.4. Recent Developments
- 11.2.9.5. Financials (Based on Availability)
- 11.2.10 Fanuc Corporation
- 11.2.10.1. Overview
- 11.2.10.2. Products
- 11.2.10.3. SWOT Analysis
- 11.2.10.4. Recent Developments
- 11.2.10.5. Financials (Based on Availability)
- 11.2.11 Omron Corporation
- 11.2.11.1. Overview
- 11.2.11.2. Products
- 11.2.11.3. SWOT Analysis
- 11.2.11.4. Recent Developments
- 11.2.11.5. Financials (Based on Availability)
- 11.2.12 Rockwell Automation Inc
- 11.2.12.1. Overview
- 11.2.12.2. Products
- 11.2.12.3. SWOT Analysis
- 11.2.12.4. Recent Developments
- 11.2.12.5. Financials (Based on Availability)
- 11.2.13 Rohrback Cosasco Systems Inc
- 11.2.13.1. Overview
- 11.2.13.2. Products
- 11.2.13.3. SWOT Analysis
- 11.2.13.4. Recent Developments
- 11.2.13.5. Financials (Based on Availability)
- 11.2.14 Yokogawa Electric Corporation
- 11.2.14.1. Overview
- 11.2.14.2. Products
- 11.2.14.3. SWOT Analysis
- 11.2.14.4. Recent Developments
- 11.2.14.5. Financials (Based on Availability)
- 11.2.1 Honeywell International Inc
List of Figures
- Figure 1: Global Oil & Gas Digital Transformation Industry Revenue Breakdown (billion, %) by Region 2025 & 2033
- Figure 2: North America Oil & Gas Digital Transformation Industry Revenue (billion), by Enabling Technologies 2025 & 2033
- Figure 3: North America Oil & Gas Digital Transformation Industry Revenue Share (%), by Enabling Technologies 2025 & 2033
- Figure 4: North America Oil & Gas Digital Transformation Industry Revenue (billion), by Oil and Gas Industry Activity 2025 & 2033
- Figure 5: North America Oil & Gas Digital Transformation Industry Revenue Share (%), by Oil and Gas Industry Activity 2025 & 2033
- Figure 6: North America Oil & Gas Digital Transformation Industry Revenue (billion), by Country 2025 & 2033
- Figure 7: North America Oil & Gas Digital Transformation Industry Revenue Share (%), by Country 2025 & 2033
- Figure 8: Europe Oil & Gas Digital Transformation Industry Revenue (billion), by Enabling Technologies 2025 & 2033
- Figure 9: Europe Oil & Gas Digital Transformation Industry Revenue Share (%), by Enabling Technologies 2025 & 2033
- Figure 10: Europe Oil & Gas Digital Transformation Industry Revenue (billion), by Oil and Gas Industry Activity 2025 & 2033
- Figure 11: Europe Oil & Gas Digital Transformation Industry Revenue Share (%), by Oil and Gas Industry Activity 2025 & 2033
- Figure 12: Europe Oil & Gas Digital Transformation Industry Revenue (billion), by Country 2025 & 2033
- Figure 13: Europe Oil & Gas Digital Transformation Industry Revenue Share (%), by Country 2025 & 2033
- Figure 14: Asia Pacific Oil & Gas Digital Transformation Industry Revenue (billion), by Enabling Technologies 2025 & 2033
- Figure 15: Asia Pacific Oil & Gas Digital Transformation Industry Revenue Share (%), by Enabling Technologies 2025 & 2033
- Figure 16: Asia Pacific Oil & Gas Digital Transformation Industry Revenue (billion), by Oil and Gas Industry Activity 2025 & 2033
- Figure 17: Asia Pacific Oil & Gas Digital Transformation Industry Revenue Share (%), by Oil and Gas Industry Activity 2025 & 2033
- Figure 18: Asia Pacific Oil & Gas Digital Transformation Industry Revenue (billion), by Country 2025 & 2033
- Figure 19: Asia Pacific Oil & Gas Digital Transformation Industry Revenue Share (%), by Country 2025 & 2033
- Figure 20: Latin America Oil & Gas Digital Transformation Industry Revenue (billion), by Enabling Technologies 2025 & 2033
- Figure 21: Latin America Oil & Gas Digital Transformation Industry Revenue Share (%), by Enabling Technologies 2025 & 2033
- Figure 22: Latin America Oil & Gas Digital Transformation Industry Revenue (billion), by Oil and Gas Industry Activity 2025 & 2033
- Figure 23: Latin America Oil & Gas Digital Transformation Industry Revenue Share (%), by Oil and Gas Industry Activity 2025 & 2033
- Figure 24: Latin America Oil & Gas Digital Transformation Industry Revenue (billion), by Country 2025 & 2033
- Figure 25: Latin America Oil & Gas Digital Transformation Industry Revenue Share (%), by Country 2025 & 2033
- Figure 26: Middle East and Africa Oil & Gas Digital Transformation Industry Revenue (billion), by Enabling Technologies 2025 & 2033
- Figure 27: Middle East and Africa Oil & Gas Digital Transformation Industry Revenue Share (%), by Enabling Technologies 2025 & 2033
- Figure 28: Middle East and Africa Oil & Gas Digital Transformation Industry Revenue (billion), by Oil and Gas Industry Activity 2025 & 2033
- Figure 29: Middle East and Africa Oil & Gas Digital Transformation Industry Revenue Share (%), by Oil and Gas Industry Activity 2025 & 2033
- Figure 30: Middle East and Africa Oil & Gas Digital Transformation Industry Revenue (billion), by Country 2025 & 2033
- Figure 31: Middle East and Africa Oil & Gas Digital Transformation Industry Revenue Share (%), by Country 2025 & 2033
List of Tables
- Table 1: Global Oil & Gas Digital Transformation Industry Revenue billion Forecast, by Enabling Technologies 2020 & 2033
- Table 2: Global Oil & Gas Digital Transformation Industry Revenue billion Forecast, by Oil and Gas Industry Activity 2020 & 2033
- Table 3: Global Oil & Gas Digital Transformation Industry Revenue billion Forecast, by Region 2020 & 2033
- Table 4: Global Oil & Gas Digital Transformation Industry Revenue billion Forecast, by Enabling Technologies 2020 & 2033
- Table 5: Global Oil & Gas Digital Transformation Industry Revenue billion Forecast, by Oil and Gas Industry Activity 2020 & 2033
- Table 6: Global Oil & Gas Digital Transformation Industry Revenue billion Forecast, by Country 2020 & 2033
- Table 7: United States Oil & Gas Digital Transformation Industry Revenue (billion) Forecast, by Application 2020 & 2033
- Table 8: Canada Oil & Gas Digital Transformation Industry Revenue (billion) Forecast, by Application 2020 & 2033
- Table 9: Global Oil & Gas Digital Transformation Industry Revenue billion Forecast, by Enabling Technologies 2020 & 2033
- Table 10: Global Oil & Gas Digital Transformation Industry Revenue billion Forecast, by Oil and Gas Industry Activity 2020 & 2033
- Table 11: Global Oil & Gas Digital Transformation Industry Revenue billion Forecast, by Country 2020 & 2033
- Table 12: Germany Oil & Gas Digital Transformation Industry Revenue (billion) Forecast, by Application 2020 & 2033
- Table 13: United Kingdom Oil & Gas Digital Transformation Industry Revenue (billion) Forecast, by Application 2020 & 2033
- Table 14: France Oil & Gas Digital Transformation Industry Revenue (billion) Forecast, by Application 2020 & 2033
- Table 15: Rest of Europe Oil & Gas Digital Transformation Industry Revenue (billion) Forecast, by Application 2020 & 2033
- Table 16: Global Oil & Gas Digital Transformation Industry Revenue billion Forecast, by Enabling Technologies 2020 & 2033
- Table 17: Global Oil & Gas Digital Transformation Industry Revenue billion Forecast, by Oil and Gas Industry Activity 2020 & 2033
- Table 18: Global Oil & Gas Digital Transformation Industry Revenue billion Forecast, by Country 2020 & 2033
- Table 19: China Oil & Gas Digital Transformation Industry Revenue (billion) Forecast, by Application 2020 & 2033
- Table 20: Japan Oil & Gas Digital Transformation Industry Revenue (billion) Forecast, by Application 2020 & 2033
- Table 21: India Oil & Gas Digital Transformation Industry Revenue (billion) Forecast, by Application 2020 & 2033
- Table 22: Rest of the Asia Pacific Oil & Gas Digital Transformation Industry Revenue (billion) Forecast, by Application 2020 & 2033
- Table 23: Global Oil & Gas Digital Transformation Industry Revenue billion Forecast, by Enabling Technologies 2020 & 2033
- Table 24: Global Oil & Gas Digital Transformation Industry Revenue billion Forecast, by Oil and Gas Industry Activity 2020 & 2033
- Table 25: Global Oil & Gas Digital Transformation Industry Revenue billion Forecast, by Country 2020 & 2033
- Table 26: Brazil Oil & Gas Digital Transformation Industry Revenue (billion) Forecast, by Application 2020 & 2033
- Table 27: Argentina Oil & Gas Digital Transformation Industry Revenue (billion) Forecast, by Application 2020 & 2033
- Table 28: Rest of Latin America Oil & Gas Digital Transformation Industry Revenue (billion) Forecast, by Application 2020 & 2033
- Table 29: Global Oil & Gas Digital Transformation Industry Revenue billion Forecast, by Enabling Technologies 2020 & 2033
- Table 30: Global Oil & Gas Digital Transformation Industry Revenue billion Forecast, by Oil and Gas Industry Activity 2020 & 2033
- Table 31: Global Oil & Gas Digital Transformation Industry Revenue billion Forecast, by Country 2020 & 2033
- Table 32: United Arab Emirates Oil & Gas Digital Transformation Industry Revenue (billion) Forecast, by Application 2020 & 2033
- Table 33: Saudi Arabia Oil & Gas Digital Transformation Industry Revenue (billion) Forecast, by Application 2020 & 2033
- Table 34: Rest of Middle East and Africa Oil & Gas Digital Transformation Industry Revenue (billion) Forecast, by Application 2020 & 2033
Frequently Asked Questions
1. What is the projected Compound Annual Growth Rate (CAGR) of the Oil & Gas Digital Transformation Industry?
The projected CAGR is approximately 17%.
2. Which companies are prominent players in the Oil & Gas Digital Transformation Industry?
Key companies in the market include Honeywell International Inc, ABB Ltd*List Not Exhaustive, Magseis Fairfield ASA, IBM Corporation, Emerson Electric Co, Mitsubishi Electric Corporation, Siemens AG, Schneider Electric SE, WFS Technologies Ltd, Fanuc Corporation, Omron Corporation, Rockwell Automation Inc, Rohrback Cosasco Systems Inc, Yokogawa Electric Corporation.
3. What are the main segments of the Oil & Gas Digital Transformation Industry?
The market segments include Enabling Technologies, Oil and Gas Industry Activity.
4. Can you provide details about the market size?
The market size is estimated to be USD 90.44 billion as of 2022.
5. What are some drivers contributing to market growth?
Increasing Need to Implement Disruptive Technologies to Optimize Operations & Increase Safety; Regulatory Requirements.
6. What are the notable trends driving market growth?
Downstream Sector is Expected to Witness Major Market Share.
7. Are there any restraints impacting market growth?
; Trade Tensions and Implementation Challenges.
8. Can you provide examples of recent developments in the market?
March 2022 - Kyndryl, an IT infrastructure services provider, signed a five-year, USD 160 million agreement with Motiva Enterprises, owner of North America's largest refinery. Under this agreement, Kyndryl is set to streamline Motiva's IT services, accelerate Motiva's cloud journey, and set the foundation for its enterprise-wide digital transformation.
9. What pricing options are available for accessing the report?
Pricing options include single-user, multi-user, and enterprise licenses priced at USD 4750, USD 5250, and USD 8750 respectively.
10. Is the market size provided in terms of value or volume?
The market size is provided in terms of value, measured in billion.
11. Are there any specific market keywords associated with the report?
Yes, the market keyword associated with the report is "Oil & Gas Digital Transformation Industry," which aids in identifying and referencing the specific market segment covered.
12. How do I determine which pricing option suits my needs best?
The pricing options vary based on user requirements and access needs. Individual users may opt for single-user licenses, while businesses requiring broader access may choose multi-user or enterprise licenses for cost-effective access to the report.
13. Are there any additional resources or data provided in the Oil & Gas Digital Transformation Industry report?
While the report offers comprehensive insights, it's advisable to review the specific contents or supplementary materials provided to ascertain if additional resources or data are available.
14. How can I stay updated on further developments or reports in the Oil & Gas Digital Transformation Industry?
To stay informed about further developments, trends, and reports in the Oil & Gas Digital Transformation Industry, consider subscribing to industry newsletters, following relevant companies and organizations, or regularly checking reputable industry news sources and publications.
Methodology
Step 1 - Identification of Relevant Samples Size from Population Database


Step 2 - Approaches for Defining Global Market Size (Value, Volume* & Price*)

Note*: In applicable scenarios
Step 3 - Data Sources
Primary Research
- Web Analytics
- Survey Reports
- Research Institute
- Latest Research Reports
- Opinion Leaders
Secondary Research
- Annual Reports
- White Paper
- Latest Press Release
- Industry Association
- Paid Database
- Investor Presentations

Step 4 - Data Triangulation
Involves using different sources of information in order to increase the validity of a study
These sources are likely to be stakeholders in a program - participants, other researchers, program staff, other community members, and so on.
Then we put all data in single framework & apply various statistical tools to find out the dynamic on the market.
During the analysis stage, feedback from the stakeholder groups would be compared to determine areas of agreement as well as areas of divergence