

Key Insights
The global airport non-aeronautical revenue market is forecast for significant expansion, projected to achieve a Compound Annual Growth Rate (CAGR) of 14.75%. This robust growth, with an estimated market size of 9.17 billion in the base year 2025, is propelled by a confluence of factors. Rising international passenger volumes, particularly from dynamic Asia-Pacific economies, are stimulating demand for a wider array of airport services. Airports are strategically broadening their income streams beyond traditional aeronautical charges, investing in passenger-centric enhancements. These include elevated retail experiences, superior food and beverage offerings, and advanced baggage handling solutions. This pivot towards non-aeronautical revenue reflects a strategic move towards more stable and predictable income compared to the volatility of airline operations. The increasing appeal of airport-based retail and entertainment, alongside technological advancements that boost operational efficiency and customer convenience, are key drivers of this upward trend. Heightened competition among airports is also fostering innovation and service quality improvements, further contributing to non-aeronautical revenue growth.
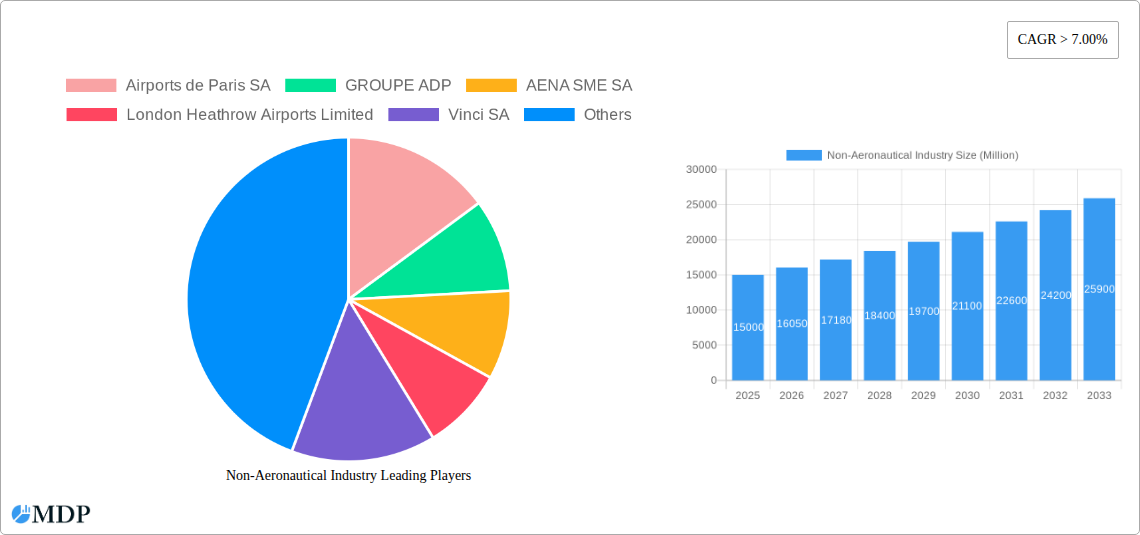
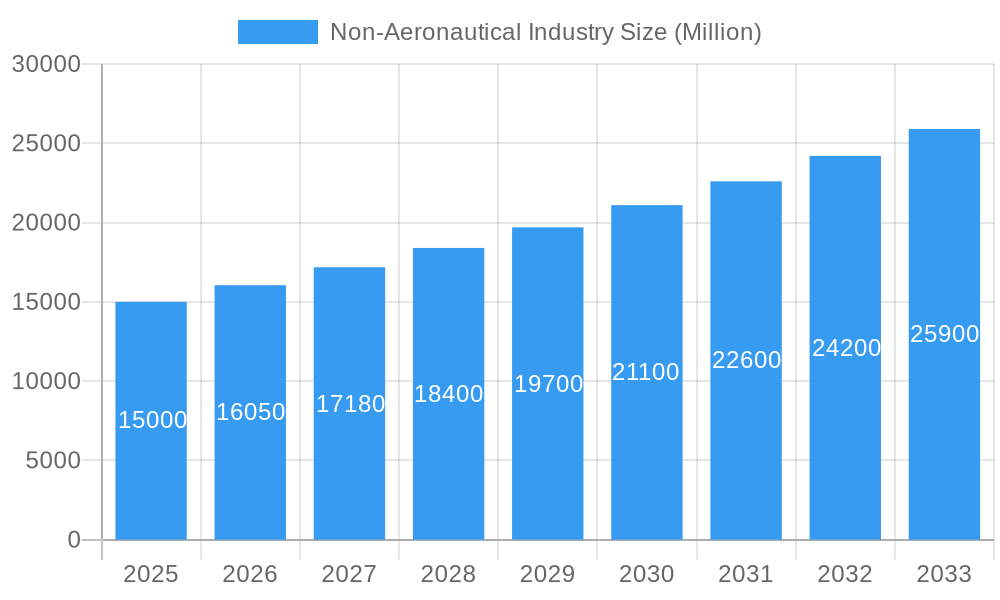
Non-Aeronautical Industry Market Size (In Billion)
Despite potential headwinds from economic downturns affecting passenger traffic and discretionary spending, the long-term market outlook remains highly positive. The integration of smart airport technologies, ongoing global airport infrastructure development, and a concerted effort to optimize passenger journeys are anticipated to effectively counter these challenges. Market segmentation indicates that food services and car rentals currently represent the largest segments of non-aeronautical revenue. However, substantial growth opportunities are emerging within baggage handling systems and other ancillary services, such as premium lounges and duty-free retail. Regionally, North America and Asia-Pacific currently lead the market, while emerging economies in the Middle East and Africa present considerable future growth potential, driven by substantial investments in airport infrastructure.
Non-Aeronautical Industry Company Market Share
Unlock the Potential: A Comprehensive Analysis of the Non-Aeronautical Industry Market (2019-2033)
This in-depth report provides a comprehensive analysis of the Non-Aeronautical Industry market, offering invaluable insights for stakeholders seeking to navigate this dynamic sector. With a focus on key players like Airports de Paris SA, GROUPE ADP, AENA SME SA, and others, the report covers a detailed analysis for the period 2019-2033, with a base year of 2025 and a forecast period of 2025-2033. The market is segmented by key services including Food Services, Car Rentals, Baggage Handling Systems, and Other Services. This report projects a market valuation exceeding $XX Million by 2033, presenting both substantial opportunities and significant challenges.
Non-Aeronautical Industry Market Dynamics & Concentration
The Non-Aeronautical Industry showcases a complex interplay of market concentration, innovative drivers, regulatory frameworks, and competitive dynamics. The market is characterized by a moderate level of concentration, with a handful of major players holding significant market share. For example, Airports de Paris SA and GROUPE ADP collectively hold an estimated xx% market share in the European region as of 2024. However, emerging players and technological advancements are constantly reshaping the landscape.
- Market Concentration: While a few dominant players exist, the market is far from monopolistic, with regional variations in concentration levels.
- Innovation Drivers: Technological advancements in areas like AI-powered baggage handling and personalized passenger experiences drive innovation.
- Regulatory Frameworks: Government regulations regarding airport security, concessions, and environmental standards significantly influence market dynamics.
- Product Substitutes: The rise of online services (e.g., online check-in, digital payment systems) presents some level of substitution to traditional airport services.
- End-User Trends: Growing passenger traffic, rising disposable incomes, and shifting consumer preferences towards enhanced travel experiences shape market demand.
- M&A Activities: The number of M&A deals in the sector has fluctuated, peaking at xx deals in 2022 and then dropping to xx deals in 2023, reflecting consolidation trends and strategic investments.
Non-Aeronautical Industry Industry Trends & Analysis
The Non-Aeronautical Industry is experiencing robust growth, fueled by several key factors. The industry is projected to exhibit a CAGR of xx% during the forecast period (2025-2033), driven by increased air passenger traffic and a growing focus on enhancing the overall passenger experience. Technological disruptions, such as the implementation of self-service kiosks and mobile applications, are increasing efficiency and improving customer satisfaction. This results in a notable market penetration of xx% for these technologies by 2025. However, competitive pressures and economic fluctuations continue to pose challenges.
The increasing adoption of digital technologies has drastically transformed the industry, improving operations, personalizing customer journeys, and streamlining processes. Consumer preferences are shifting towards convenience, speed, and personalization. The competitive dynamics are characterized by a mix of established players and emerging technology companies vying for market share.
Leading Markets & Segments in Non-Aeronautical Industry
The Asia-Pacific region dominates the Non-Aeronautical Industry, driven by rapid economic growth, significant infrastructure investments, and a surge in air passenger traffic. Within this region, countries like China and India exhibit particularly strong growth. Within the services segment, Food Services holds the largest market share, followed by Car Rentals and Baggage Handling Systems.
- Key Drivers in Asia-Pacific:
- Massive infrastructure development projects across multiple airports.
- Rapid growth of the middle class and disposable income.
- Supportive government policies focused on tourism and economic growth.
- Food Services Dominance: The Food Services sector benefits from high passenger traffic and the desire for convenient and diverse food options.
- Car Rental Growth: Increasing demand for mobility solutions near airports fuels the growth of the car rental sector.
- Baggage Handling Systems Evolution: Automation and technological advancements in Baggage Handling Systems drive market growth.
Non-Aeronautical Industry Product Developments
Recent years have witnessed significant product innovations, including the integration of AI-powered systems in baggage handling, the adoption of self-service kiosks, and the development of mobile applications for enhanced passenger experience. These innovations streamline operations, improve efficiency, and enhance customer satisfaction, leading to a significant competitive advantage for early adopters.
Key Drivers of Non-Aeronautical Industry Growth
Growth is primarily driven by increased air passenger traffic globally, spurred by expanding economies and greater affordability of air travel. Furthermore, technological advancements, such as improved baggage handling systems and enhanced passenger services, contribute significantly to the industry’s growth. Supportive government policies and regulations also create a favorable environment for investment and expansion.
Challenges in the Non-Aeronautical Industry Market
The industry faces several challenges, including increasing competition, stringent security regulations, and potential disruptions to supply chains. These factors can lead to increased operational costs and limit profitability. Fluctuations in fuel prices, economic downturns, and geopolitical uncertainties also pose risks to industry growth. The estimated financial impact of these challenges is xx Million annually.
Emerging Opportunities in Non-Aeronautical Industry
The industry is poised for significant long-term growth. Emerging opportunities include leveraging technological advancements such as AI, data analytics, and the Internet of Things (IoT) to personalize customer experiences. Strategic partnerships and joint ventures among industry players can help expand market reach and enhance service offerings.
Leading Players in the Non-Aeronautical Industry Sector
- Airports de Paris SA
- GROUPE ADP
- AENA SME SA
- London Heathrow Airports Limited
- Vinci SA
- Fraport Group
- Korea Airports Cor
- Airports of Thailand Plc
- Airport Authority Hong Kong
- Japan Airport Terminal Co Ltd
Key Milestones in Non-Aeronautical Industry Industry
- 2020: Increased focus on contactless technologies due to the COVID-19 pandemic.
- 2021: Significant investments in digital transformation and automation across several airports.
- 2022: Several major M&A deals reshaped the competitive landscape.
- 2023: Introduction of innovative baggage handling systems utilizing AI and robotics.
- 2024: Growing adoption of sustainable practices in airport operations.
Strategic Outlook for Non-Aeronautical Industry Market
The Non-Aeronautical Industry is set for continued growth, driven by technological advancements, increasing passenger numbers, and the expansion of airport infrastructure. Strategic partnerships, diversification of services, and a focus on sustainability will be crucial for success in this competitive market. The focus on enhancing the passenger experience and operational efficiency remains paramount for future market leadership.
Non-Aeronautical Industry Segmentation
-
1. Services
- 1.1. Food Services
- 1.2. Car Rentals
- 1.3. Baggage Handling Systems
- 1.4. Other Services
Non-Aeronautical Industry Segmentation By Geography
-
1. North America
- 1.1. United States
- 1.2. Canada
-
2. Europe
- 2.1. Germany
- 2.2. United Kingdom
- 2.3. France
- 2.4. Russia
- 2.5. Rest of Europe
-
3. Asia Pacific
- 3.1. India
- 3.2. China
- 3.3. Japan
- 3.4. Rest of Asia Pacific
-
4. Latin America
- 4.1. Brazil
- 4.2. Rest of Latin America
-
5. Middle East and Africa
- 5.1. United Arab Emirates
- 5.2. Saudi Arabia
- 5.3. South Africa
- 5.4. Rest of Middle East and Africa
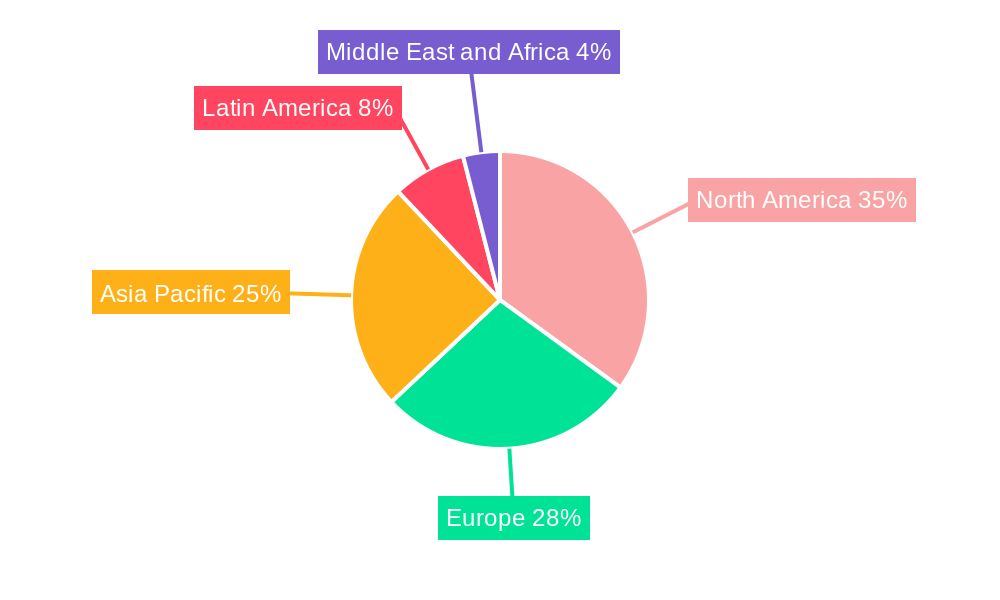
Non-Aeronautical Industry Regional Market Share
Geographic Coverage of Non-Aeronautical Industry
Non-Aeronautical Industry REPORT HIGHLIGHTS
| Aspects | Details |
|---|---|
| Study Period | 2020-2034 |
| Base Year | 2025 |
| Estimated Year | 2026 |
| Forecast Period | 2026-2034 |
| Historical Period | 2020-2025 |
| Growth Rate | CAGR of 14.75% from 2020-2034 |
| Segmentation |
|
Table of Contents
- 1. Introduction
- 1.1. Research Scope
- 1.2. Market Segmentation
- 1.3. Research Objective
- 1.4. Definitions and Assumptions
- 2. Executive Summary
- 2.1. Market Snapshot
- 3. Market Dynamics
- 3.1. Market Drivers
- 3.2. Market Restrains
- 3.3. Market Trends
- 3.4. Market Opportunities
- 4. Market Factor Analysis
- 4.1. Porters Five Forces
- 4.1.1. Bargaining Power of Suppliers
- 4.1.2. Bargaining Power of Buyers
- 4.1.3. Threat of New Entrants
- 4.1.4. Threat of Substitutes
- 4.1.5. Competitive Rivalry
- 4.2. PESTEL analysis
- 4.3. BCG Analysis
- 4.3.1. Stars (High Growth, High Market Share)
- 4.3.2. Cash Cows (Low Growth, High Market Share)
- 4.3.3. Question Mark (High Growth, Low Market Share)
- 4.3.4. Dogs (Low Growth, Low Market Share)
- 4.4. Ansoff Matrix Analysis
- 4.5. Supply Chain Analysis
- 4.6. Regulatory Landscape
- 4.7. Current Market Potential and Opportunity Assessment (TAM–SAM–SOM Framework)
- 4.8. MDP Analyst Note
- 4.1. Porters Five Forces
- 5. Market Analysis, Insights and Forecast 2021-2033
- 5.1. Market Analysis, Insights and Forecast - by Services
- 5.1.1. Food Services
- 5.1.2. Car Rentals
- 5.1.3. Baggage Handling Systems
- 5.1.4. Other Services
- 5.2. Market Analysis, Insights and Forecast - by Region
- 5.2.1. North America
- 5.2.2. Europe
- 5.2.3. Asia Pacific
- 5.2.4. Latin America
- 5.2.5. Middle East and Africa
- 5.1. Market Analysis, Insights and Forecast - by Services
- 6. Global Non-Aeronautical Industry Analysis, Insights and Forecast, 2021-2033
- 6.1. Market Analysis, Insights and Forecast - by Services
- 6.1.1. Food Services
- 6.1.2. Car Rentals
- 6.1.3. Baggage Handling Systems
- 6.1.4. Other Services
- 6.1. Market Analysis, Insights and Forecast - by Services
- 7. North America Non-Aeronautical Industry Analysis, Insights and Forecast, 2020-2032
- 7.1. Market Analysis, Insights and Forecast - by Services
- 7.1.1. Food Services
- 7.1.2. Car Rentals
- 7.1.3. Baggage Handling Systems
- 7.1.4. Other Services
- 7.1. Market Analysis, Insights and Forecast - by Services
- 8. Europe Non-Aeronautical Industry Analysis, Insights and Forecast, 2020-2032
- 8.1. Market Analysis, Insights and Forecast - by Services
- 8.1.1. Food Services
- 8.1.2. Car Rentals
- 8.1.3. Baggage Handling Systems
- 8.1.4. Other Services
- 8.1. Market Analysis, Insights and Forecast - by Services
- 9. Asia Pacific Non-Aeronautical Industry Analysis, Insights and Forecast, 2020-2032
- 9.1. Market Analysis, Insights and Forecast - by Services
- 9.1.1. Food Services
- 9.1.2. Car Rentals
- 9.1.3. Baggage Handling Systems
- 9.1.4. Other Services
- 9.1. Market Analysis, Insights and Forecast - by Services
- 10. Latin America Non-Aeronautical Industry Analysis, Insights and Forecast, 2020-2032
- 10.1. Market Analysis, Insights and Forecast - by Services
- 10.1.1. Food Services
- 10.1.2. Car Rentals
- 10.1.3. Baggage Handling Systems
- 10.1.4. Other Services
- 10.1. Market Analysis, Insights and Forecast - by Services
- 11. Middle East and Africa Non-Aeronautical Industry Analysis, Insights and Forecast, 2020-2032
- 11.1. Market Analysis, Insights and Forecast - by Services
- 11.1.1. Food Services
- 11.1.2. Car Rentals
- 11.1.3. Baggage Handling Systems
- 11.1.4. Other Services
- 11.1. Market Analysis, Insights and Forecast - by Services
- 12. Competitive Analysis
- 12.1. Company Profiles
- 12.1.1 Airports de Paris SA
- 12.1.1.1. Company Overview
- 12.1.1.2. Products
- 12.1.1.3. Company Financials
- 12.1.1.4. SWOT Analysis
- 12.1.2 GROUPE ADP
- 12.1.2.1. Company Overview
- 12.1.2.2. Products
- 12.1.2.3. Company Financials
- 12.1.2.4. SWOT Analysis
- 12.1.3 AENA SME SA
- 12.1.3.1. Company Overview
- 12.1.3.2. Products
- 12.1.3.3. Company Financials
- 12.1.3.4. SWOT Analysis
- 12.1.4 London Heathrow Airports Limited
- 12.1.4.1. Company Overview
- 12.1.4.2. Products
- 12.1.4.3. Company Financials
- 12.1.4.4. SWOT Analysis
- 12.1.5 Vinci SA
- 12.1.5.1. Company Overview
- 12.1.5.2. Products
- 12.1.5.3. Company Financials
- 12.1.5.4. SWOT Analysis
- 12.1.6 Fraport Group
- 12.1.6.1. Company Overview
- 12.1.6.2. Products
- 12.1.6.3. Company Financials
- 12.1.6.4. SWOT Analysis
- 12.1.7 Korea Airports Cor
- 12.1.7.1. Company Overview
- 12.1.7.2. Products
- 12.1.7.3. Company Financials
- 12.1.7.4. SWOT Analysis
- 12.1.8 Airports of Thailand Plc
- 12.1.8.1. Company Overview
- 12.1.8.2. Products
- 12.1.8.3. Company Financials
- 12.1.8.4. SWOT Analysis
- 12.1.9 Airport Authority Hong Kong
- 12.1.9.1. Company Overview
- 12.1.9.2. Products
- 12.1.9.3. Company Financials
- 12.1.9.4. SWOT Analysis
- 12.1.10 Japan Airport Terminal Co Ltd
- 12.1.10.1. Company Overview
- 12.1.10.2. Products
- 12.1.10.3. Company Financials
- 12.1.10.4. SWOT Analysis
- 12.1.1 Airports de Paris SA
- 12.2. Market Entropy
- 12.2.1 Company's Key Areas Served
- 12.2.2 Recent Developments
- 12.3. Company Market Share Analysis 2025
- 12.3.1 Top 5 Companies Market Share Analysis
- 12.3.2 Top 3 Companies Market Share Analysis
- 12.4. List of Potential Customers
- 13. Research Methodology
List of Figures
- Figure 1: Global Non-Aeronautical Industry Revenue Breakdown (billion, %) by Region 2025 & 2033
- Figure 2: North America Non-Aeronautical Industry Revenue (billion), by Services 2025 & 2033
- Figure 3: North America Non-Aeronautical Industry Revenue Share (%), by Services 2025 & 2033
- Figure 4: North America Non-Aeronautical Industry Revenue (billion), by Country 2025 & 2033
- Figure 5: North America Non-Aeronautical Industry Revenue Share (%), by Country 2025 & 2033
- Figure 6: Europe Non-Aeronautical Industry Revenue (billion), by Services 2025 & 2033
- Figure 7: Europe Non-Aeronautical Industry Revenue Share (%), by Services 2025 & 2033
- Figure 8: Europe Non-Aeronautical Industry Revenue (billion), by Country 2025 & 2033
- Figure 9: Europe Non-Aeronautical Industry Revenue Share (%), by Country 2025 & 2033
- Figure 10: Asia Pacific Non-Aeronautical Industry Revenue (billion), by Services 2025 & 2033
- Figure 11: Asia Pacific Non-Aeronautical Industry Revenue Share (%), by Services 2025 & 2033
- Figure 12: Asia Pacific Non-Aeronautical Industry Revenue (billion), by Country 2025 & 2033
- Figure 13: Asia Pacific Non-Aeronautical Industry Revenue Share (%), by Country 2025 & 2033
- Figure 14: Latin America Non-Aeronautical Industry Revenue (billion), by Services 2025 & 2033
- Figure 15: Latin America Non-Aeronautical Industry Revenue Share (%), by Services 2025 & 2033
- Figure 16: Latin America Non-Aeronautical Industry Revenue (billion), by Country 2025 & 2033
- Figure 17: Latin America Non-Aeronautical Industry Revenue Share (%), by Country 2025 & 2033
- Figure 18: Middle East and Africa Non-Aeronautical Industry Revenue (billion), by Services 2025 & 2033
- Figure 19: Middle East and Africa Non-Aeronautical Industry Revenue Share (%), by Services 2025 & 2033
- Figure 20: Middle East and Africa Non-Aeronautical Industry Revenue (billion), by Country 2025 & 2033
- Figure 21: Middle East and Africa Non-Aeronautical Industry Revenue Share (%), by Country 2025 & 2033
List of Tables
- Table 1: Global Non-Aeronautical Industry Revenue billion Forecast, by Services 2020 & 2033
- Table 2: Global Non-Aeronautical Industry Revenue billion Forecast, by Region 2020 & 2033
- Table 3: Global Non-Aeronautical Industry Revenue billion Forecast, by Services 2020 & 2033
- Table 4: Global Non-Aeronautical Industry Revenue billion Forecast, by Country 2020 & 2033
- Table 5: United States Non-Aeronautical Industry Revenue (billion) Forecast, by Application 2020 & 2033
- Table 6: Canada Non-Aeronautical Industry Revenue (billion) Forecast, by Application 2020 & 2033
- Table 7: Global Non-Aeronautical Industry Revenue billion Forecast, by Services 2020 & 2033
- Table 8: Global Non-Aeronautical Industry Revenue billion Forecast, by Country 2020 & 2033
- Table 9: Germany Non-Aeronautical Industry Revenue (billion) Forecast, by Application 2020 & 2033
- Table 10: United Kingdom Non-Aeronautical Industry Revenue (billion) Forecast, by Application 2020 & 2033
- Table 11: France Non-Aeronautical Industry Revenue (billion) Forecast, by Application 2020 & 2033
- Table 12: Russia Non-Aeronautical Industry Revenue (billion) Forecast, by Application 2020 & 2033
- Table 13: Rest of Europe Non-Aeronautical Industry Revenue (billion) Forecast, by Application 2020 & 2033
- Table 14: Global Non-Aeronautical Industry Revenue billion Forecast, by Services 2020 & 2033
- Table 15: Global Non-Aeronautical Industry Revenue billion Forecast, by Country 2020 & 2033
- Table 16: India Non-Aeronautical Industry Revenue (billion) Forecast, by Application 2020 & 2033
- Table 17: China Non-Aeronautical Industry Revenue (billion) Forecast, by Application 2020 & 2033
- Table 18: Japan Non-Aeronautical Industry Revenue (billion) Forecast, by Application 2020 & 2033
- Table 19: Rest of Asia Pacific Non-Aeronautical Industry Revenue (billion) Forecast, by Application 2020 & 2033
- Table 20: Global Non-Aeronautical Industry Revenue billion Forecast, by Services 2020 & 2033
- Table 21: Global Non-Aeronautical Industry Revenue billion Forecast, by Country 2020 & 2033
- Table 22: Brazil Non-Aeronautical Industry Revenue (billion) Forecast, by Application 2020 & 2033
- Table 23: Rest of Latin America Non-Aeronautical Industry Revenue (billion) Forecast, by Application 2020 & 2033
- Table 24: Global Non-Aeronautical Industry Revenue billion Forecast, by Services 2020 & 2033
- Table 25: Global Non-Aeronautical Industry Revenue billion Forecast, by Country 2020 & 2033
- Table 26: United Arab Emirates Non-Aeronautical Industry Revenue (billion) Forecast, by Application 2020 & 2033
- Table 27: Saudi Arabia Non-Aeronautical Industry Revenue (billion) Forecast, by Application 2020 & 2033
- Table 28: South Africa Non-Aeronautical Industry Revenue (billion) Forecast, by Application 2020 & 2033
- Table 29: Rest of Middle East and Africa Non-Aeronautical Industry Revenue (billion) Forecast, by Application 2020 & 2033
Frequently Asked Questions
1. What is the projected Compound Annual Growth Rate (CAGR) of the Non-Aeronautical Industry?
The projected CAGR is approximately 14.75%.
2. Which companies are prominent players in the Non-Aeronautical Industry?
Key companies in the market include Airports de Paris SA, GROUPE ADP, AENA SME SA, London Heathrow Airports Limited, Vinci SA, Fraport Group, Korea Airports Cor, Airports of Thailand Plc, Airport Authority Hong Kong, Japan Airport Terminal Co Ltd.
3. What are the main segments of the Non-Aeronautical Industry?
The market segments include Services.
4. Can you provide details about the market size?
The market size is estimated to be USD 9.17 billion as of 2022.
5. What are some drivers contributing to market growth?
N/A
6. What are the notable trends driving market growth?
Ground Handling Systems Will Showcase Significant Growth During the Forecast Period.
7. Are there any restraints impacting market growth?
N/A
8. Can you provide examples of recent developments in the market?
N/A
9. What pricing options are available for accessing the report?
Pricing options include single-user, multi-user, and enterprise licenses priced at USD 4750, USD 5250, and USD 8750 respectively.
10. Is the market size provided in terms of value or volume?
The market size is provided in terms of value, measured in billion.
11. Are there any specific market keywords associated with the report?
Yes, the market keyword associated with the report is "Non-Aeronautical Industry," which aids in identifying and referencing the specific market segment covered.
12. How do I determine which pricing option suits my needs best?
The pricing options vary based on user requirements and access needs. Individual users may opt for single-user licenses, while businesses requiring broader access may choose multi-user or enterprise licenses for cost-effective access to the report.
13. Are there any additional resources or data provided in the Non-Aeronautical Industry report?
While the report offers comprehensive insights, it's advisable to review the specific contents or supplementary materials provided to ascertain if additional resources or data are available.
14. How can I stay updated on further developments or reports in the Non-Aeronautical Industry?
To stay informed about further developments, trends, and reports in the Non-Aeronautical Industry, consider subscribing to industry newsletters, following relevant companies and organizations, or regularly checking reputable industry news sources and publications.
Methodology
Step 1 - Identification of Relevant Samples Size from Population Database


Step 2 - Approaches for Defining Global Market Size (Value, Volume* & Price*)

Note*: In applicable scenarios
Step 3 - Data Sources
Primary Research
- Web Analytics
- Survey Reports
- Research Institute
- Latest Research Reports
- Opinion Leaders
Secondary Research
- Annual Reports
- White Paper
- Latest Press Release
- Industry Association
- Paid Database
- Investor Presentations

Step 4 - Data Triangulation
Involves using different sources of information in order to increase the validity of a study
These sources are likely to be stakeholders in a program - participants, other researchers, program staff, other community members, and so on.
Then we put all data in single framework & apply various statistical tools to find out the dynamic on the market.
During the analysis stage, feedback from the stakeholder groups would be compared to determine areas of agreement as well as areas of divergence